Translations of Graphs (DP IB Analysis & Approaches (AA): HL): Revision Note

Translations of graphs

What are translations of graphs?

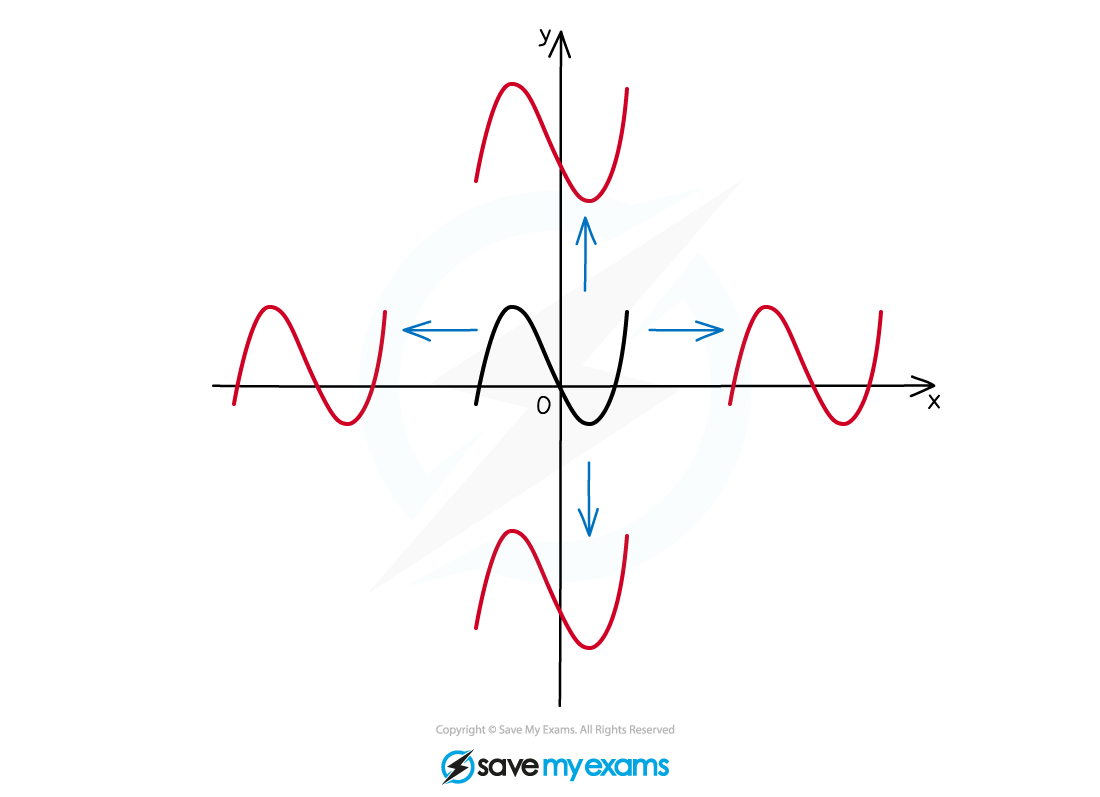
  • A translation is when:

    • the graph is moved (up or down, left or right) in the xy plane

      • i.e. its position changes

    • but the shape, size, and orientation remain unchanged

  • How far left/right or up/down is specified by a translation vector (xy):

    • x is the horizontal displacement

      • Positive moves right

      • Negative moves left

    • y is the vertical displacement

      • Positive moves up

      • Negative moves down

Graph showing sine wave translated vertically and horizontally with red and black curves, blue arrows indicating direction on x and y axes.

How do I find the graph equation after a horizontal translation?

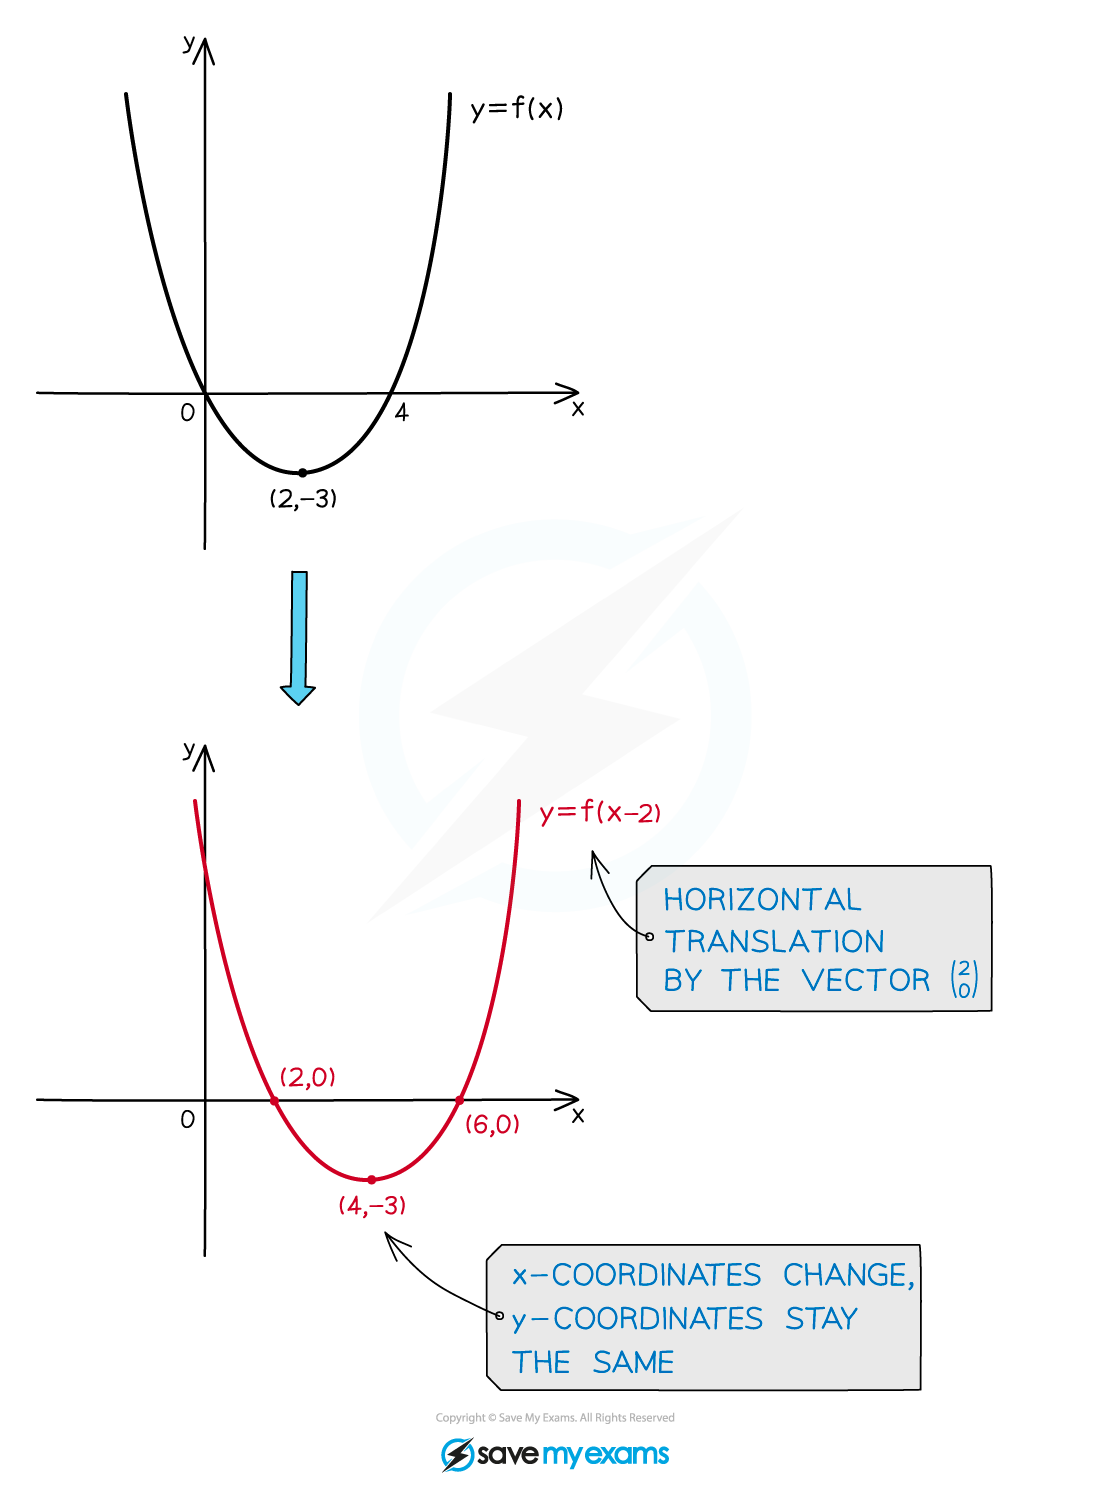
  • A horizontal translation of the graph y=f(x) by a units to the right, i.e. the vector (a0), is represented by the equation

    • y=f(xa)

Examiner Tips and Tricks

It is a common mistake to think that x is replaced by (x+a) when translating a units to the right!

  • Any vertical asymptotes will also be translated

    • x=k becomes x=k+a

    • Horizontal asymptotes stay the same

  • To translate a graph a units to the left

    • i.e. the vector (a0)

      • the equation becomes y=f(x+a)

Two graphs of functions with parabolas. Top graph: \(y=f(x)\), vertex at (2,-3). Bottom graph: horizontal translation to \(y=f(x-2)\), vertex at (4,-3).

How do I find the graph equation after a vertical translation?

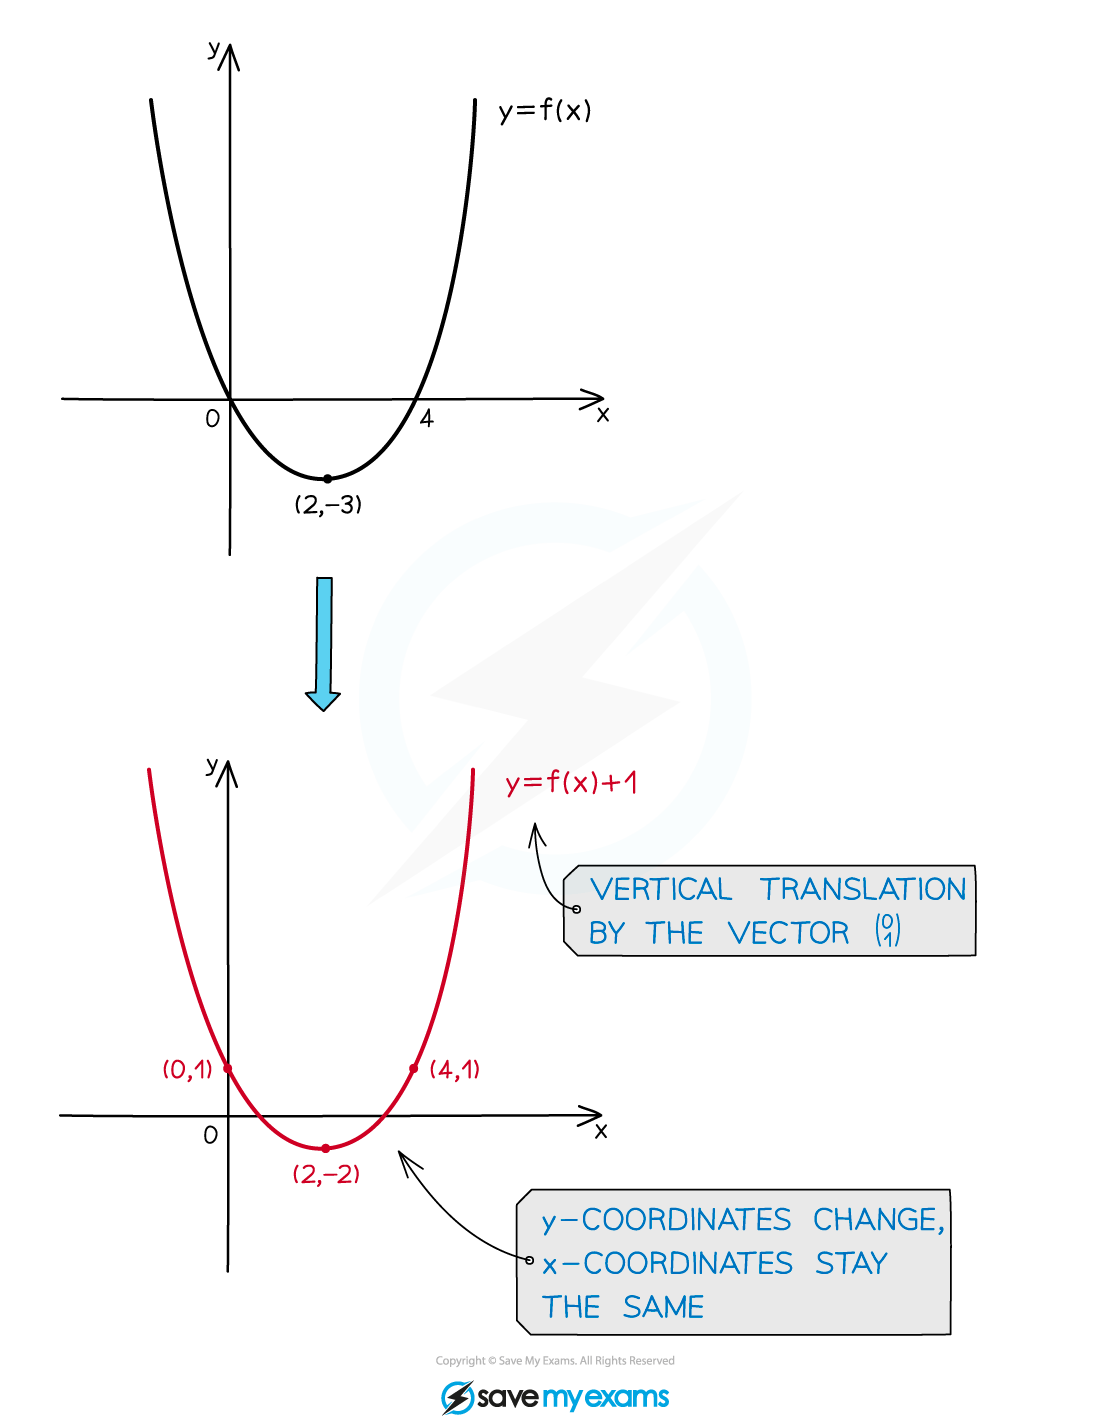
  • A vertical translation of the graph y=f(x) by b units up, i.e. the vector (0b), is represented by

    •  y=f(x)+b

  • Similarly a vertical translation b units down

    • i.e. the vector (0b)

      • has the equation y=f(x)b

  • Horizontal asymptotes change

    •  y=k becomes  y=k+b

  • Vertical asymptotes stay the same

Two graphs show a quadratic function y=f(x) and its vertical translation y=f(x)+1. The function shifts up, moving point (2, -3) to (2, -2).

Examiner Tips and Tricks

To get full marks in an exam make sure you use correct mathematical terminology, e.g. translate by the vector (24).

Worked Example

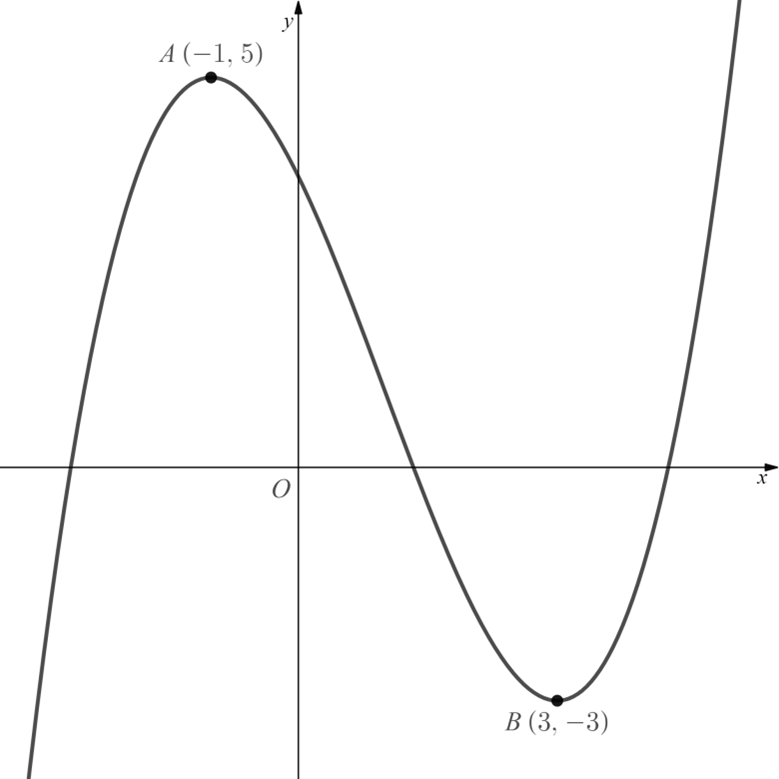
The diagram below shows the graph of y=f(x).

we-image

(a) Sketch the graph of y=f(x+3).

Answer:

2-5-1-ib-aa-sl-translate-graph-a-we-solution

(b) Sketch the graph of y=f(x)+3.

Answer:

2-5-1-ib-aa-sl-translate-graph-b-we-solution

Unlock more, it's free!

Join the 100,000+ Students that ❤️ Save My Exams

the (exam) results speak for themselves:

Build on this topic

Dan Finlay

Author: Dan Finlay

Expertise: Portfolio Lead

Dan graduated from the University of Oxford with a First class degree in mathematics. As well as teaching maths for over 8 years, Dan has marked a range of exams for Edexcel, tutored students and taught A Level Accounting. Dan has a keen interest in statistics and probability and their real-life applications.

Mark Curtis

Reviewer: Mark Curtis

Expertise: Maths Content Creator

Mark graduated twice from the University of Oxford: once in 2009 with a First in Mathematics, then again in 2013 with a PhD (DPhil) in Mathematics. He has had nine successful years as a secondary school teacher, specialising in A-Level Further Maths and running extension classes for Oxbridge Maths applicants. Alongside his teaching, he has written five internal textbooks, introduced new spiralling school curriculums and trained other Maths teachers through outreach programmes.