Venn Diagrams (DP IB Analysis & Approaches (AA)): Revision Note

Did this video help you?
Venn diagrams
What is a Venn diagram?
A Venn diagram is a way to illustrate events from an experiment and are particularly useful when there is an overlap between possible outcomes
A Venn diagram consists of
a rectangle representing the sample space (U)
The rectangle is labelled U
Some mathematicians instead use S or ξ
a circle for each event
Circles may or may not overlap depending on which outcomes are shared between events
The numbers in the circles represent either the frequency of that event or the probability of that event
If the frequencies are used then they should add up to the total frequency
If the probabilities are used then they should add up to 1
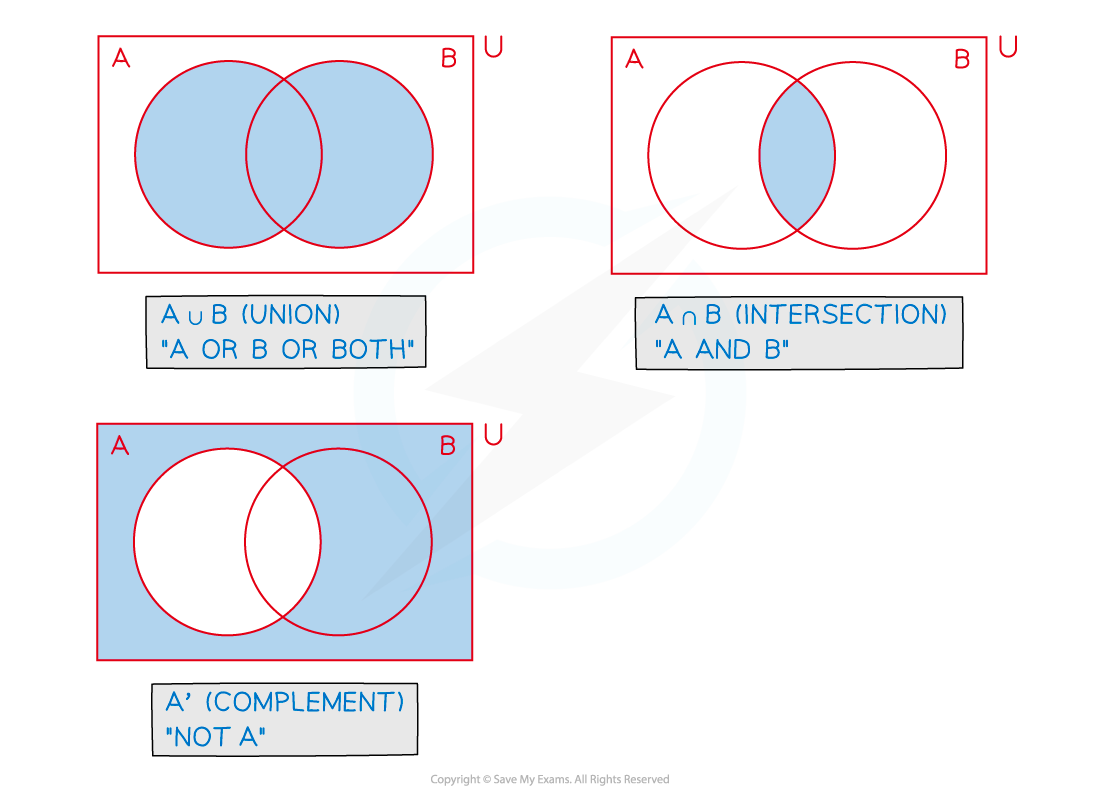
What do the different regions mean on a Venn diagram?
format('truetype')%3Bfont-weight%3Anormal%3Bfont-style%3Anormal%3B%7D%3C%2Fstyle%3E%3C%2Fdefs%3E%3Ctext%20font-family%3D%22Times%20New%20Roman%22%20font-size%3D%2218%22%20font-style%3D%22italic%22%20text-anchor%3D%22middle%22%20x%3D%226.5%22%20y%3D%2218%22%3EA%3C%2Ftext%3E%3Ctext%20font-family%3D%22math1d67d8ab4f4c10bf22aa353e278%22%20font-size%3D%2218%22%20text-anchor%3D%22middle%22%20x%3D%2216.5%22%20y%3D%2218%22%3E'%3C%2Ftext%3E%3C%2Fsvg%3E) is represented by the regions that are not in the A circle
is represented by the regions that are not in the A circleformat('truetype')%3Bfont-weight%3Anormal%3Bfont-style%3Anormal%3B%7D%3C%2Fstyle%3E%3C%2Fdefs%3E%3Ctext%20font-family%3D%22Times%20New%20Roman%22%20font-size%3D%2218%22%20font-style%3D%22italic%22%20text-anchor%3D%22middle%22%20x%3D%226.5%22%20y%3D%2216%22%3EA%3C%2Ftext%3E%3Ctext%20font-family%3D%22math10fd600c953cde8121262e322ef%22%20font-size%3D%2216%22%20text-anchor%3D%22middle%22%20x%3D%2222.5%22%20y%3D%2216%22%3E%26%23x2229%3B%3C%2Ftext%3E%3Ctext%20font-family%3D%22Times%20New%20Roman%22%20font-size%3D%2218%22%20font-style%3D%22italic%22%20text-anchor%3D%22middle%22%20x%3D%2237.5%22%20y%3D%2216%22%3EB%3C%2Ftext%3E%3C%2Fsvg%3E) is represented by the region where the A and B circles overlap
is represented by the region where the A and B circles overlapformat('truetype')%3Bfont-weight%3Anormal%3Bfont-style%3Anormal%3B%7D%3C%2Fstyle%3E%3C%2Fdefs%3E%3Ctext%20font-family%3D%22Times%20New%20Roman%22%20font-size%3D%2218%22%20font-style%3D%22italic%22%20text-anchor%3D%22middle%22%20x%3D%226.5%22%20y%3D%2216%22%3EA%3C%2Ftext%3E%3Ctext%20font-family%3D%22math1b8002139cdde66b87638f7f91d%22%20font-size%3D%2216%22%20text-anchor%3D%22middle%22%20x%3D%2222.5%22%20y%3D%2216%22%3E%26%23x222A%3B%3C%2Ftext%3E%3Ctext%20font-family%3D%22Times%20New%20Roman%22%20font-size%3D%2218%22%20font-style%3D%22italic%22%20text-anchor%3D%22middle%22%20x%3D%2237.5%22%20y%3D%2216%22%3EB%3C%2Ftext%3E%3C%2Fsvg%3E) is represented by the regions that are in A or B or both
is represented by the regions that are in A or B or bothVenn diagrams show ‘AND’ and ‘OR’ statements easily
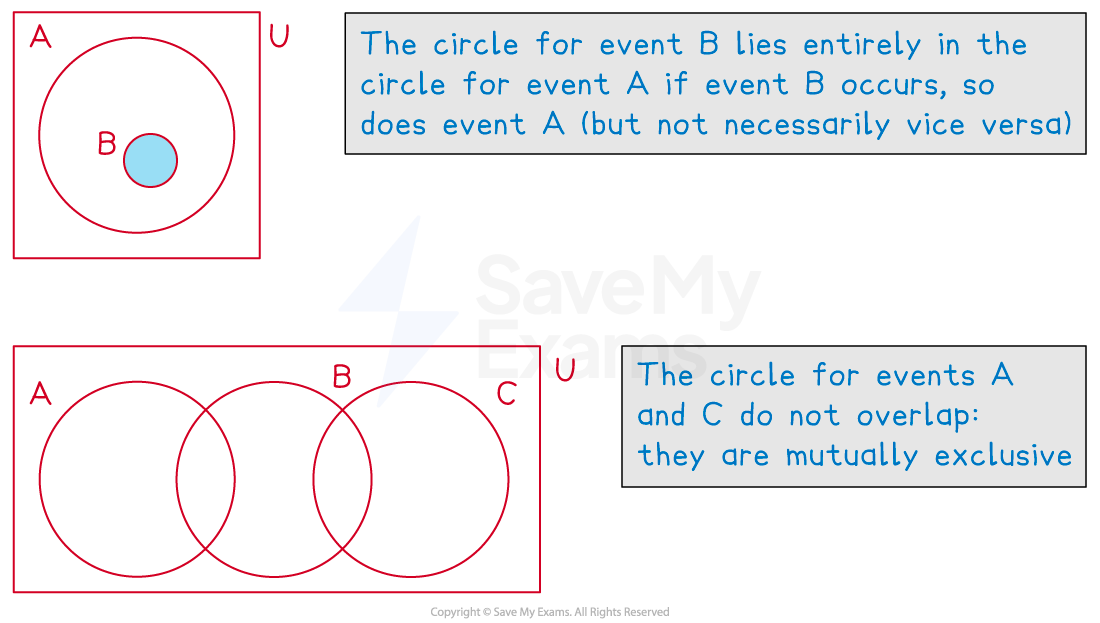
Venn diagrams also instantly show mutually exclusive events as these circles will not overlap
Independent events cannot be seen instantly
You need to use probabilities to deduce if two events are independent
How do I solve probability problems involving Venn diagrams?
Draw, or add to a given Venn diagram, filling in as many values as possible from the information provided in the question
It is usually helpful to work from the centre outwards
Fill in intersections (overlaps) first
If two events are independent you can use the formula
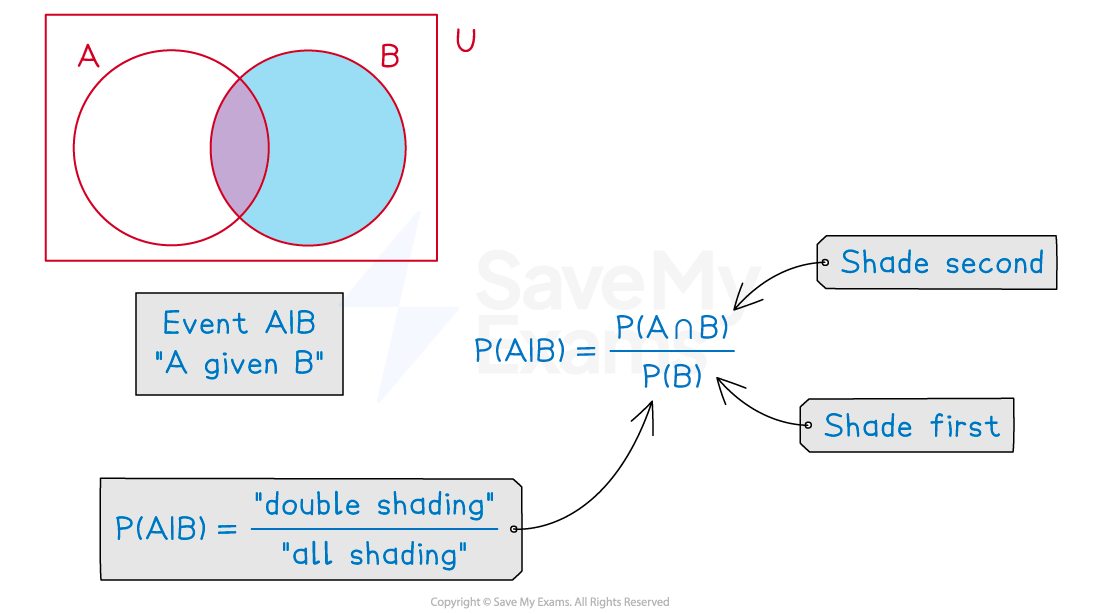
To find the conditional probability
%3C%2Fmo%3E%3C%2Fmath%3E--%3E%3Cdefs%3E%3Cstyle%20type%3D%22text%2Fcss%22%3E%40font-face%7Bfont-family%3A'math1c8ffe9a587b126f152ed3d89a1'%3Bsrc%3Aurl(data%3Afont%2Ftruetype%3Bcharset%3Dutf-8%3Bbase64%2CAAEAAAAMAIAAAwBAT1MvMi7iBBMAAADMAAAATmNtYXDEvmKUAAABHAAAADRjdnQgDVUNBwAAAVAAAAA6Z2x5ZoPi2VsAAAGMAAAAX2hlYWQQC2qxAAAB7AAAADZoaGVhCGsXSAAAAiQAAAAkaG10eE2rRkcAAAJIAAAACGxvY2EAHTwYAAACUAAAAAxtYXhwBT0FPgAAAlwAAAAgbmFtZaBxlY4AAAJ8AAABn3Bvc3QB9wD6AAAEHAAAACBwcmVwa1uragAABDwAAAAUAAADSwGQAAUAAAQABAAAAAAABAAEAAAAAAAAAQEAAAAAAAAAAAAAAAAAAAAAAAAAAAAAAAAAAAAAACAgICAAAAAg1UADev96AAAD6ACWAAAAAAACAAEAAQAAABQAAwABAAAAFAAEACAAAAAEAAQAAQAAAHz%2F%2FwAAAHz%2F%2F%2F%2BFAAEAAAAAAAABVAMsAIABAABWACoCWAIeAQ4BLAIsAFoBgAKAAKAA1ACAAAAAAAAAACsAVQCAAKsA1QEAASsABwAAAAIAVQAAAwADqwADAAcAADMRIRElIREhVQKr%2FasCAP4AA6v8VVUDAAABAHD%2FIADAA3AAAwAfGAGwAy%2BwADyxAgL1sAE8ALEDAD%2BwAjx8sQAG9bABPBczESNwUFDgBFAAAAEAAAABAADVeM5BXw889QADBAD%2F%2F%2F%2F%2F1joTc%2F%2F%2F%2F%2F%2FWOhNzAAD%2FIASAA6sAAAAKAAIAAQAAAAAAAQAAA%2Bj%2FagAAF3AAAP%2B2BIAAAQAAAAAAAAAAAAAAAAAAAAIDUgBVATAAcAAAAAAAAAAoAAAAXwABAAAAAgBeAAUAAAAAAAIAgAQAAAAAAAQAAN4AAAAAAAAAFQECAAAAAAAAAAEAEgAAAAAAAAAAAAIADgASAAAAAAAAAAMAMAAgAAAAAAAAAAQAEgBQAAAAAAAAAAUAFgBiAAAAAAAAAAYACQB4AAAAAAAAAAgAHACBAAEAAAAAAAEAEgAAAAEAAAAAAAIADgASAAEAAAAAAAMAMAAgAAEAAAAAAAQAEgBQAAEAAAAAAAUAFgBiAAEAAAAAAAYACQB4AAEAAAAAAAgAHACBAAMAAQQJAAEAEgAAAAMAAQQJAAIADgASAAMAAQQJAAMAMAAgAAMAAQQJAAQAEgBQAAMAAQQJAAUAFgBiAAMAAQQJAAYACQB4AAMAAQQJAAgAHACBAE0AYQB0AGgAIABGAG8AbgB0AFIAZQBnAHUAbABhAHIATQBhAHQAaABzACAARgBvAHIAIABNAG8AcgBlACAATQBhAHQAaAAgAEYAbwBuAHQATQBhAHQAaAAgAEYAbwBuAHQAVgBlAHIAcwBpAG8AbgAgADEALgAwTWF0aF9Gb250AE0AYQB0AGgAcwAgAEYAbwByACAATQBvAHIAZQAAAwAAAAAAAAH0APoAAAAAAAAAAAAAAAAAAAAAAAAAALkHEQAAjYUYALIAAAAVFBOxAAE%2F)format('truetype')%3Bfont-weight%3Anormal%3Bfont-style%3Anormal%3B%7D%40font-face%7Bfont-family%3A'round_brackets18549f92a457f2409'%3Bsrc%3Aurl(data%3Afont%2Ftruetype%3Bcharset%3Dutf-8%3Bbase64%2CAAEAAAAMAIAAAwBAT1MvMjwHLFQAAADMAAAATmNtYXDf7xCrAAABHAAAADxjdnQgBAkDLgAAAVgAAAASZ2x5ZmAOz2cAAAFsAAABJGhlYWQOKih8AAACkAAAADZoaGVhCvgVwgAAAsgAAAAkaG10eCA6AAIAAALsAAAADGxvY2EAAARLAAAC%2BAAAABBtYXhwBIgEWQAAAwgAAAAgbmFtZXHR30MAAAMoAAACOXBvc3QDogHPAAAFZAAAACBwcmVwupWEAAAABYQAAAAHAAAGcgGQAAUAAAgACAAAAAAACAAIAAAAAAAAAQIAAAAAAAAAAAAAAAAAAAAAAAAAAAAAAAAAAAAAACAgICAAAAAo8AMGe%2F57AAAHPgGyAAAAAAACAAEAAQAAABQAAwABAAAAFAAEACgAAAAGAAQAAQACACgAKf%2F%2FAAAAKAAp%2F%2F%2F%2F2f%2FZAAEAAAAAAAAAAAFUAFYBAAAsAKgDgAAyAAcAAAACAAAAKgDVA1UAAwAHAAA1MxEjEyMRM9XVq4CAKgMr%2FQAC1QABAAD%2B0AIgBtAACQBNGAGwChCwA9SwAxCwAtSwChCwBdSwBRCwANSwAxCwBzywAhCwCDwAsAoQsAPUsAMQsAfUsAoQsAXUsAoQsADUsAMQsAI8sAcQsAg8MTAREAEzABEQASMAAZCQ%2FnABkJD%2BcALQ%2FZD%2BcAGQAnACcAGQ%2FnAAAQAA%2FtACIAbQAAkATRgBsAoQsAPUsAMQsALUsAoQsAXUsAUQsADUsAMQsAc8sAIQsAg8ALAKELAD1LADELAH1LAKELAF1LAKELAA1LADELACPLAHELAIPDEwARABIwAREAEzAAIg%2FnCQAZD%2BcJABkALQ%2FZD%2BcAGQAnACcAGQ%2FnAAAQAAAAEAAPW2NYFfDzz1AAMIAP%2F%2F%2F%2F%2FVre7u%2F%2F%2F%2F%2F9Wt7u4AAP7QA7cG0AAAAAoAAgABAAAAAAABAAAHPv5OAAAXcAAA%2F%2F4DtwABAAAAAAAAAAAAAAAAAAAAAwDVAAACIAAAAiAAAAAAAAAAAAAkAAAAowAAASQAAQAAAAMACgACAAAAAAACAIAEAAAAAAAEAABNAAAAAAAAABUBAgAAAAAAAAABAD4AAAAAAAAAAAACAA4APgAAAAAAAAADAFwATAAAAAAAAAAEAD4AqAAAAAAAAAAFABYA5gAAAAAAAAAGAB8A%2FAAAAAAAAAAIABwBGwABAAAAAAABAD4AAAABAAAAAAACAA4APgABAAAAAAADAFwATAABAAAAAAAEAD4AqAABAAAAAAAFABYA5gABAAAAAAAGAB8A%2FAABAAAAAAAIABwBGwADAAEECQABAD4AAAADAAEECQACAA4APgADAAEECQADAFwATAADAAEECQAEAD4AqAADAAEECQAFABYA5gADAAEECQAGAB8A%2FAADAAEECQAIABwBGwBSAG8AdQBuAGQAIABiAHIAYQBjAGsAZQB0AHMAIAB3AGkAdABoACAAYQBzAGMAZQBuAHQAIAAxADgANQA0AFIAZQBnAHUAbABhAHIATQBhAHQAaABzACAARgBvAHIAIABNAG8AcgBlACAAUgBvAHUAbgBkACAAYgByAGEAYwBrAGUAdABzACAAdwBpAHQAaAAgAGEAcwBjAGUAbgB0ACAAMQA4ADUANABSAG8AdQBuAGQAIABiAHIAYQBjAGsAZQB0AHMAIAB3AGkAdABoACAAYQBzAGMAZQBuAHQAIAAxADgANQA0AFYAZQByAHMAaQBvAG4AIAAyAC4AMFJvdW5kX2JyYWNrZXRzX3dpdGhfYXNjZW50XzE4NTQATQBhAHQAaABzACAARgBvAHIAIABNAG8AcgBlAAAAAAMAAAAAAAADnwHPAAAAAAAAAAAAAAAAAAAAAAAAAAC5B%2F8AAY2FAA%3D%3D)format('truetype')%3Bfont-weight%3Anormal%3Bfont-style%3Anormal%3B%7D%3C%2Fstyle%3E%3C%2Fdefs%3E%3Ctext%20font-family%3D%22Times%20New%20Roman%22%20font-size%3D%2218%22%20text-anchor%3D%22middle%22%20x%3D%225.5%22%20y%3D%2216%22%3EP%3C%2Ftext%3E%3Ctext%20font-family%3D%22round_brackets18549f92a457f2409%22%20font-size%3D%2218%22%20text-anchor%3D%22middle%22%20x%3D%2213.5%22%20y%3D%2216%22%3E(%3C%2Ftext%3E%3Ctext%20font-family%3D%22Times%20New%20Roman%22%20font-size%3D%2218%22%20font-style%3D%22italic%22%20text-anchor%3D%22middle%22%20x%3D%2222.5%22%20y%3D%2216%22%3EA%3C%2Ftext%3E%3Ctext%20font-family%3D%22math1c8ffe9a587b126f152ed3d89a1%22%20font-size%3D%2216%22%20text-anchor%3D%22middle%22%20x%3D%2233.5%22%20y%3D%2216%22%3E%7C%3C%2Ftext%3E%3Ctext%20font-family%3D%22Times%20New%20Roman%22%20font-size%3D%2218%22%20font-style%3D%22italic%22%20text-anchor%3D%22middle%22%20x%3D%2243.5%22%20y%3D%2216%22%3EB%3C%2Ftext%3E%3Ctext%20font-family%3D%22round_brackets18549f92a457f2409%22%20font-size%3D%2218%22%20text-anchor%3D%22middle%22%20x%3D%2252.5%22%20y%3D%2216%22%3E)%3C%2Ftext%3E%3C%2Fsvg%3E)
Add together the frequencies/probabilities in the B circle
This is your denominator
Out of those frequencies/probabilities add together the ones that are also in the A circle
This is your numerator
Evaluate the fraction
Examiner Tips and Tricks
If you struggle to fill in a Venn diagram in an exam:
Label the missing parts using algebra
Form equations using known facts such as:
The sum of all the probabilities should be 1
P(A∩B)=P(A)P(B) if A and B are independent events
Worked Example
40 people are asked if they have sugar and/or milk in their coffee. 21 people have sugar, 25 people have milk and 7 people have neither.
a) Draw a Venn diagram to represent the information.
Answer:

b) One of the 40 people is randomly selected. Find the probability that the person has sugar but not milk with their coffee.
Answer:

c) Given that a person who has sugar is selected at random, find the probability that the person has milk with their coffee.
Answer:


Unlock more, it's free!
Did this page help you?
