Drawing Graphs & Results Tables (Edexcel IGCSE Biology): Revision Note
Exam code: 4BI1
Choosing a scale & plotting graphs
When drawing the axes for your graph you should:
put the independent variable on the x-axis and the dependent variable on the y-axis
label both axes with the quantity and the unit
choose scales that allow your plotted points to cover more than half of the grid in both directions
use scales that are easy to read, e.g. 1, 2 or 5 units for each large square, or 10, 20 or 50
ensure that scales go up in equal steps all the way along the axes
The axes do not have to start at zero, unless the question asks for this
Edexcel "Plot a line graph" questions have usually been worth 5 marks, with one mark each for:
a linear scale that uses at least half of the grid
straight lines joining all the points
axes the correct way round, with the independent variable on the x-axis
units on both axes
points plotted accurately, to within half a small square
If the table gives repeat readings and a mean, plot only the mean values
A bar chart drawn instead of a line graph loses marks
Plot each point with a small, neat cross (×) or a dot with a circle around it
Plot each point to an accuracy of half a small square
Examiner reports show that students lose marks by:
choosing an unsuitable scale or one that uses too little of the grid
writing the data values along an axis as the scale, so the scale is not linear
leaving out units on the axes
For example, missing "per minute" from a rate
putting the axes the wrong way round
Examiner Tips and Tricks
Before you plot anything, find the largest and smallest values for each axis, and check that your scale covers both. A scale that runs out halfway through your data means starting the graph again.
Joining points & lines of best fit
In some questions you will be expected to join points on a graph
In other questions you will be expected to draw a line of best fit
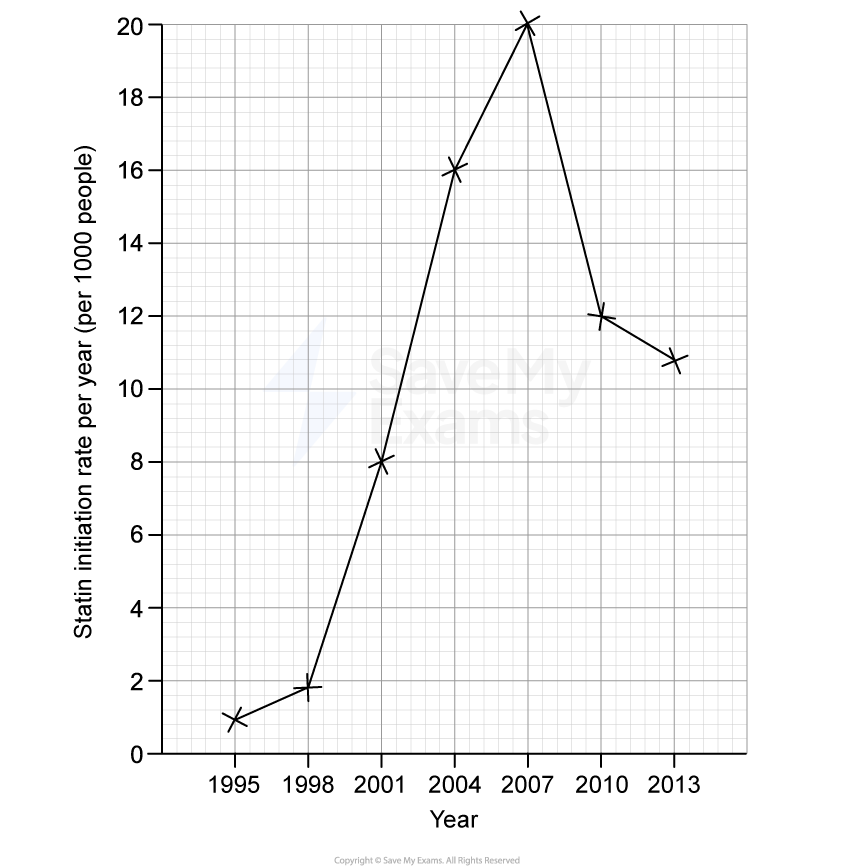
Joining points with straight lines
Edexcel "Plot a line graph" questions usually tell you to join the points with straight lines, often adding "Use a ruler"
The mark scheme gives a mark for straight lines that pass through all of the points
To join the points:
use a ruler and a sharp pencil
join each point to the next point with a straight line
do not draw a line of best fit or a curve
start the line at the first point and stop it at the last point; a line that is extended beyond the data loses the mark
Joining the points is used when the values between your measurements cannot be assumed
For example, yearly figures that rise and then fall
Lines of best fit
Draw a line or curve of best fit when the question asks for one, or when it does not tell you to join the points
A line of best fit shows the trend in your results; it illustrates the general pattern or relationship between your variables
When drawing a line, you should consider:
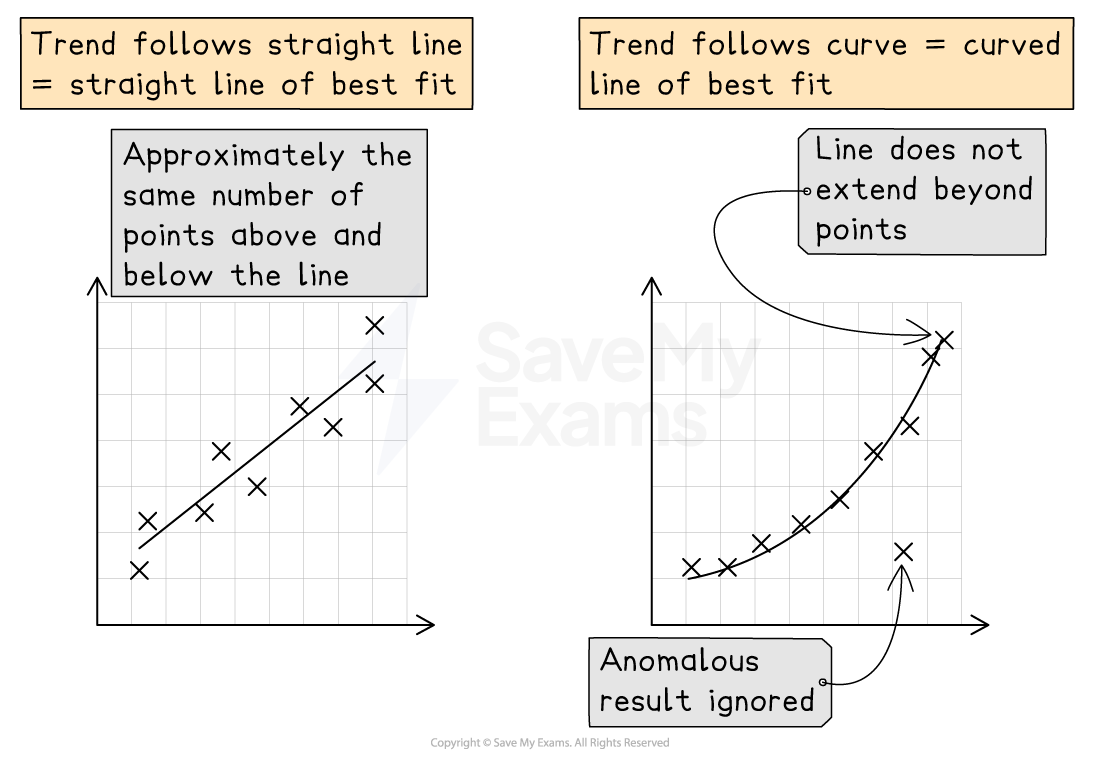
whether the line should be a straight line or a curve
If the points follow a constant linear pattern, plan to draw a straight line
If the rate of change varies or the trend levels off, plan to draw a smooth curve
where the line should start and end
Do not extend the line beyond your data; stop at the first and last plotted data points
Do not force the line through the origin (0, 0): only start at or pass through (0, 0) if this is shown in the data
how the points should be distributed around the line
Aim for a roughly even spread of points on each side of the line, along its whole length
If a data point is anomalous and clearly falls outside the pattern, treat it as an anomalous result and ignore it when positioning your line
Your drawing technique should include the following:
Always draw using a sharp pencil so your line is thin, clear, and precise
Always use a ruler for straight lines
Draw curves in one smooth, continuous movement
Examiner Tips and Tricks
Note that not all graphs will require a line of best fit:
Lines of best fit should be drawn when:
the question explicitly asks for a line of best fit
there is a clear underlying trend, i.e. intermediate values can be reliably predicted
Point-to-point (join the dots) lines should be drawn when intermediate values between measured points cannot be assumed
Bar charts vs histograms
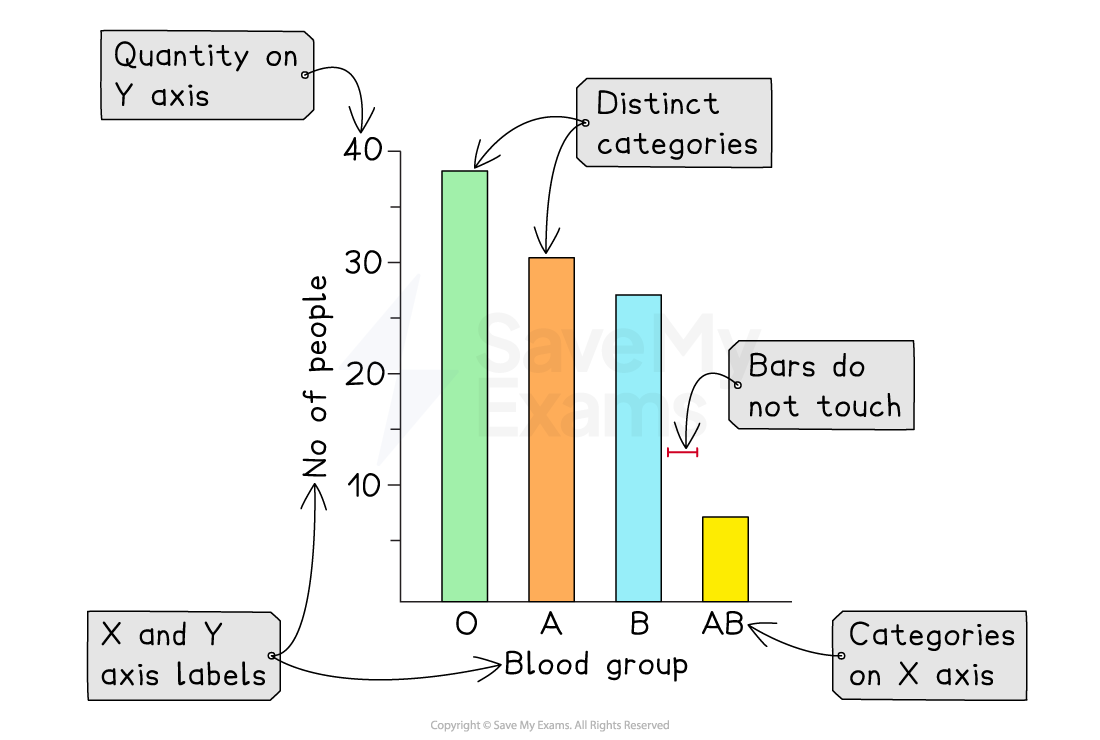
Use a bar chart when the independent variable is in categories, e.g. species or food type
The bars of a bar chart should be of equal width and should not touch
Use a histogram for continuous data that has been put into groups, e.g. leaf lengths of 0–4 cm, 5–9 cm
The bars of a histogram do touch
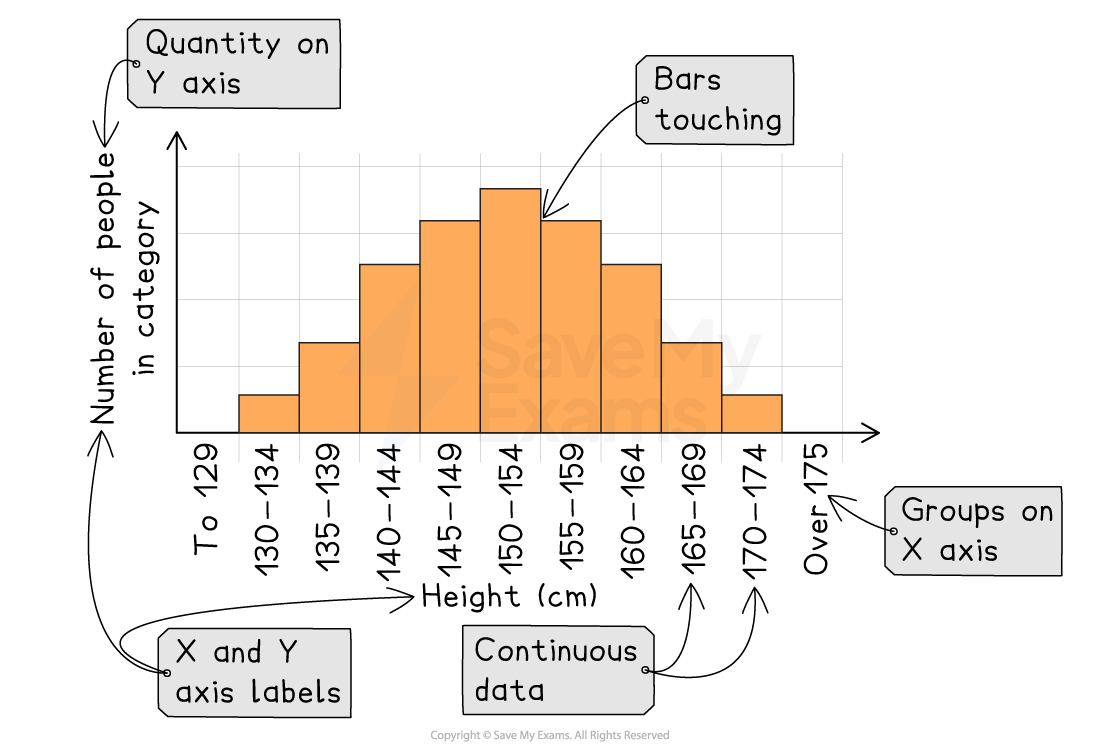
Label the y-axis with the quantity and the unit, and label each bar or group on the x-axis
Draw all lines with a ruler
Examiner Tips and Tricks
When drawing a graph, you should always begin by considering which type of graph is most suitable.
Bar chart: when the independent variable falls into categories
Histogram: when continuous numerical data has been grouped into a series of ranges
Line graph: when both variables are continuous and one variable directly causes a change in another, e.g. temperature and reaction rate
Scattergraph: when both variables are continuous numbers but one variable does not directly cause a change in the other, e.g. body mass and heart rate
Recording results in a table
When designing a table you should put the independent variable in the first column and the dependent variable in the next
Add columns for any repeat readings, and a column for the mean if you need one
Give each column a heading with the quantity and the unit
Put the unit in the heading only, not next to every number in the column
Record all values in a column to the same number of decimal places
Draw one table for all your results, not a separate table for each part of the experiment
Draw the table with a ruler
Avoid:
putting units in the body of the table
For example, writing °C next to every temperature
giving headings that are not a quantity
For example, "bubbles" instead of "number of bubbles"
Worked Example
A student wanted to count the number of bubbles released by pond weed in one minute over a range of temperatures. They planned to begin at 10 °C and investigate at 10 °C intervals up to a temperature of 50 °C.
Design a suitable results table that the student could use.
[2]
Zero-mark answer:
Temperature | Bubbles |
|---|---|
10 °C | |
20 °C | |
30 °C | |
40 °C | |
50 °C |
Full-mark answer:
Temperature in °C | Number of bubbles per minute |
|---|---|
10 | |
20 | |
30 | |
40 | |
50 |
temperature in °C [1 mark]
number of bubbles per minute [1 mark]
Examiner Tips and Tricks
The zero-mark answer has no unit for temperature, and the units have been written in every cell of the column instead (10 °C, 20 °C and so on). Units belong in the heading only, so the cells should contain numbers alone. "Bubbles" names what is being counted but not what is being measured.
The full-mark answer gives each variable a heading that says exactly what is measured, with the unit written once in the heading. The cells contain only numbers.

Unlock more, it's free!
Join the 100,000+ Students that ❤️ Save My Exams
the (exam) results speak for themselves:

Was this revision note helpful?