Calculating Acceleration from Speed-Time Graphs (Cambridge (CIE) O Level Physics): Revision Note
Exam code: 5054

Interpreting Speed-Time graphs
If there is a change in an object's speed, then it is accelerating
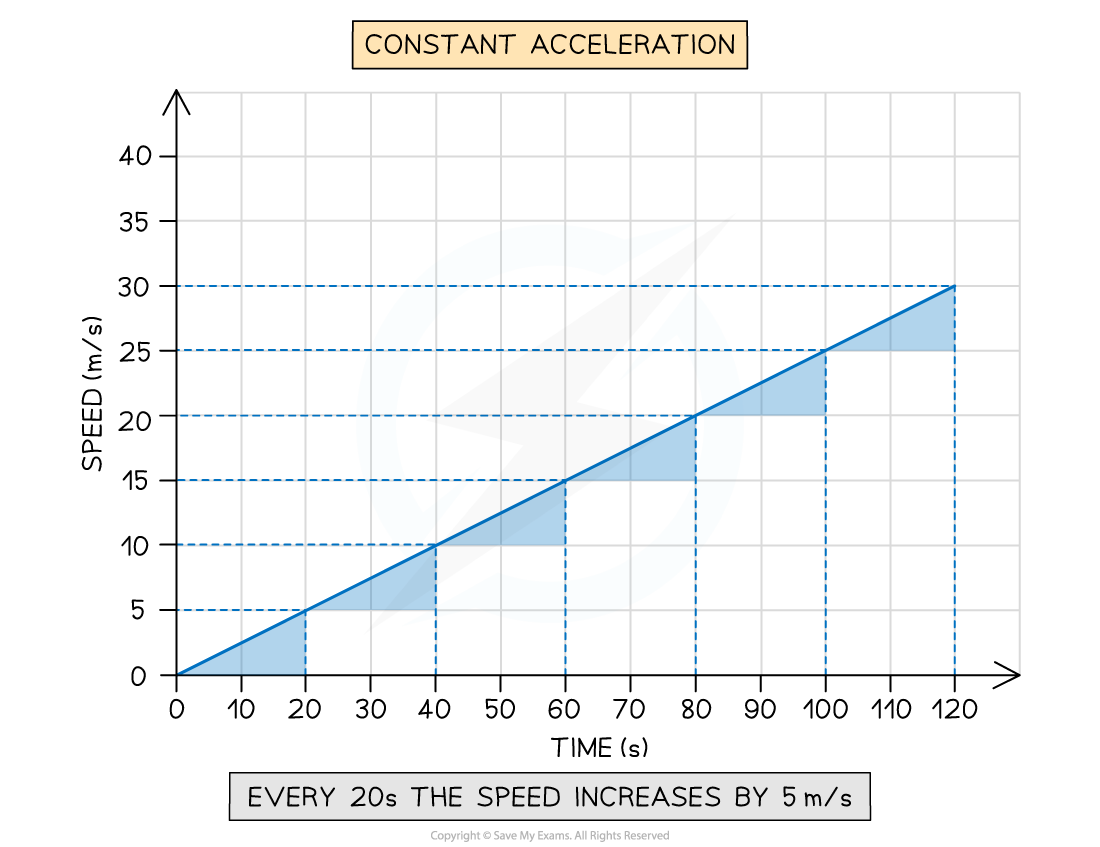
An object may accelerate at a steady rate, this is called constant acceleration
On a speed-time graph this will be a non-horizontal straight line
Constant acceleration
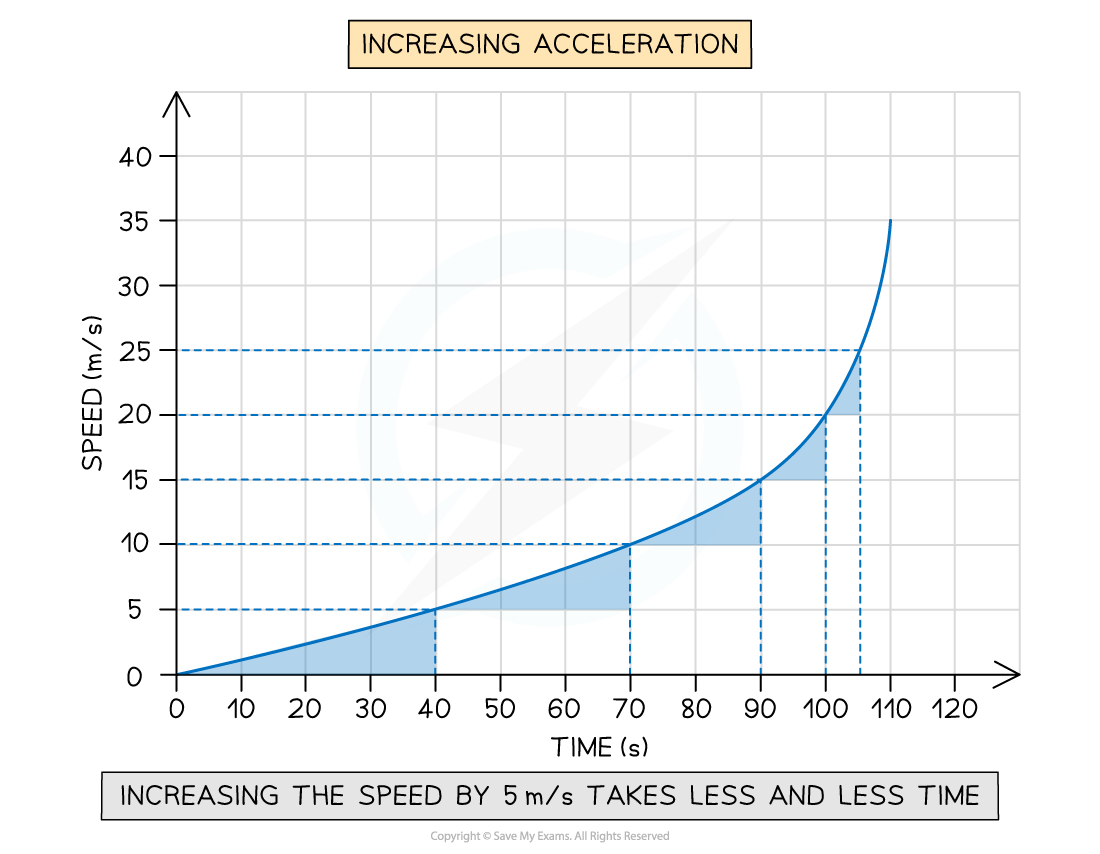
An object may accelerate at an increasing rate
On a speed-time graph this would be an upward curve
Increasing acceleration
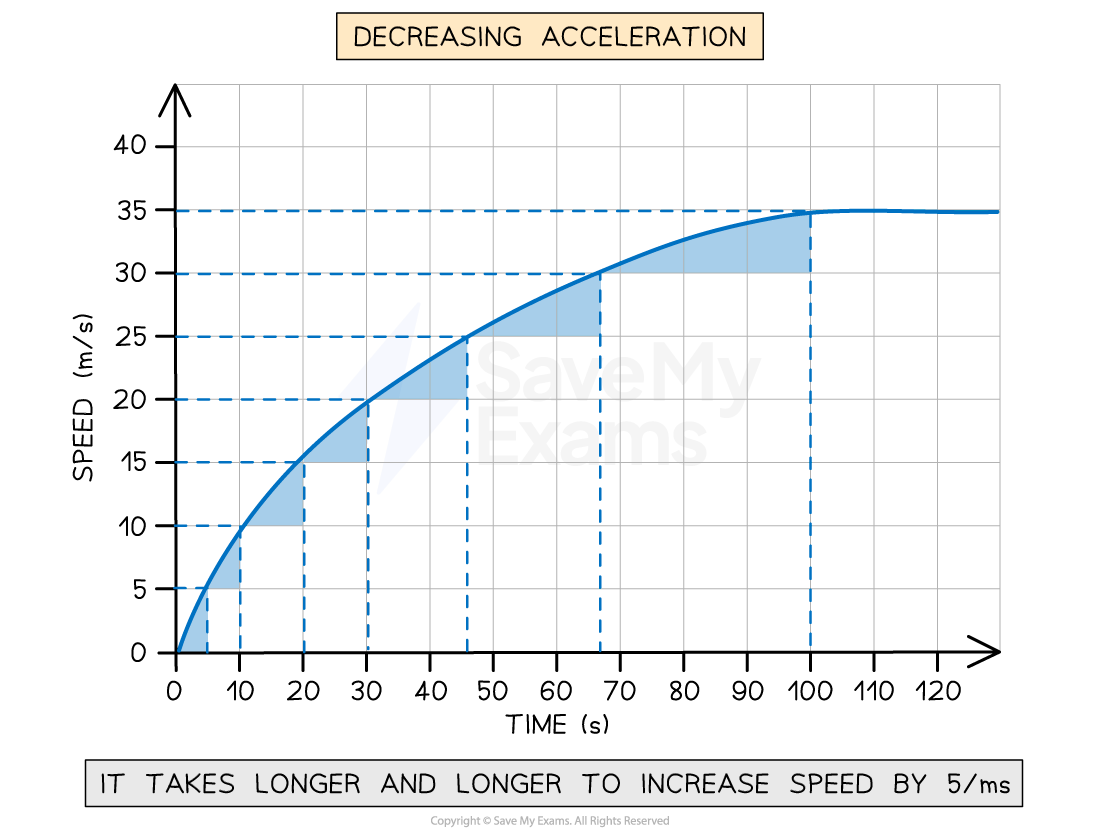
An object may accelerate at a decreasing rate
On a speed-time graph this would be an upward curve with a decreasing gradient
An object is said to decelerate if its speed is decreasing over time, i.e. its acceleration is negative
On a speed-time graph this would be a downward line
If the line is a non-horizontal straight line, deceleration is constant
If the line is a curve with an increasing gradient, deceleration is increasing
If the line is a curve with a decreasing gradient, deceleration is decreasing
Calculating Acceleration
The acceleration of an object can be calculated from the gradient of a speed-time graph
Gradient of a speed-time graph
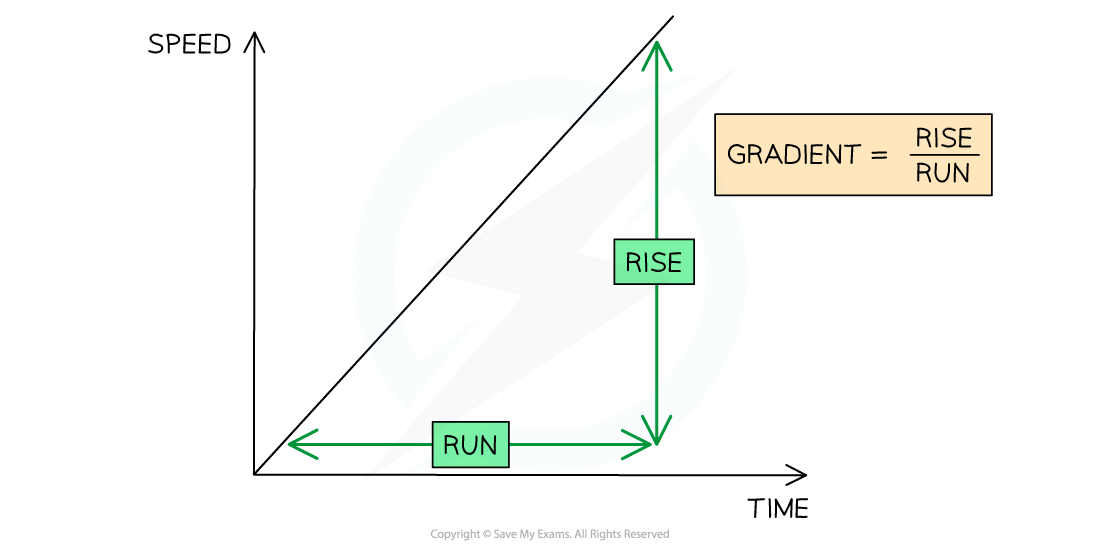
How to find the gradient of a speed-time graph
Worked Example
Tora is training for a cycling tournament.
The speed-time graph below shows her motion as she cycles along a flat, straight road.
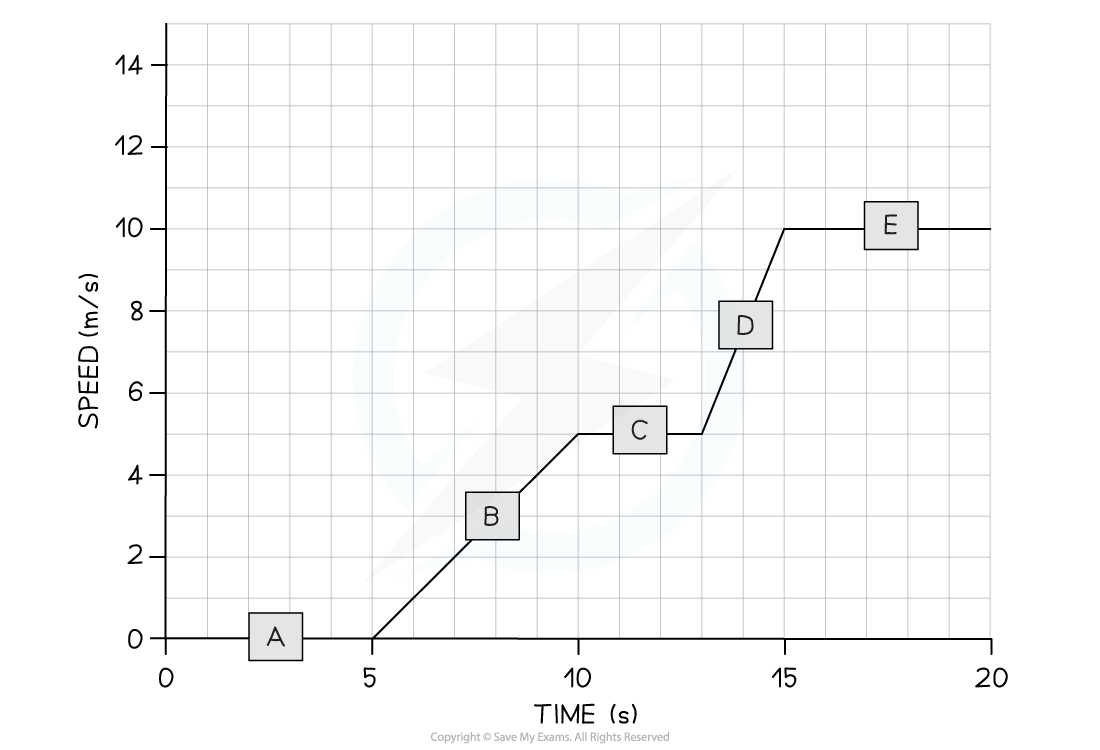
(a) In which section (A, B, C, D, or E) of the speed-time graph is Tora’s acceleration the largest?
(b) Calculate Tora’s acceleration between 5 and 10 seconds.
Part (a)
Step 1: Recall that the slope of a speed-time graph represents the magnitude of acceleration
The slope of a speed-time graph indicates the magnitude of acceleration
Therefore, the only sections of the graph where Tora is accelerating is section B and section D
Sections A, C, and E are flat – in other words, Tora is moving at a constant speed (i.e. not accelerating)
Step 2: Identify the section with the steepest slope
Section D of the graph has the steepest slope
Hence, the largest acceleration is shown in section D
Part (b)
Step 1: Recall that the gradient of a speed-time graph gives the acceleration
Calculating the gradient of a slope on a speed-time graph gives the acceleration for that time period
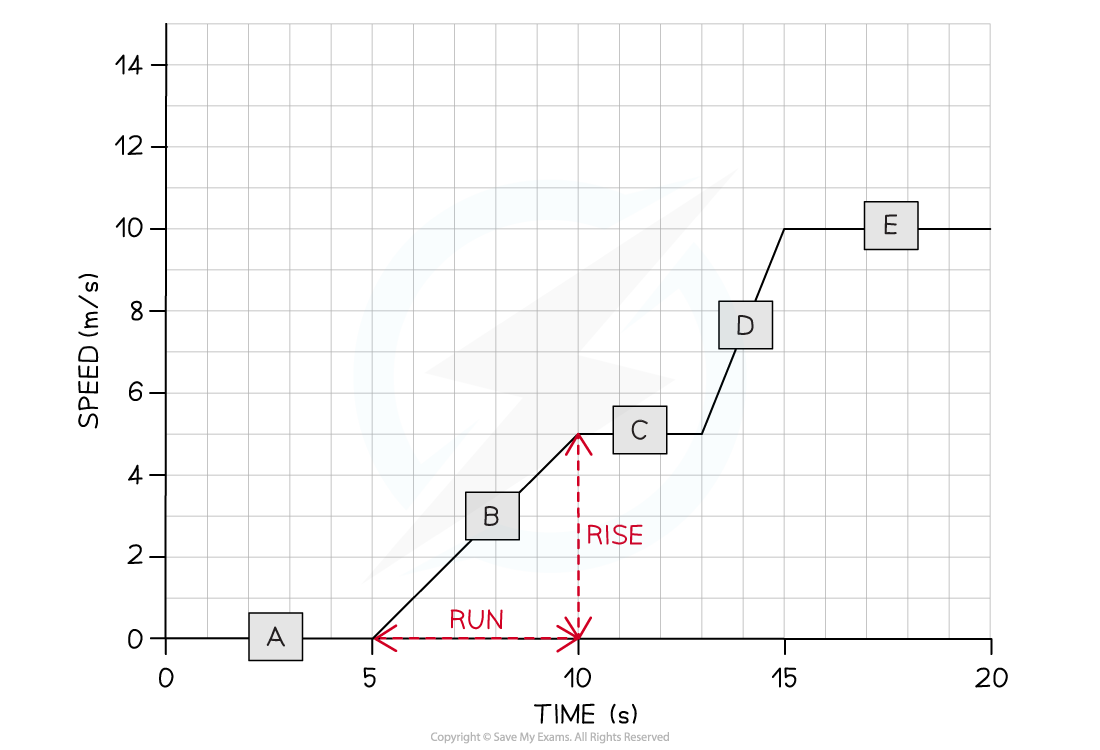
Step 2: Draw a large gradient triangle at the appropriate section of the graph
A gradient triangle is drawn for the time period between 5 and 10 seconds below:
Step 3: Calculate the size of the gradient and state this as the acceleration
The acceleration is given by the gradient, which can be calculated using:
acceleration = gradient = 5 ÷ 5 = 1 m/s2
Therefore, Tora accelerated at 1 m/s2 between 5 and 10 seconds
Examiner Tips and Tricks
Use the entire slope, where possible, to calculate the gradient. Examiners tend to award credit if they see a large gradient triangle used - so remember to draw 'rise' and 'run' lines directly on the graph itself!

Unlock more, it's free!
Join the 100,000+ Students that ❤️ Save My Exams
the (exam) results speak for themselves:

Was this revision note helpful?
Build on this topic