Speed-Time Graphs (Cambridge (CIE) O Level Physics): Revision Note
Exam code: 5054

Speed-Time Graphs
A speed-time graph shows how the speed of a moving object varies with time
The red line represents an object with increasing speed
The green line represents an object with decreasing speed
Increasing and decreasing speed
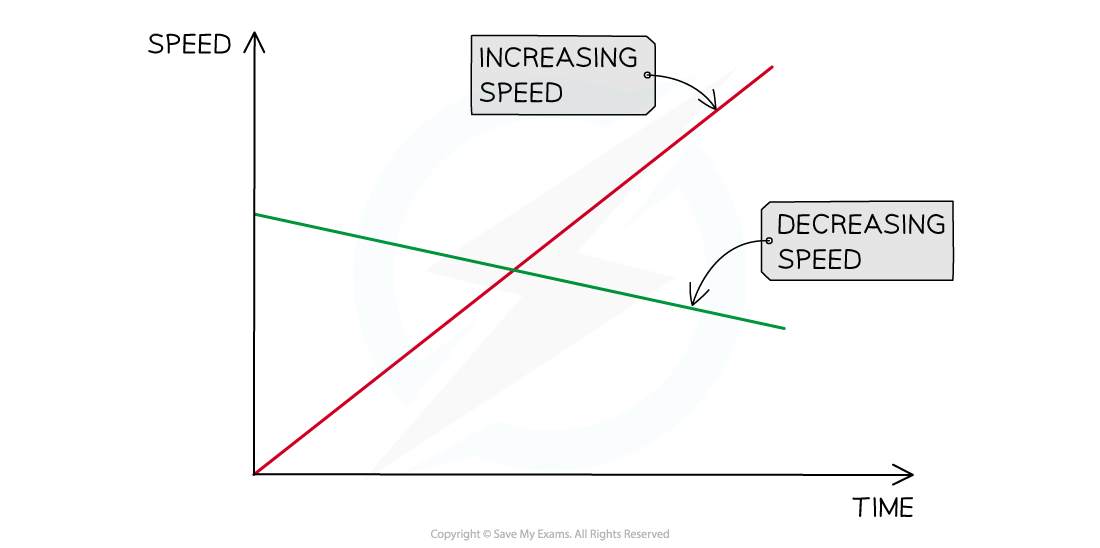
Increasing and decreasing speed represented on a speed-time graph
Acceleration on a Speed-Time Graph
Speed-time graphs also show the following information:
If the object is moving with a constant acceleration or deceleration
The magnitude of the acceleration or deceleration
A straight line represents constant acceleration
The slope of the line represents the magnitude of acceleration
A steep slope means large acceleration (or deceleration) - i.e. the object's speed changes very quickly
A gentle slope means small acceleration (or deceleration) - i.e. the object's speed changes very gradually
A flat line means the acceleration is zero - i.e. the object is moving with a constant speed
Acceleration, deceleration and constant speed

This image shows how to interpret the slope of a speed-time graph
Using Speed-Time Graphs
The distance travelled by an object can be found by determining the area beneath the graph
Area under a velocity-time graph
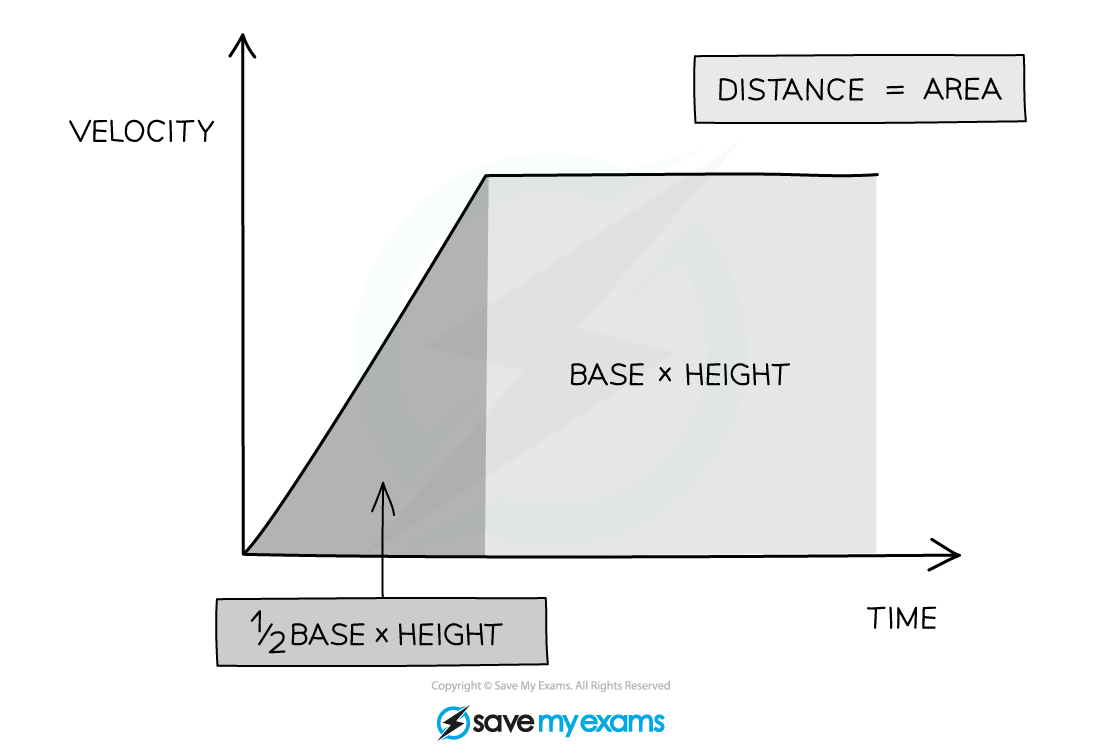
The distance travelled can be found from the area beneath the graph
If the area beneath the graph forms a triangle (the object is accelerating or decelerating) then the area can be determined using the formula:
If the area beneath the graph is a rectangle (constant velocity) then the area can be determined using the formula:
Worked Example
The speed-time graph below shows a car journey which lasts for 160 seconds.
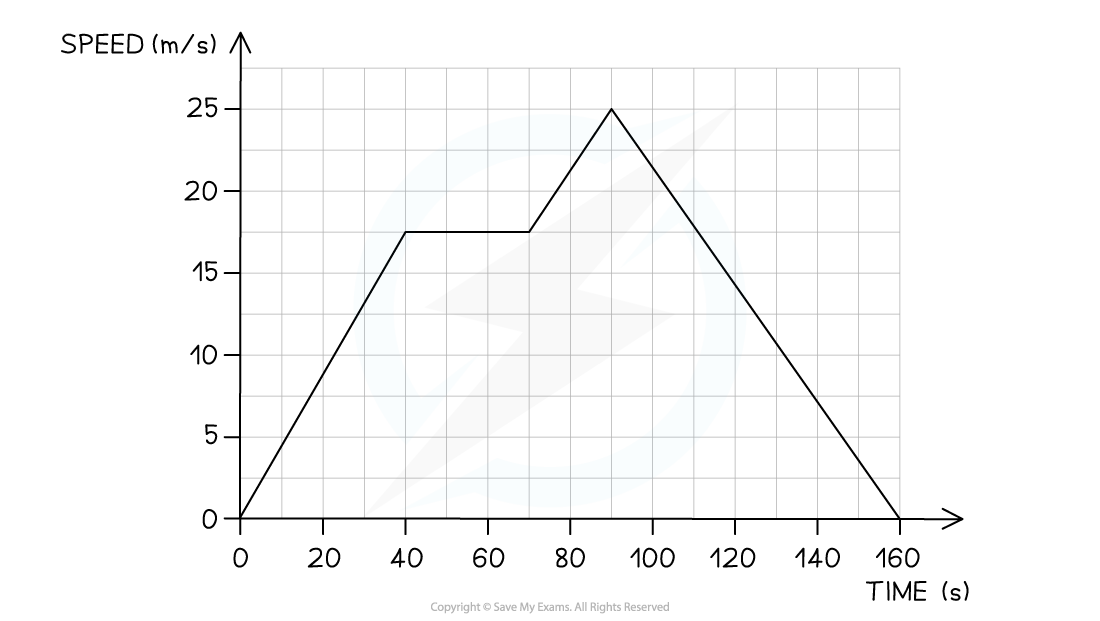
Calculate the total distance travelled by the car on this journey.
Answer:
Step 1: Recall that the area under a velocity-time graph represents the distance travelled
In order to calculate the total distance travelled, the total area underneath the line must be determined
Step 2: Identify each enclosed area
In this example, there are five enclosed areas under the line
These can be labelled as areas 1, 2, 3, 4 and 5, as shown in the image below:
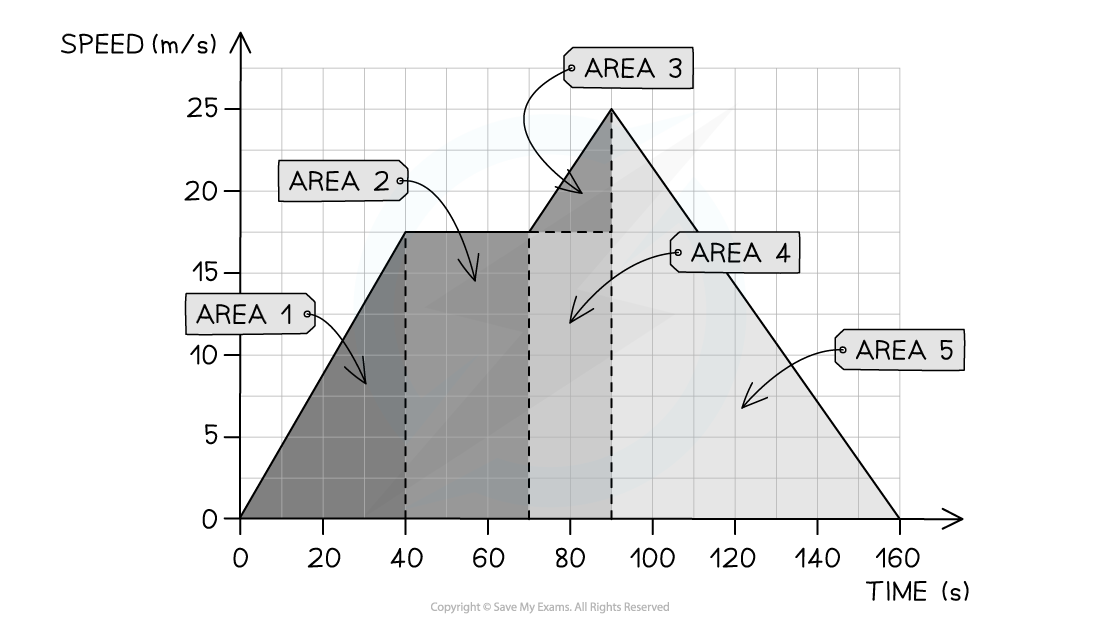
Step 3: Calculate the area of each enclosed shape under the line
Area 1 = area of a triangle = ½ × base × height = ½ × 40 × 17.5 = 350 m
Area 2 = area of a rectangle = base × height = 30 × 17.5 = 525 m
Area 3 = area of a triangle = ½ × base × height = ½ × 20 × 7.5 = 75 m
Area 4 = area of a rectangle = base × height = 20 × 17.5 = 350 m
Area 5 = area of a triangle = ½ × base × height = ½ × 70 × 25 = 875 m
Step 4: Calculate the total distance travelled by finding the total area under the line
Add up each of the five areas enclosed:
total distance = 350 + 525 + 75 + 350 + 875
total distance = 2175 m

Unlock more, it's free!
Join the 100,000+ Students that ❤️ Save My Exams
the (exam) results speak for themselves:

Was this revision note helpful?
Build on this topic