1a2 marks
Show that
1b2 marks
Hence, or otherwise, work out
Was this exam question helpful?
Show that
Hence, or otherwise, work out
Was this exam question helpful?
A function is defined by the equation .
Sketch the graph of in the interval .
Use your sketch from part (a), along with relevant area formulae, to work out the value of the integral
You should not use your GDC to find the value of the integral.
Was this exam question helpful?
Let . The graph of passes through the point .
Find the gradient of the graph of at .
Find the equation of the tangent to the graph of at . Give your answer in the form .
Find .
Was this exam question helpful?
Let . The graph of passes through the point .
Find the gradient of the graph of at .
Find the equation of the tangent to the graph of at . Give your answer in the form .
Find .
Was this exam question helpful?
The following diagram shows an arch that is 4.5 m tall and 3 m wide. The arch meets the -axis at the origin, , and at the point , and its vertex is at the point . The arch can be modelled by the curve with equation , where and are measured in metres.

Find
(i) the coordinates of
(ii) the coordinates of
(iii) the value of .
Find the cross-sectional area under the arch.
Was this exam question helpful?
The shaded region in the diagram below shows the cross-section of a trough, where and are measured in centimetres. The curved bottom of the trough can be modelled by an equation of the form . Point is the origin, and points , , and are the vertices of a rectangle. Point , the lowest point of the trough, lies on the -axis.

Find the value of .
Find the cross-sectional area of the trough.
The trough is 1.2 m long.
Find the volume of the trough. Give your answer in .
Was this exam question helpful?
The following diagram shows part of the graph of . The shaded region is bounded by the -axis, the -axis and the graph of .

Write down an integral for the area of .
Find the area of .
The three points , and are the vertices of a triangle.
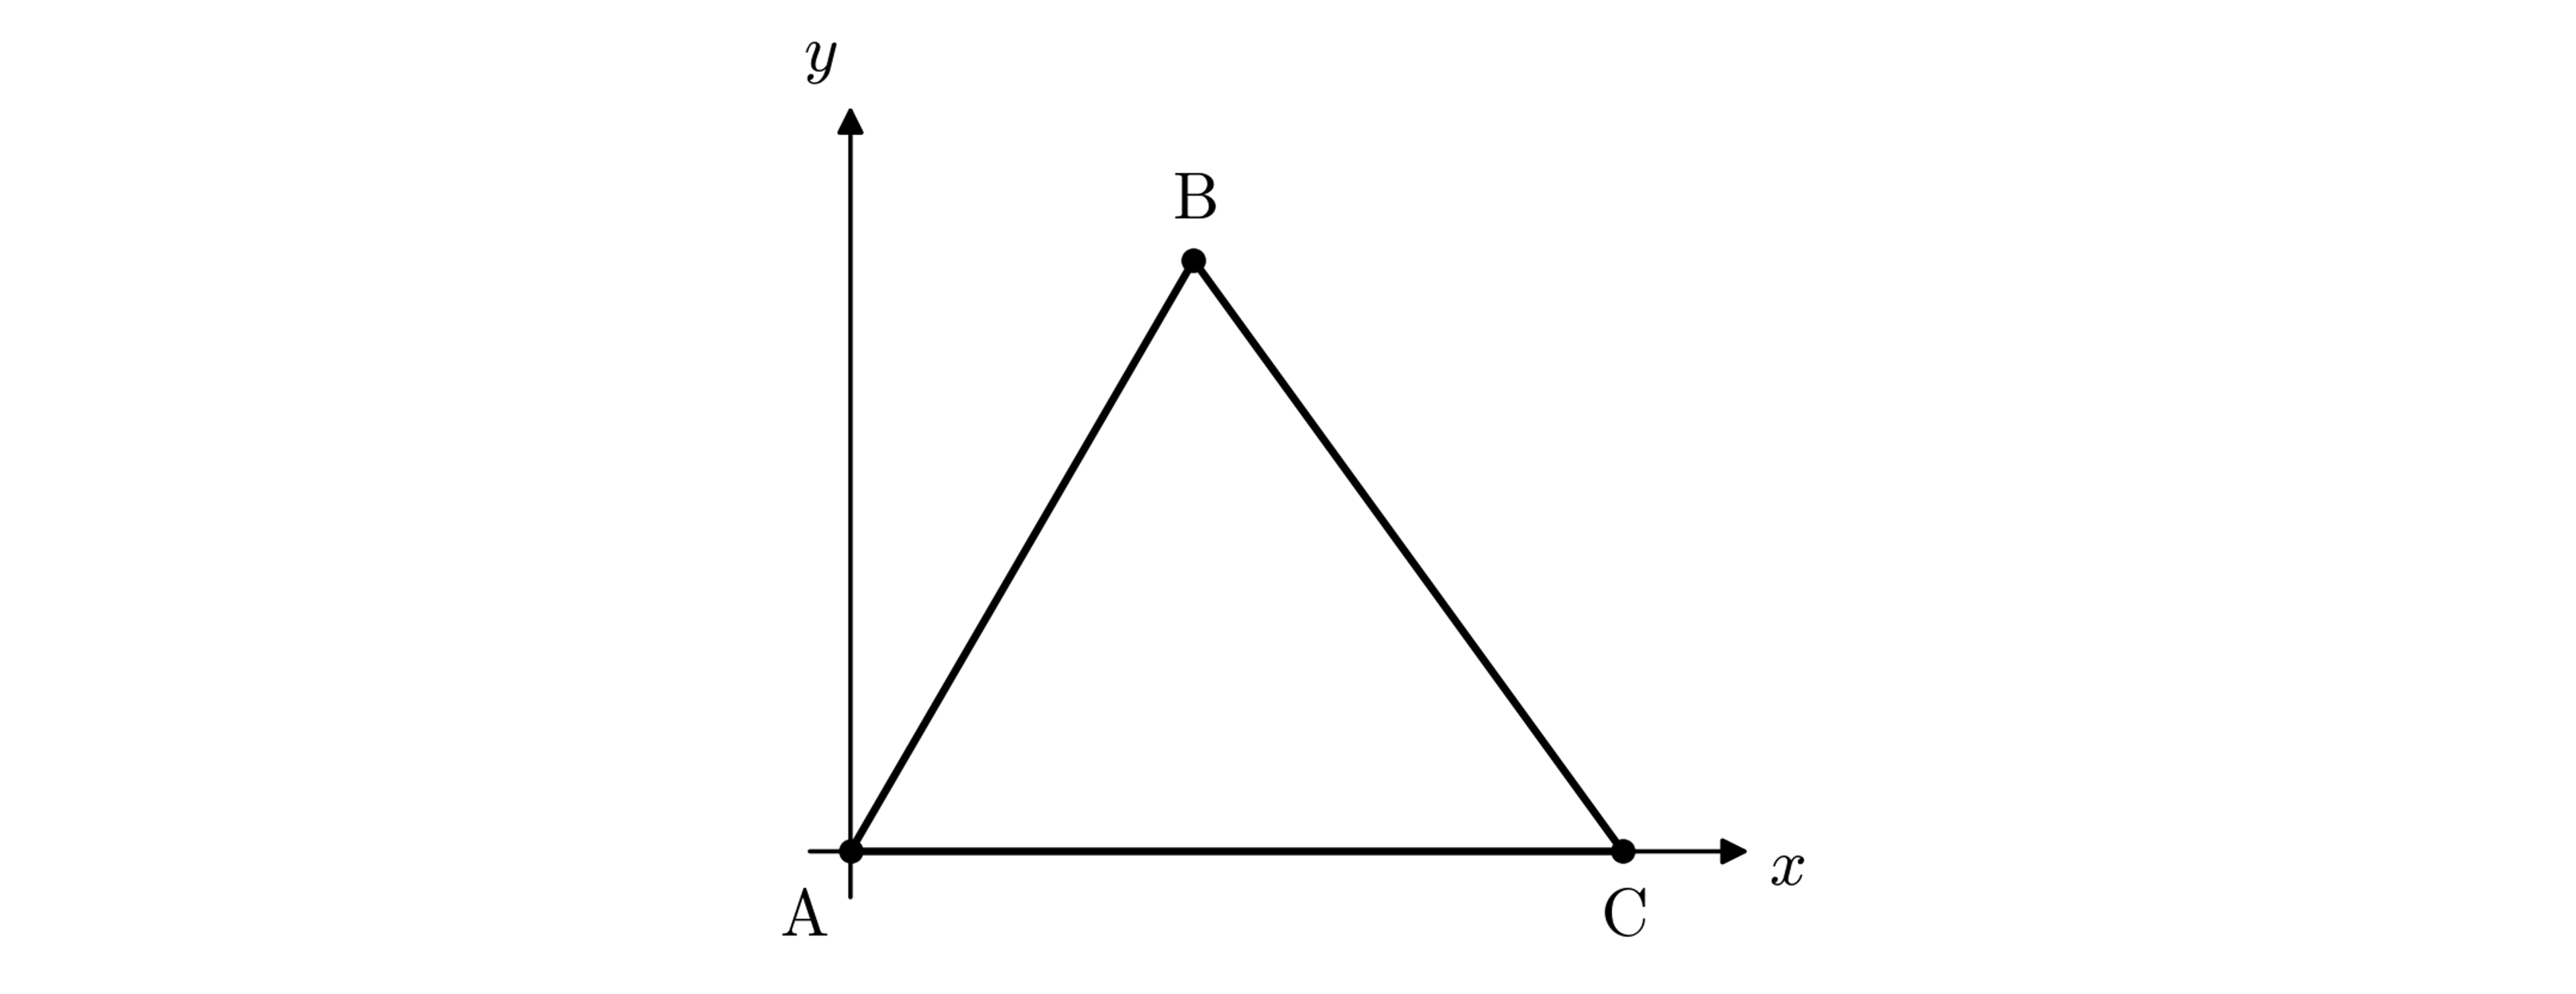
The area of the triangle is equal to the area of .
Find the value of .
Was this exam question helpful?
Let
The graph of passes through the point .
Find .
Was this exam question helpful?
The following diagram shows part of the graph of .

The shaded region is bounded by the graph, the -axis and the line .
(i) Write down an integral for the area of .
(ii) Find the area of . Give your answer as an exact value.
The shaded region is bounded by the graph, the -axis, the -axis and the horizontal line through the point on the graph where .
Find the area of . Give your answer as an exact value.
Was this exam question helpful?
A company is designing a plastic piece for a new game. The piece is to be in the form of a prism, with cross-section the shaded region in the following diagram.

Region is bounded by the positive -axis, the positive -axis and the curve with equation . All lengths are in centimetres.
Find the coordinates of the points where the curve meets the -axis and the -axis.
The volume of the piece is to be 30 .
Find the length of the piece, giving your answer correct to 3 significant figures.
Was this exam question helpful?
For a particle travelling in a straight line, the velocity, m/s, of the particle at time seconds is given by
Sketch the graph of for .
The distance travelled between two times by a particle moving in a straight line may be found by finding the area under its velocity-time graph between those two times.
Find the distance travelled by between and .
Was this exam question helpful?
A function is a piecewise linear function defined by
Sketch the graph of in the interval .
Use your sketch from part (a), along with relevant area formulae, to work out the value of the integral
Was this exam question helpful?
Let , where is a constant. The diagram below shows part of the graph of , with its - and -intercepts labelled.

Find
(i) the value of
(ii)
(iii) the coordinates of .
Find the area of the region enclosed by the graph of and the -axis.
Was this exam question helpful?
Let , where is a constant. The diagram below shows part of the graph of . The graph crosses the -axis at and , and its vertex is at .

Find
(i) the value of
(ii)
(iii) the coordinates of .
Find the area of the region enclosed by the graph of and the -axis.
Was this exam question helpful?
The following diagram shows part of the graph of . The shaded region is bounded by the -axis, the -axis and the graph of .

(i) Write down an integral for the area of .
(ii) Find the area of .
is a parallelogram with vertices , , and , as shown in the diagram below. The area of is equal to the area of .

Find the value of . Hence find the coordinates of . Give your answers as exact values.
Was this exam question helpful?
The shaded region in the following diagram is bounded by the -axis, the line and the curve .

Find the coordinates of
(i) the point of intersection of the curve and the line
(ii) the point of intersection of the line and the -axis
(iii) the point of intersection of the curve and the -axis that is shown in the diagram.
Find the area of .
Was this exam question helpful?
Consider the function .
The graph of has a local maximum point at and a local minimum point at . The -coordinates of and are and respectively.
(i) Find .
(ii) Hence find the values of and , and the coordinates of and .
The point on the graph of has -coordinate , where and .
(i) Find the value of .
(ii) Sketch the graph of , showing the points , and and the points where the graph meets the coordinate axes.
The region is enclosed by the graph of and the line .
Find the area of .
Was this exam question helpful?
Let
The graph of passes through the point .
Find .
Was this exam question helpful?
Celebrity chef Pepper Bee has opened a new restaurant and is charging diners £630 for a piece of his signature ‘Croesus’ cake. The chef claims that the price reflects the high cost of the gold foil that is placed on top of each slice of cake, but a suspicious and disgruntled customer has decided to investigate this claim.
The shaded area in the diagram below shows the shape of the piece of gold foil that is placed on top of each slice of cake:

The shape is that of a rectangle, from which four identical curved sections have been removed. The rectangle is bounded by the positive - and -axes and the lines and . The shape of one of the curved sections in the diagram can be described by the curve with equation
All units are given in centimetres.
Given that gold foil costs per , work out the cost of the gold foil on a piece of Pepper Bee’s Croesus cake. Give your answer to 2 decimal places.
Was this exam question helpful?
A company is designing a piece for one of the plastic wargaming models they produce. The piece is to be in the form of a prism, with a cross-sectional area as indicated by the shaded region in the following diagram:

Region is bounded, as shown, by the positive -axis and the curve with equation . All units are in centimetres.
Given that the model piece will have a volume of 50.3 , find the length of the piece.
Was this exam question helpful?
For a particle travelling in a straight line, the velocity, m/s, of the particle at time seconds is given by the equation
At time the particle reaches its maximum velocity, while at time the particle comes momentarily to rest.
Find the values of and , justifying your answers in each case.
The distance travelled between two times by a particle moving in a straight line may be found by finding the area beneath the particle’s velocity-time graph between those two times.
Find
(i) the total distance travelled by the particle between times and
(ii) the percentage of that total distance that is covered between times and .
Was this exam question helpful?
The following diagram shows part of the graph of . The shaded region is bounded by the -axis, the -axis and the graph of .

Find the area of region .
A trapezoid is shown below.

is perpendicular to and parallel to , and . The coordinates of the points , and are , and respectively, where is a constant.
Given that has the same area as the region above, find the value of , the -coordinate of point .
Was this exam question helpful?