11 mark
Brogan needs to draw the graph of
Here is her graph.

Write down one thing that is wrong with Brogan's graph.
Was this exam question helpful?
Exam code: 4MA1
Brogan needs to draw the graph of
Here is her graph.
Write down one thing that is wrong with Brogan's graph.
Was this exam question helpful?
Complete the table of values for
|
|
|
|
On the grid, draw the graph of from

Was this exam question helpful?
Complete the table of values for
|
|
|
On the grid, draw the graph of for values of from

Was this exam question helpful?
Complete the table of values for
|
|
|

On the grid, draw the graph of
Was this exam question helpful?
Complete the table of values for
|
|
|
|
On the grid, draw the graph of for

Was this exam question helpful?
The graph of is drawn on the grid.

Write down the coordinates of the turning point of the graph.
Write down the roots of
Write down the value of
Was this exam question helpful?
The graph of is drawn on the grid.

Write down the coordinates of the turning point of the graph.
Write down estimates for the roots of
Use the graph to find an estimate for
Was this exam question helpful?
Complete the table of values for
0.25 | 0.5 | 1 | 2 | 4 | 8 | |
16.25 |
|
|
|
| 8.5 |
On the grid, draw the graph of for

Was this exam question helpful?
Here are six graphs.

Complete the table below with the letter of the graph that could represent each given equation. Write your answers on the dotted lines.
Equation | Graph |
.................... | |
.................... | |
.................... |
Was this exam question helpful?
The diagram shows part of a sketch of the curve

Write down the coordinates of
(i) the point P
[1]
(ii) the point Q
[1]
Sketch the graph of for
Show the coordinates of any points of intersection with the coordinate axes.

Was this exam question helpful?
Complete the table of values for
0.5 | 1 | 2 | 3 | 4 | 5 | 6 | |
| 6 |
| 2 |
|
| 1 |
On the grid, draw the graph of for

Was this exam question helpful?
Circle the point that is on the graph of
(–1, 1) | (0.3, 3) | (0.8, 0.2) | (2.5, 0.4) |
Was this exam question helpful?
The equation of a curve is
Circle the coordinates of the turning point.
(–1, –6) | (1, 6) | (–1, 6) | (1, –6) |
Was this exam question helpful?
The graph of y = x3 − x2 − 2 is drawn on the grid.

Use the graph to solve x3 − x2 − 2 = 0.
Give your answer correct to 1 decimal place.
x = ...................................................
Was this exam question helpful?
Here is the graph of y = x2 + x − 6.

Use the graph to solve the equation x2 + x − 6 = 0.
x = ................. or x = ................
Was this exam question helpful?
(i) Sketch a graph on the axes that shows that y is directly proportional to x.

[2]
(ii) Sketch a graph on the axes that shows

[2]
Was this exam question helpful?
Complete the table of values for
|
|
|
|
|
On the grid, draw the graph of for values of from

Use your graph to find estimates of the solutions to the equation
Was this exam question helpful?
Sketch the graph of

Was this exam question helpful?
The diagram shows part of a sketch of the curve

Write down the coordinates of the point .
Write down the coordinates of the point .
Was this exam question helpful?
Complete the table of values for
|
|
|
|
On the grid, draw the graph of for values of from

Find estimates for the solutions of the equation
Was this exam question helpful?
Complete the table of values for
|
|
|
On the grid, draw the graph of for values of from

By drawing a suitable straight line on the grid, find estimates for the solutions of
Was this exam question helpful?
Complete the table of values for
| 2 |
|
On the grid, draw the graph of

By drawing a suitable straight line on the grid, find estimates for the solutions of the equation
Was this exam question helpful?
Part of the graph of is shown on the grid.

Use the graph to find estimates for the solutions of the equation
Give your solutions correct to one decimal place.
By drawing a suitable straight line on the grid, find estimates for the solutions of the equation
Show your working clearly.
Give your solutions correct to one decimal place.
Was this exam question helpful?
The diagram shows the graph of for

Note: Point P in the graph is from the previous question. It is not required for this question.
The equation has exactly two different solutions for
Use the graph to find the two possible values of .
Was this exam question helpful?
Write in the form
The line is the line of symmetry of the curve with equation
Using your answer to part (a) or otherwise, write down an equation of .
Was this exam question helpful?
Circle the point that lies on the curve
(–1, 4) | (–1, –4) | (–1, –2) | (–1, 6) |
Was this exam question helpful?
Here is a sketch of for values of from 0° to 360°

is an acute angle.
Circle the value of
Circle the value of
Was this exam question helpful?
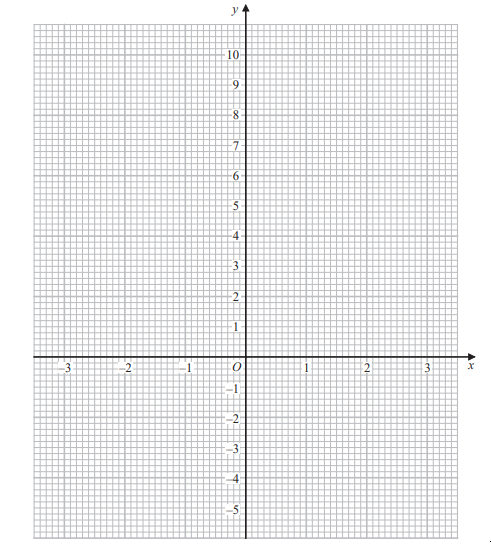
Complete the table of values for
-3 | -2 | -1 | 0 | 1 | 2 | 3 | |
2 | -4 |
On the grid below, draw the graph of for values of from –3 to 3
Was this exam question helpful?
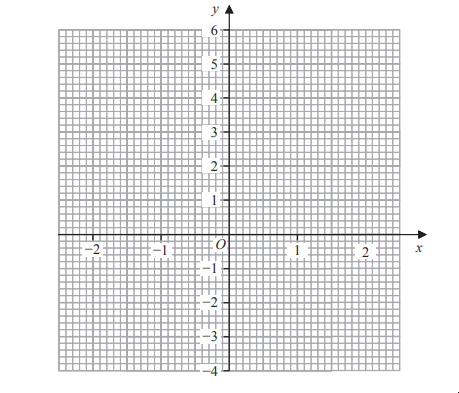
Complete the table of values for
-2 | -1 | 0 | 1 | 2 | |
-1 |
On the grid, draw the graph of for values of from − 2 to 2
Here are four graphs.
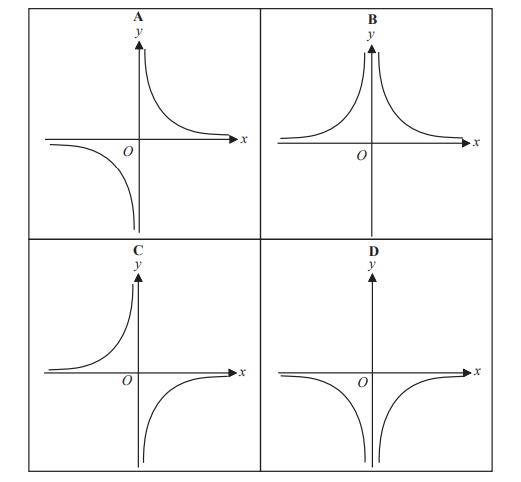
Write down the letter of the graph that could have the equation
Was this exam question helpful?
Complete the table of values for
|
|
|
|
On the grid, draw the graph of for values of from

Solve
Was this exam question helpful?
Complete the table of values for
|
|
|
|
On the grid, draw the graph of for values of from

Solve
Was this exam question helpful?
The diagram shows the graph of

Use the graph to find estimates for the solutions of
i)
[1]
ii)
[2]
Use the graph to find estimates for the values of that satisfy the simultaneous equations
Was this exam question helpful?
Complete the table of values for
-2 | -1 | -0.5 | 0 | 1 | 1.5 | 2 | 3 | |
|
| 4.875 | 4 |
| -1.625 |
|
|
On the grid, draw the graph of for values of from –2 to 3

By drawing a suitable straight line on the grid, find estimates for the solutions of the equation
Give your solutions correct to 1 decimal place.
Was this exam question helpful?
The curve has equation where
Using the axes below, sketch the curve . On your sketch show clearly, in terms of ,
(i) the coordinates of any points of intersection of with the coordinate axes,
(ii) the coordinates of the turning point.

Was this exam question helpful?
Express in the form where andare integers.
is the curve with equation
The point is the maximum point on
Use your answer to part (a) to write down the coordinates of
Was this exam question helpful?
Complete the table of values for
–2 | |||||||
|
|
|
|
On the grid, draw the graph of

By drawing a suitable straight line on the grid, find an estimate for the solution of the equation
............................................
Was this exam question helpful?
The curve has equation
The point is the maximum point on .
Write down the coordinates of .
Was this exam question helpful?
The curve has equation
Using the axes below, sketch the curve . On your sketch show clearly
(i) the exact coordinates of any points of intersection of with the coordinate axes,
(ii) the coordinates of the turning point.

Was this exam question helpful?
The curve has equation where
The point is the maximum point on .
Write down the coordinates of .
The curve is transformed to the curve by a translation of Find an equation for the curve .
The curve is transformed to the curve .
The curve has equation
Describe fully the transformation that maps curve onto curve .
Was this exam question helpful?
Write in the form .
Sketch the graph of , showing clearly the coordinates of any turning points.

Was this exam question helpful?
Write in the form .
Sketch the graph of .
Show clearly the coordinates of any turning points and the value of the -intercept.

Was this exam question helpful?
The graph of is drawn below.

Use the graph to solve .
The equation 2x2 + x − 4 = 0 can be solved by finding the intersection of the graph of y = 2x2 + 3x − 9 and the line y = ax + b.
(i) Find the value of a and the value of b.
(ii) Hence use the graph to solve the equation 2x2 + x − 4 = 0.
x = ............................ or x = ............................[3]
Was this exam question helpful?
Sketch the graph of . Show the coordinates of any turning points.

The sketch shows part of a graph which has equation .

Find the values of and .
Was this exam question helpful?
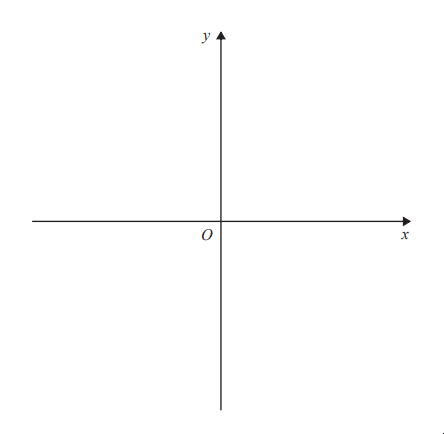
The curve has equation
Using the axes below, sketch the curve .
On your sketch show clearly
(i) the exact coordinates of any points of intersection of with the coordinate axes,
(ii) the coordinates of the turning point.
Was this exam question helpful?
The diagram shows part of a sketch of the curve
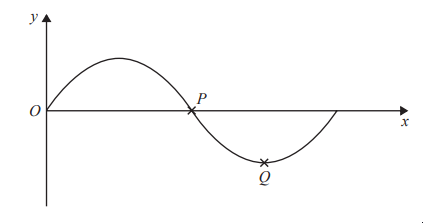
Write down the coordinates of
(i) the point
(ii) the point
Sketch the graph of for
Show the coordinates of any points of intersection with the coordinate axes.
Was this exam question helpful?
Here are 6 graphs
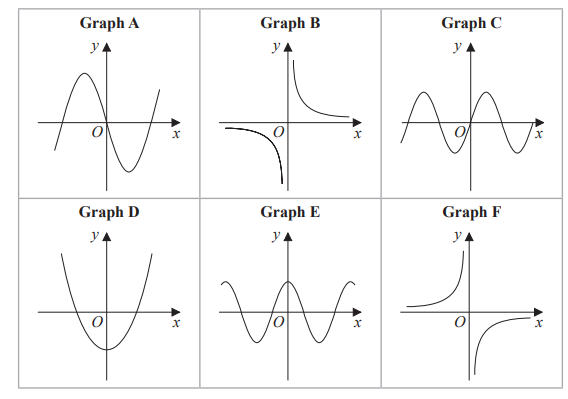
Complete the table below with the letter of the graph that could represent each given equation.
Write your answers on the dotted lines.
Equation | Graph |
|---|---|
............ | |
............ | |
........... |
Was this exam question helpful?