Infrared Spectroscopy (Cambridge (CIE) AS Chemistry): Exam Questions

Exam code: 9701

1 hour16 questions
1a
Sme Calculator
2 marks

There are three possible isomers, A, B and C, with the molecular formula C3H8O.

Isomers A and B are positional isomers of each other.

Isomer C is a functional group isomer of A and B.

The percentage by mass of carbon in all three isomers is 60.0%.

Calculate the percentage by mass of hydrogen and oxygen in all three isomers.

1b
2 marks

The infrared spectrum of isomer C shown in Fig. 1.1 does not have an absorption in the region of 3200–3600 cm-1.

Infrared spectrum of isomer C (methoxyethane) showing no O−H absorption and an absorption at around 1130 cm⁻¹

Fig. 1.1

i) Using the infrared spectrum in Fig. 1.1 and Table 1.1, deduce the fully displayed formula of isomer C.

Table 1.1

Bond 

Functional groups containing
the bond

Characteristic infrared absorption range (in wavenumber) / cm–1

C−O 

 hydroxy, ester 

1040 – 1300

C=C 

 aromatic compound, alkene 

1500 – 1680

C=O 

 amide
 carbonyl, carboxyl
 ester

1640 – 1690
1670 – 1740
1710 – 1750

C≡N 

 nitrile 

2200 – 2250

C−H 

 alkane 

2850 – 2950

N−H  

 amine, amide

3300 – 3500

O−H 

 carboxyl
 hydroxy

2500 – 3000
3200 – 3600

[1]

ii) Identify the bond responsible for the absorption at around 1130 cm-1.

[1]

1c
2 marks

Isomers A and B both have an absorption at 3200–3600 cm-1 in their infrared spectra.

State the systematic names of isomers A and B.

1d
Sme Calculator
2 marks

Isomer A has a major peak at m/e = 31 in its mass spectrum.

Deduce which isomer is compound A. Explain your reasoning by identifying the fragment ion responsible for the peak at m/e = 31.

2a
2 marks

Some alcohols with the molecular formula C5H12O were oxidised using acidified potassium dichromate(VI). The organic products were separated and purified.

The infrared spectra of two of these organic products are shown in Fig. 2.1.

Infrared spectra of compounds Y and Z showing carbonyl and carboxyl absorptions

Fig. 2.1

Using the data in Table 2.1, identify the functional group present in each compound. Explain your answer, referring only to absorptions at frequencies greater than 1500 cm-1.

Table 2.1

Bond 

Functional groups containing
the bond

Characteristic infrared absorption range (in wavenumber) / cm–1

C−O 

 hydroxy, ester 

1040 – 1300

C=C 

 aromatic compound, alkene 

1500 – 1680

C=O 

 amide
 carbonyl, carboxyl
 ester

1640 – 1690
1670 – 1740
1710 – 1750

C≡N 

 nitrile 

2200 – 2250

C−H 

 alkane 

2850 – 2950

N−H  

 amine, amide

3300 – 3500

O−H 

 carboxyl
 hydroxy

2500 – 3000
3200 – 3600

2b
1 mark

The infrared spectrum of an organic compound containing carbon, hydrogen and oxygen is shown in Fig. 2.2.

Infrared spectrum of an organic compound showing a carbonyl absorption at around 1720 cm⁻¹

Fig. 2.2

Use Table 2.1 and the infrared spectrum in Fig. 2.2 to explain how the presence of a carbonyl group can be identified.

2c
3 marks

In an experiment to prepare a sample of ethanal, CH3CHO, ethanol, C2H5OH, is reacted with acidified potassium dichromate(VI) and the reaction mixture is distilled. The infrared spectra for ethanol and ethanal are shown in Fig. 2.3.

Infrared spectrum of ethanol showing broad O−H absorption at 3400 cm⁻¹
Infrared spectrum of ethanal showing C=O absorption at 1720 cm⁻¹

Fig. 2.3

i) Identify the bond responsible for the absorption at 3400 cm-1 in the ethanol spectrum and the bond responsible for the absorption at 1720 cm-1 in the ethanal spectrum.

[2]

ii) Explain why the absorption at 3400 cm-1 in the ethanol spectrum does not appear in the spectrum for ethanal.

[1]

1a
Sme Calculator
2 marks

Compounds X, Y and Z are structural isomers, as shown below.

Displayed formulae of three C4H8O structural isomers: X (butan-2-one), Y (2-methylpropanal), Z (but-3-en-2-ol)

Explain why determining the exact mass using mass spectrometry would not help in distinguishing between X, Y and Z.

1b
2 marks

Compounds X, Y and Z were analysed using IR spectroscopy. The spectrum of one of the compounds is shown in Fig 1.1.

Infrared spectrum of compound Z (but-3-en-2-ol) showing O−H absorption at 3200–3600 cm⁻¹ and C=C absorption at 1620–1680 cm⁻¹

Fig 1.1

Use Table 1.1 and Fig. 1.1 to deduce the identity of the compound whose spectrum is shown. Explain your answer by identifying the bonds responsible for the relevant absorptions.

Table 1.1

Bond 

Functional groups containing
the bond

Characteristic infrared absorption range (in wavenumber) / cm–1

C−O 

 hydroxy, ester 

1040 – 1300

C=C 

 aromatic compound, alkene 

1500 – 1680

C=O 

 amide
 carbonyl, carboxyl
 ester

1640 – 1690
1670 – 1740
1710 – 1750

C≡N 

 nitrile 

2200 – 2250

C−H 

 alkane 

2850 – 2950

N−H  

 amine, amide

3300 – 3500

O−H 

 carboxyl
 hydroxy

2500 – 3000
3200 – 3600

1c
2 marks

Explain why infrared spectroscopy alone could not be used to distinguish between compounds X and Y.

1d
Sme Calculator
2 marks

Mass spectrometry can be used to distinguish between compounds X and Y.

Deduce the m/e value and formula of a fragment ion present in the mass spectrum of compound Y but absent from that of compound X.

2a
1 mark

The isomers A and B, C5H10O, both form an orange precipitate when reacted with 2,4-DNPH.

A is unbranched and reacts with alkaline I2 (aq) to produce a yellow precipitate.

B does not react with alkaline I2 (aq). It contains a chiral centre and produces a silver mirror when warmed with Tollens' reagent.

Draw the structure of the yellow precipitate produced by the reaction between A and alkaline I2 (aq).

2b
3 marks

i) Give the structural formula of A and of B.

A ..........................................................................................................

B ..........................................................................................................

[2]

ii) Explain the meaning of the term chiral centre. 

[1]

2c
2 marks

C and D are isomers with the molecular formula C3H6O2. The infra-red spectra of isomers C and D are shown in Fig. 2.1 and Fig. 2.2.

Infrared spectrum of propanoic acid (compound C) showing broad O−H absorption at 2500–3000 cm⁻¹ and C=O absorption at around 1715 cm⁻¹

Fig. 2.1

Infrared spectrum of methyl ethanoate (compound D) showing C=O absorption at around 1740 cm⁻¹ and C−H absorption at 2850–2950 cm⁻¹

Fig. 2.2

Table 2.1

Bond 

Functional groups containing
the bond

Characteristic infrared absorption range (in wavenumber) / cm–1

C−O 

 hydroxy, ester 

1040 – 1300

C=C 

 aromatic compound, alkene 

1500 – 1680

C=O 

 amide
 carbonyl, carboxyl
 ester

1640 – 1690
1670 – 1740
1710 – 1750

C≡N 

 nitrile 

2200 – 2250

C−H 

 alkane 

2850 – 2950

N−H  

 amine, amide

3300 – 3500

O−H 

 carboxyl
 hydroxy

2500 – 3000
3200 – 3600

Using Table 2.1, identify the bonds responsible for the principal absorptions above 1500 cm-1 in each spectrum.

spectrum of C ........................................................................

spectrum of D ........................................................................

2d
2 marks

Draw the displayed formulae of possible structures for isomers C and D.

2e
3 marks

Deduce the formulae of the fragment ions responsible for the peaks at m/e = 73, 45 and 29 in the mass spectrum of compound C.

3a
2 marks

Explain how infrared spectroscopy can provide information about the bonds present in an organic molecule.

3b
2 marks

Infra-red spectroscopy is used to distinguish between a primary alcohol and an aldehyde. 

Table 3.1

Bond 

Functional groups containing
the bond

Characteristic infrared absorption range (in wavenumber) / cm–1

C−O 

 hydroxy, ester 

1040 – 1300

C=C 

 aromatic compound, alkene 

1500 – 1680

C=O 

 amide
 carbonyl, carboxyl
 ester

1640 – 1690
1670 – 1740
1710 – 1750

C≡N 

 nitrile 

2200 – 2250

C−H 

 alkane 

2850 – 2950

N−H  

 amine, amide

3300 – 3500

O−H 

 carboxyl
 hydroxy

2500 – 3000
3200 – 3600

 Use Table 3.1 to explain how the spectra produced could distinguish between these two molecules.

3c
1 mark

The alcohol from part (b) is fully oxidised by refluxing with acidified potassium dichromate solution.

Use Table 3.1 to explain how infra-red spectroscopy could prove that the reaction has taken place. 

1a
2 marks

Alcohol A can be prepared by hydrolysing the halogenoalkane C2H5CHBrCH3 with aqueous sodium hydroxide. The melting and boiling point information of alcohol A and C2H5CHBrCH3 are given in Table 1.1.

Table 1.1

melting point / K

boiling point / K

alcohol A

158

373

C2H5CHBrCH3

161

364

Construct an equation for the hydrolysis of C2H5CHBrCH3 with aqueous sodium hydroxide. Include state symbols in your answer.

1b
3 marks

Using the information in Table 1.1, explain how alcohol A can be separated from the products identified in part (a).

1c
2 marks

Describe two chemical tests and their expected observations to confirm the identity of the inorganic product of the reaction in part (a). Use one test for each ion.

1d
3 marks

The infra-red spectrum of C2H5CHBrCH3 is shown in Fig. 1.1 with the C–Br bond absorption labelled.

Infrared spectrum of 2-bromobutane with the C−Br absorption labelled at 500–800 cm⁻¹

Fig. 1.1

Use Table 1.2 to identify three differences between the infrared spectrum of C2H5CHBrCH3 and that of alcohol A. In your answer, identify the bonds responsible for the relevant absorptions.

Table 1.2

Bond 

Functional groups containing
the bond

Characteristic infrared absorption range (in wavenumber) / cm–1

C−O 

 hydroxy, ester 

1040 – 1300

C=C 

 aromatic compound, alkene 

1500 – 1680

C=O 

 amide
 carbonyl, carboxyl
 ester

1640 – 1690
1670 – 1740
1710 – 1750

C≡N 

 nitrile 

2200 – 2250

C−H 

 alkane 

2850 – 2950

N−H  

 amine, amide

3300 – 3500

O−H 

 carboxyl
 hydroxy

2500 – 3000
3200 – 3600

1e
1 mark

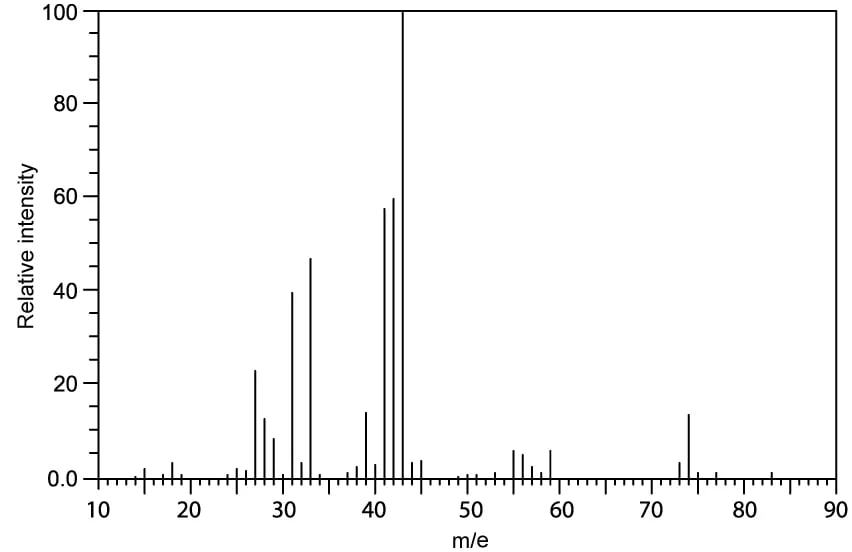
The mass spectrum of (CH3)2CHCH2OH is shown in Fig. 1.2.

Mass spectrum of 2-methylpropan-1-ol showing base peak at m/e = 43

Fig. 1.2

Deduce the formula of the fragment ion responsible for the peak with the greatest relative abundance.

2a
3 marks

Unknown organic compound C is analysed by mass spectrometry and infra-red spectroscopy. The mass spectrum is shown in Fig. 2.1 and the infra-red spectrum is shown in Fig. 2.2.

Mass spectrum of compound C showing the molecular ion peak at m/e = 55

Fig 2.1

Infrared spectrum of compound C showing a C≡N absorption at around 2250 cm⁻¹

Fig 2.2

Deduce one possible identity for compound C. Explain your answer.

In your answer, use the molecular ion peak at m / e = 55, relevant infra-red absorptions in the region above 1500 cm-1 and Table 2.1.

Table 2.1

Bond 

Functional groups containing
the bond

Characteristic infrared absorption range (in wavenumber) / cm–1

C−O 

 hydroxy, ester 

1040 – 1300

C=C 

 aromatic compound, alkene 

1500 – 1680

C=O 

 amide
 carbonyl, carboxyl
 ester

1640 – 1690
1670 – 1740
1710 – 1750

C≡N 

 nitrile 

2200 – 2250

C−H 

 alkane 

2850 – 2950

N−H  

 amine, amide

3300 – 3500

O−H 

 carboxyl
 hydroxy

2500 – 3000
3200 – 3600

2b
1 mark

The mass spectrum of compound C shows an M+1 peak at m / e = 56.

Identify the isotope responsible for the M+1 peak.

2c
Sme Calculator
2 marks

Calculate the percentage by mass of each element in compound C.

Give your answers to 3 significant figures.

2d
2 marks

Compound C undergoes a reaction to form compound D. The IR spectrum of compound D is shown in Fig. 2.3.

Infrared spectrum of compound D (propylamine) showing N−H absorption at 3300–3500 cm⁻¹

Fig. 2.3

State the reagents and conditions required for this reaction. In your answer, use Table 2.1 and identify any relevant absorptions in the infra-red spectrum to justify your answer.