Effect of Temperature on Reaction Rates & the Concept of Activation Energy (Cambridge (CIE) AS Chemistry): Exam Questions

Exam code: 9701

1 hour20 questions
1a
2 marks

A reversible reaction is shown.

A + B ⇌ C + D

The reaction pathway diagram for this reaction is shown in Fig. 1.1.

Reaction pathway diagram for A + B ⇌ C + D, with products C + D at a higher energy level than reactants A + B; activation energy Ea and enthalpy change ΔH are labelled

Fig. 1.1

Use Fig. 1.1 to deduce whether the forward reaction is exothermic or endothermic. Explain your answer.

1b
2 marks

Define the term activation energy, Ea.

1c
Sme Calculator
2 marks

Use Fig. 1.1 to determine the activation energy for the forward reaction and for the reverse reaction.

activation energy of the forward reaction = .............................. kJ mol-1

activation energy of the reverse reaction = .............................. kJ mol-1

1d
3 marks

Fig. 1.2 shows the reaction pathway diagram for the same reaction in the presence of a catalyst.
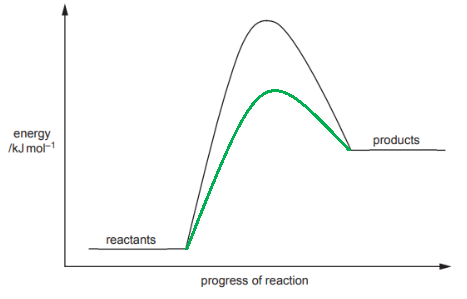
Reaction pathway diagram showing the original reaction profile and a second catalysed reaction pathway with a lower activation energy peak, both curves sharing the same reactant and product energy levels

Fig. 1.2

Use Fig. 1.2 to explain how the addition of a catalyst increases the rate of reaction.

2a
2 marks

This question is about Boltzmann distribution curves.

The Boltzmann distribution curve of molecular energies for a general reaction at a given temperature is shown in Fig. 2.1.

Boltzmann distribution curve showing number of molecules on the y-axis and energy on the x-axis, with the activation energy Ea marked as a vertical dashed line

Fig. 2.1

State what will happen to the curve when the temperature of the reaction is decreased.

2b
1 mark

State how, if at all, the total area under a Boltzmann distribution curve changes with temperature.

2c
1 mark

State the effect of adding a catalyst on the activation energy, Ea, of the reaction.

2d
1 mark

The Boltzmann distribution of energies for a gas is shown in Fig. 2.2.

Boltzmann distribution curve with a shaded region to the left of the activation energy Ea, representing molecules with energy less than or equal to Ea

Fig. 2.2

State what the shaded area of Fig. 2.2 represents.

1a
3 marks

Fig. 1.1 below shows, for a given temperature T, a Boltzmann distribution of the kinetic energy of the molecules of a mixture of two gases that will react together.

The activation energy for the reaction, Ea, is marked.

Boltzmann distribution curve at temperature T with number of molecules on the y-axis and energy on the x-axis; the activation energy Ea is marked as a vertical dashed line

Fig. 1.1

On Fig. 1.1 above,

i) Sketch a new distribution curve, clearly labelled T2, for the same mixture of gases at a lower temperature, T2.

[2]

ii) State the effect of a decrease in temperature on the activation energy, Ea.

[1]

1b
2 marks

Define the term activation energy, Ea.

1c
3 marks

i) On Fig. 1.1, draw and label the activation energy for the reaction in the presence of a catalyst, Ea,cat.

[1]

ii) Use the Boltzmann distribution to explain how the addition of a catalyst results in reactions occurring at a faster rate.

[2]

1d
3 marks

Two reactions involving aqueous sodium hydroxide, NaOH (aq), are given below.

CH3CHBrCH3 + NaOH → CH3CH(OH)CH3 + NaBr Reaction 1

H2SO4 + 2NaOH → Na2SO4 + 2H2O Reaction 2

The reagents in Reaction 1 must be heated together for some time for the reaction to occur. Reaction 2 is almost instantaneous at room temperature.

Suggest why these reactions occur at different rates.

2a
3 marks

Ammonia can be produced by the reaction of nitrogen and hydrogen in the presence of an iron catalyst.

N2 (g) + 3H2 (g) ⇌ 2NH3 (g) ΔH = −92 kJ mol-1

The activation energy for the forward catalysed reaction, Ea,cat, is +109 kJ mol-1.

Complete the reaction pathway diagram in Fig. 2.1 for the uncatalysed and the catalysed reaction between nitrogen and hydrogen.

You should label the following:

  • products

  • the enthalpy change of reaction, ΔH

  • the activation energy of the forward uncatalysed reaction, Ea

  • the activation energy of the forward catalysed reaction, Ea,cat

Incomplete reaction pathway diagram showing energy on the y-axis and reaction coordinate on the x-axis, with the reactants N2 and 3H2 marked at the starting energy level; two unlabelled curve peaks are shown for the uncatalysed and catalysed pathways

Fig. 2.1

2b
Sme Calculator
2 marks

Calculate the activation energy of the catalysed decomposition of ammonia into nitrogen and hydrogen. Show your working.

activation energy = ......................................................... kJ mol-1

2c
3 marks

Catalysts, such as iron used in the production of ammonia, increase the rate of reaction.

Use the Boltzmann distribution to explain how an iron catalyst increases the rate of this reaction.

2d
3 marks

Platinum is used as a catalyst in catalytic converters, which are fitted to vehicle exhaust systems to remove nitrogen oxide from the exhaust gases.

2NO (g) + 2CO (g) → N2 (g) + 2CO2 (g)

i) State whether platinum acts as a homogeneous or heterogeneous catalyst in a catalytic converter.

[1]

ii) Deduce whether nitrogen is oxidised or reduced in this reaction. Explain your reasoning with reference to relevant oxidation numbers.

[2]

3a
3 marks

In any chemical reaction, the particles will all be moving in different directions, at different speeds and with different amounts of energy. Boltzmann distributions show the distribution of energy amongst particles in a chemical reaction.

Fig. 3.1 below shows the Boltzmann distribution in a sample of a gas at a fixed temperature, T1.

Boltzmann distribution curve at temperature T1 with unlabelled x and y axes

Fig. 3.1

i) Label the x and y axes of the graph.

[1]

ii) Sketch a distribution for a sample of the same gas at a higher temperature, T2.

[2]

3b
2 marks

State why a Boltzmann distribution curve always starts at the origin, and what the area under the curve represents.

3c
6 marks

Some changes were made individually to the reaction in part (a).

Consider the Boltzmann distribution from Fig. 3.1. For each of the changes in parts (i), (ii) and (iii) below, state and explain the effect that the change would have on:

  • The area under the curve

  • The value at which the peak of the curve occurs (the most probable energy of the molecules)

  • The proportion of molecules with energy greater than or equal to Ea

i) The temperature of the original reaction is increased, but no other changes are made.

[2]

ii) The number of molecules in the original reaction mixture is increased, but no other changes are made.

[2]

iii) A catalyst is added to the original reaction mixture, but no other changes are made.

[2]

1a
4 marks

A Boltzmann distribution curve is shown below in Fig 1.1

Boltzmann distribution curve showing number of molecules against energy, with activation energy Ea marked

Fig 1.1

For the changes detailed in parts (i) and (ii), state and explain the effect the change would have on:

  • The area under the curve

  • The value of the most probable energy of the molecules

  • The proportion of molecules with energy greater than or equal to Ea

i) The temperature of the original reaction is increased, but no other changes are made.

[2]

ii) A catalyst is added to the original reaction mixture, but no other changes are made.

[2]

1b
4 marks

The Boltzmann distribution curves for a gas mixture at three different temperatures, 100 K, 300 K and 700 K, are shown in Fig 1.2.

Boltzmann distribution curves for a gas mixture at three different temperatures

Fig 1.2

i) Label each curve in Fig 1.2 with the correct temperature values, 100 K, 300 K and 700 K.

[1]

ii) A student states that 'All reacting molecules have higher kinetic energy at 700 K than they do at 300 K'.

State whether you agree with the student. Use the Boltzmann distribution to explain your answer.

[3]

1c
5 marks

Hydrogen reacts with chlorine to form the hydrogen halide, hydrogen chloride, a colourless gas.

H2 (g) + Cl2 (g) → 2HCl (g)

i) Give one reason why most collisions between hydrogen and chlorine molecules do not lead to the formation of hydrogen chloride.

[1]

ii) Apart from changing the temperature, state and explain two ways of speeding up the formation of hydrogen chloride.

[4]