1
1 mark
Which factor affects the activation energy of a reaction?
the addition of a catalyst
a change in the concentration of the reactants
a change in pressure
a change in temperature
Was this exam question helpful?
Exam code: 9701
Which factor affects the activation energy of a reaction?
the addition of a catalyst
a change in the concentration of the reactants
a change in pressure
a change in temperature
Was this exam question helpful?
The Maxwell-Boltzmann energy distribution curve below describes a mixture of two gases at a given temperature.

Of the two activation energy (Ea) values shown, one is for a catalysed reaction, the other for an uncatalysed one.
Which row gives the catalysed and uncatalysed reactions and their relative numbers of effective collisions?
Ea1 | Ea2 | |||
|---|---|---|---|---|
reaction | effective collisions | reaction | effective collisions | |
A | uncatalysed | fewer | catalysed | more |
B | catalysed | fewer | uncatalysed | more |
C | uncatalysed | more | catalysed | fewer |
D | catalysed | more | uncatalysed | fewer |
Was this exam question helpful?
The diagram represents the reaction pathway for the following reaction:
Z (g) + Y (g) → X (g) + W (g)

Which row gives the properties of the reverse reaction, W (g) + X (g) → Y (g) + Z (g)?
Activation energy | ΔH | |
|---|---|---|
A | smaller | negative |
B | smaller | positive |
C | larger | negative |
D | larger | positive |
Was this exam question helpful?
The distribution of molecular energies in a sample of a gas at a given temperature is shown by the Boltzmann distribution graph.

The temperature is increased. Which statement describes the new position of X?
Fewer molecules possess the most probable energy value so X will shift to the right.
Fewer molecules possess the most probable energy value so X will shift to the left.
More molecules possess the most probable energy value so X will shift to the left.
More molecules possess the most probable energy value so X will shift to the right.
Was this exam question helpful?
The diagram shows a reaction pathway for an endothermic reaction.
Which arrow represents the activation energy for the forward reaction?

Was this exam question helpful?
The dotted-line curve on each graph below represents the corresponding distribution for a gas at 300 K.
Which solid-line curve represents the distribution of molecular energies in the same mass of gas at 500 K?


Was this exam question helpful?
The energies of the reactants, the products and the transition state of a reaction are shown in the reaction pathway diagram.

Which expression represents the activation energy of the forward reaction?
E1 - E2
E2 - E1
E2 - E3
E3 - E2
Was this exam question helpful?
The diagram represents, for a given temperature, the Boltzmann distribution of the kinetic energy of the molecules in a mixture of two gases that react slowly together without a catalyst.
The activation energy for the reaction, Ea, is marked for the uncatalysed reaction.

Which position represents the activation energy for the catalysed reaction?
Was this exam question helpful?
Four gas-phase reactions with the same general equation are measured at the same temperature:
X (g) + Y (g) ⇌ Z (g)
Which reaction pathway diagram shows the reaction that would proceed most rapidly and with the highest equilibrium yield?


Was this exam question helpful?
The diagram shows a Boltzmann distribution of molecular energies for a gaseous mixture. The distribution has a peak, labelled Q on the diagram.

Which row gives the changes when a catalyst is added to the mixture?
Height of peak at Q | Position of Ea | |
|---|---|---|
A | remains the same | moves to the left |
B | decreases | moves to the left |
C | remains the same | moves to the right |
D | decreases | moves to the right |
Was this exam question helpful?
A graph shows the Boltzmann distribution of molecular energies at temperature T1 for a sample of gas. A vertical line represents the activation energy, Ea. A second curve is added for the same sample at a higher temperature, T2.
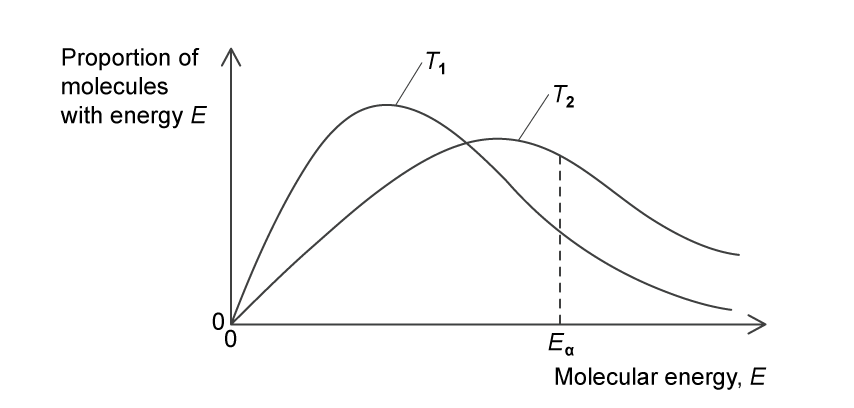
Which statement describes the T2 curve compared to T1?
The area under the curve increases and the peak shifts to the right.
The activation energy decreases and the peak shifts to the right.
The peak shifts to the right and becomes lower.
The activation energy decreases and the area under the curve increases.
Was this exam question helpful?
The following diagrams show Boltzmann distributions.

In diagram 1, one line, P or Q, corresponds to the activation energy in the presence of a catalyst and the other line corresponds to the activation energy of the same reaction in the absence of a catalyst.
In diagram 2, one curve, X or Y, corresponds to a higher temperature of the same sample of gas.
Which row identifies the presence of a catalyst and the higher temperature?
Presence of catalyst | Higher temperature | |
|---|---|---|
A | P | X |
B | P | Y |
C | Q | X |
D | Q | Y |
Was this exam question helpful?
1 dm3 of gas X and 1 dm3 of gas Y are kept at the same temperature and pressure.
The speed of the molecules is plotted against the fraction of molecules with that speed.

Which statement is correct?
The molar mass of X is larger than the molar mass of Y
The molar mass of Y is larger than the molar mass of X
The average kinetic energy of X is higher than that of Y
The average kinetic energy of Y is higher than that of X
Was this exam question helpful?
The diagram shows a Boltzmann distribution of molecular energies with three regions, H, J and K, labelled.

The temperature is decreased. Which row describes what happens to the size of the areas labelled H, J and K?
H | J | K | |
|---|---|---|---|
A | Decreases | Decreases | Increases |
B | Decreases | Increases | Decreases |
C | Increases | Decreases | Decreases |
D | Increases | Decreases | Increases |
Was this exam question helpful?