Explaining Rates Using Collision Theory (Cambridge (CIE) O Level Chemistry): Revision Note
Exam code: 5070

Explaining Rates Using Collision Theory
Rates of reaction factors
There are several factors that can affect the rate of a reaction. These are:
Concentration of the reactants in solution or the pressure of reacting gases
Temperature at which the reaction is carried out
Surface area of solid reactants
The use of a catalyst
Changes in these factors directly influence the rate of a reaction
It is of economic interest to have a higher rate of reaction as this implies a higher rate of production and hence a more efficient and sustainable process
The effect of temperature
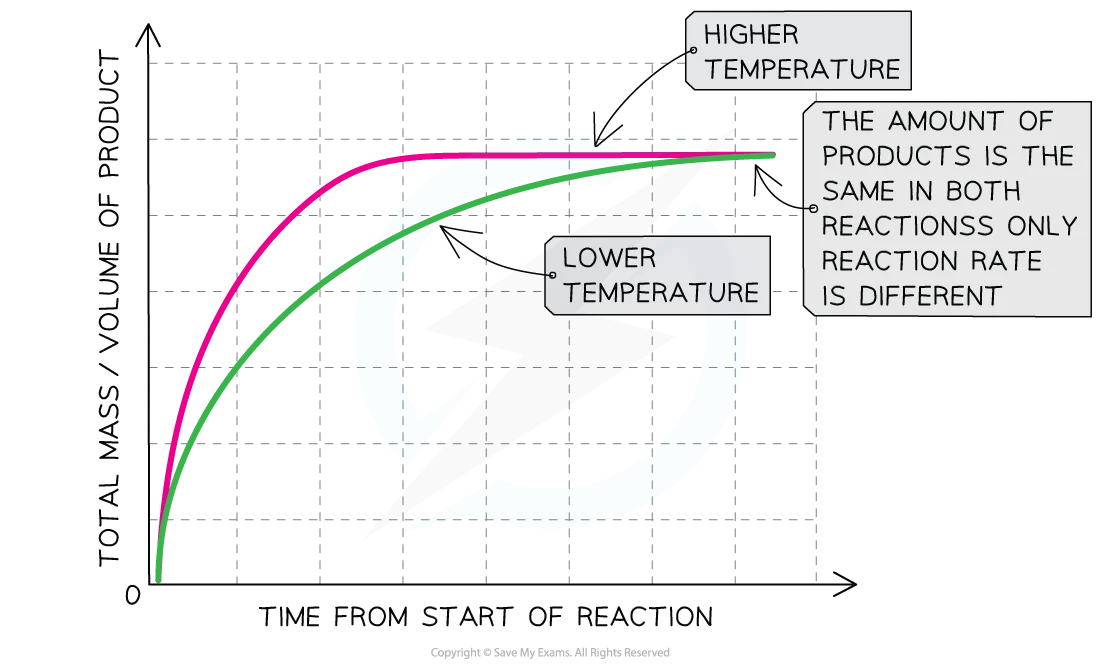
Increasing the temperature increases the rate of reaction but not the final amount of product
Compared to a reaction at a low temperature, the graph line for the same reaction but at a higher temperature has a steeper gradient at the start and becomes horizontal sooner
This shows that with increased temperature, the rate of reaction will increase
Explanation:
This is because the particles have more kinetic energy, so they move faster
Therefore there will be more frequent collisions and a higher proportion of particles have energy greater than the activation energy
This causes more successful collisions per second, increasing the rate of reaction
The effect of temperature on collisions is not so straightforward as concentration or surface area; a small increase in temperature causes a large increase in rate
For aqueous and gaseous systems, a rough rule of thumb is that for every 10 oC increase in temperature, the rate of reaction approximately doubles
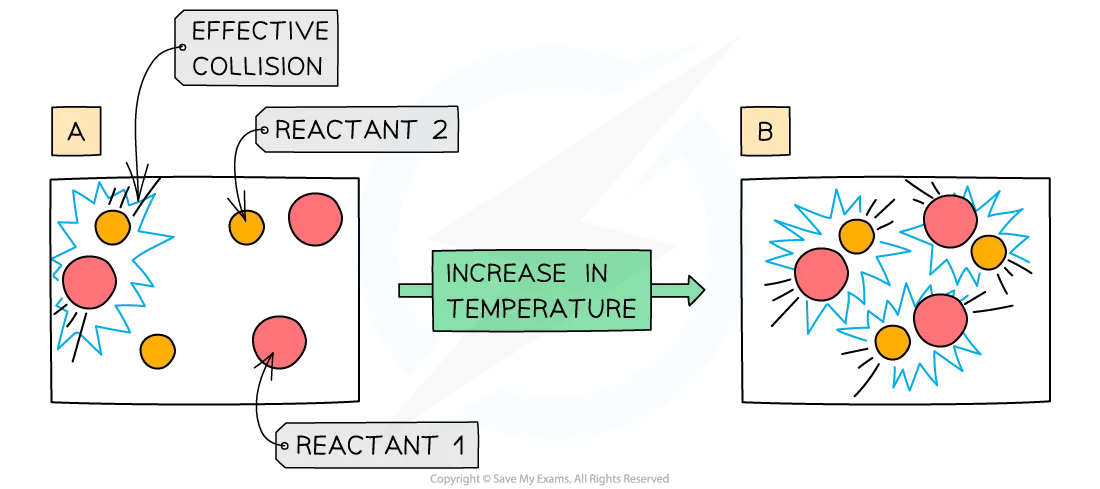
Diagram showing the increased kinetic energy that particles have at higher temperatures
The effect of increased concentration or pressure
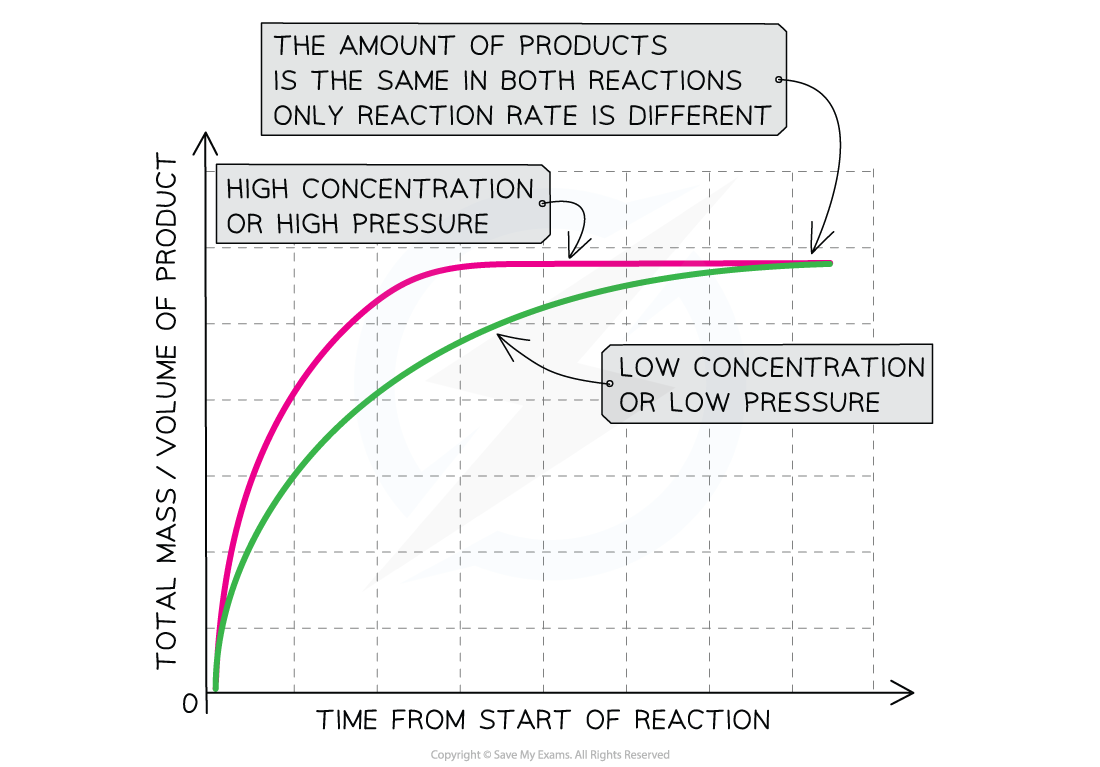
Increasing the concentration of a solution, or the pressure of a gas, increases the rate of reaction
Compared to a reaction with a reactant at a low concentration, the graph line for the same reaction but at a higher concentration/pressure has a steeper gradient at the start and becomes horizontal sooner
This shows that with increased concentration of a solution or increased pressure of a gas, the rate of reaction will increase
Explanation:
Increasing the concentration of a solution will increase the rate of reaction
This is because there will be more reactant particles in a given volume, allowing more frequent and successful collisions per second, increasing the rate of reaction
For a gaseous reaction, increasing the pressure has the same effect as the same number of particles will occupy a smaller space, increasing the concentration
If you double the number of particles you will double the number of collisions per second
The number of collisions is proportional to the number of particles present
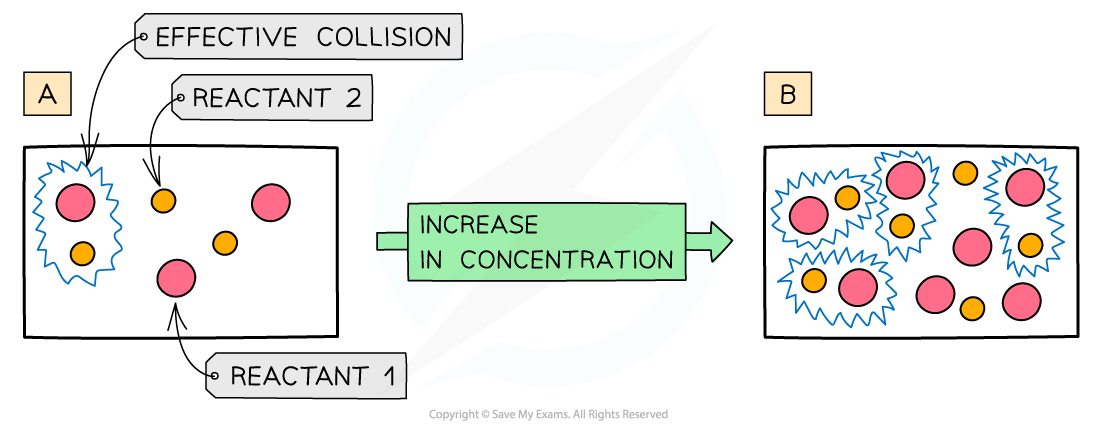
Diagram showing the decrease in space between particles at higher concentrations
Surface Area
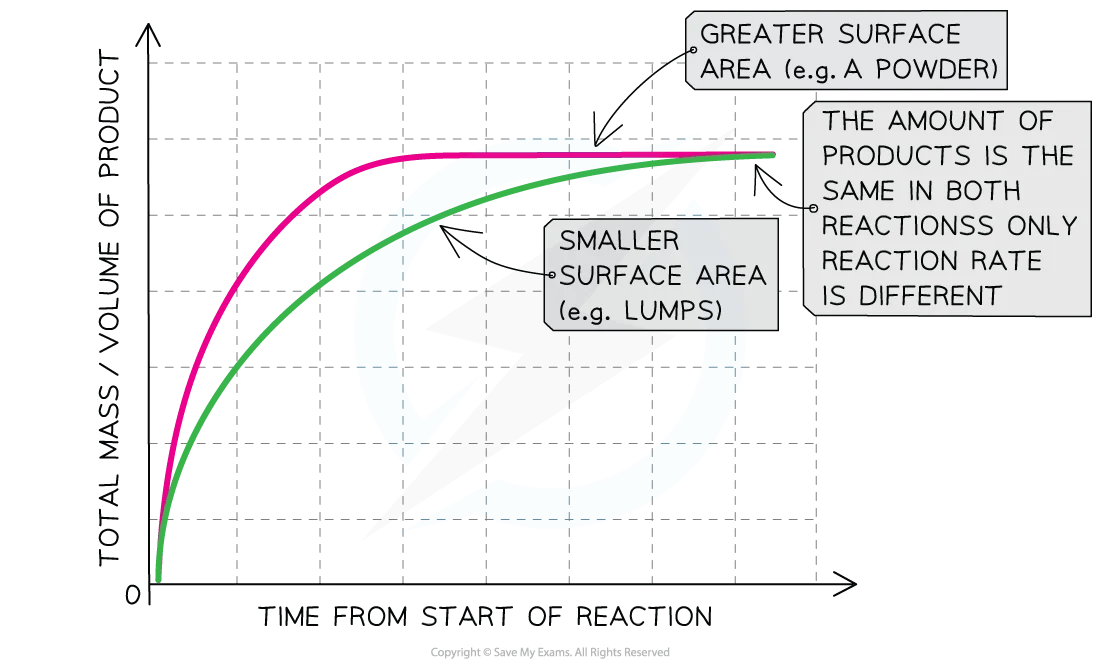
Increasing the surface area of a solid increases the rate of reaction
Compared to a reaction with lumps of reactant, the graph line for the same reaction but with powdered reactant has a steeper gradient at the start and becomes horizontal sooner
This shows that with increased surface area of the solid, the rate of reaction will increase
Explanation:
This is because more surface area of the particles will be exposed to the other reactant, producing a higher number of collisions per second
If you double the surface area you will double the number of collisions per second

An increase in surface area means more collisions per second
Catalysts
Catalysts are substances which speed up the rate of a reaction but are unchanged at the end of the reaction
The mass of a catalyst at the beginning and end of a reaction is the same and they do not form part of the equation

A catalyst increases the rate of reaction but does not change the final amount of product
Compared to a reaction without a catalyst, the graph line for the same reaction but with a catalyst has a steeper gradient at the start and becomes horizontal sooner
This shows that with a catalyst, the rate of reaction will increase
Explanation:
Different processes require different types of catalysts but they all work on the same principle of providing a different pathway for the reaction to occur that has a lower activation energy
This means a higher proportion of the reactant particles have energy greater than the activation energy and will result in more successful collisions per second
An important industrial example is iron, which is used to catalyse the Haber Process for the production of ammonia
Iron beads are used to increase the surface area available for catalysis
Enzymes are biological catalysts, they work best at specific temperature and pH ranges
Normally only small amounts of catalysts are needed to have an effect on a reaction

A catalyst lowers the activation energy of a reaction by providing an alternative reaction pathway
Examiner Tips and Tricks
When answering questions on the effect of concentration on the rate of reaction, you should mention that there are more particles per unit volume (usually cm3) and this causes an increase in the rate of collisions.

Unlock more, it's free!
Join the 100,000+ Students that ❤️ Save My Exams
the (exam) results speak for themselves:

Was this revision note helpful?
Build on this topic