Inverse Normal Calculations (College Board AP® Statistics): Study Guide

Inverse normal calculations
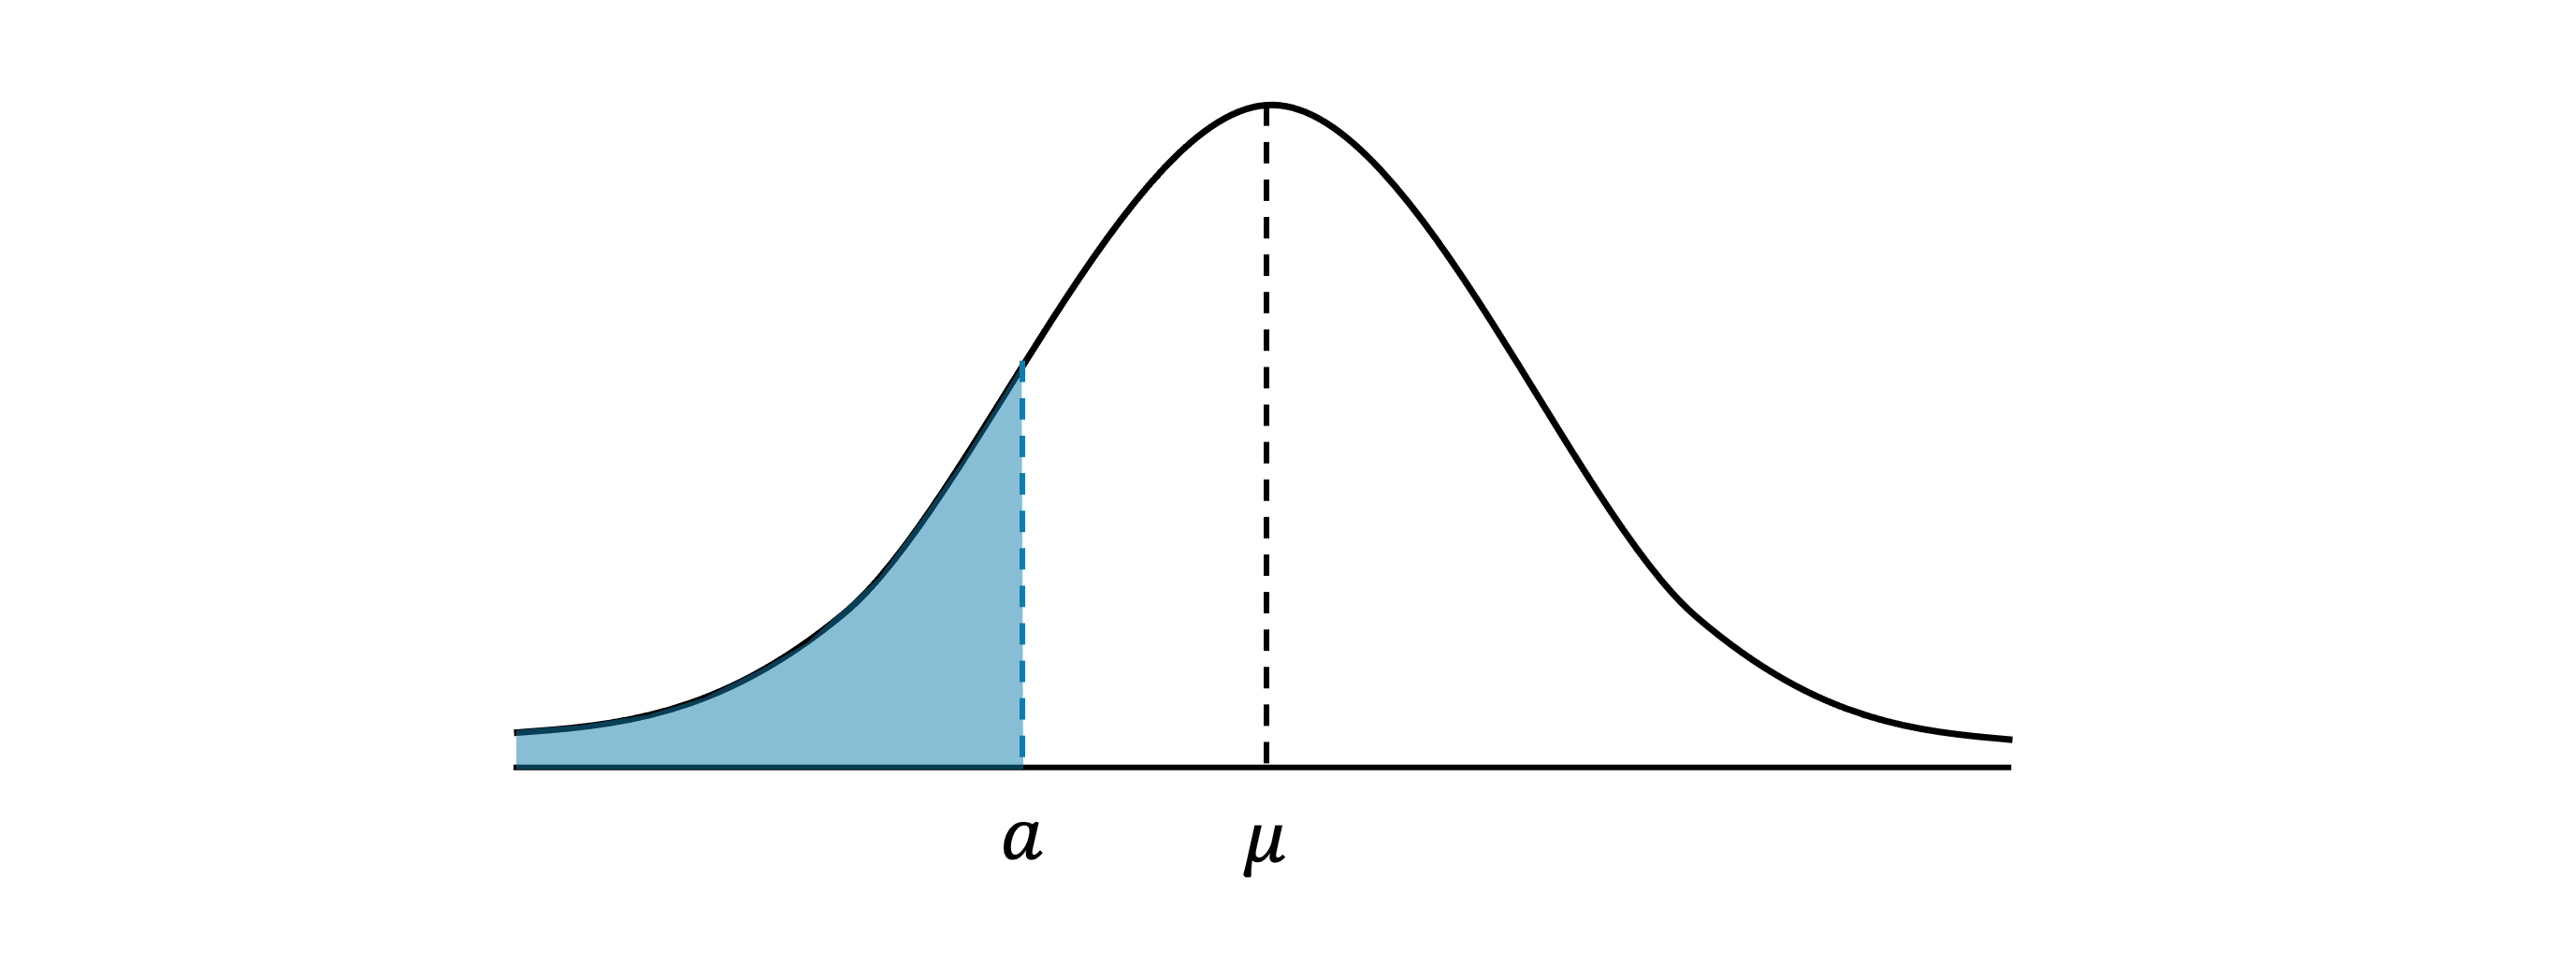
Given the value P(X < a) how do I find the value of a using the standard normal table?
The proportion of a distribution of a variable that lies below a given value is the area under the curve to the left of the given value
This is also the probability that the variable lies below this value
where is the -score of the value
If you are given the proportion (or probability) and want to work out the value of :
find the cell in the standard normal table that is
equal to the proportion
or the highest value that is less than the proportion
identify the -score by listing the relevant row and column
convert the -score back into an actual value
Given the value of P(X < a) how do I find the value of a using a calculator?
Your calculator will have a function called Inverse Normal Distribution
Some calculators call this InvN
Given that you will need to enter:
The proportion (or probability),
This is the area of the distribution to the left of
The mean,
The standard deviation,
Some calculators might ask for the tail
For this is the left tail
Examiner Tips and Tricks
Always check your answer makes sense!
If is less than 0.5 then should be smaller than the mean,
If is more than 0.5 then should be bigger than the mean.
A sketch will help you see this.
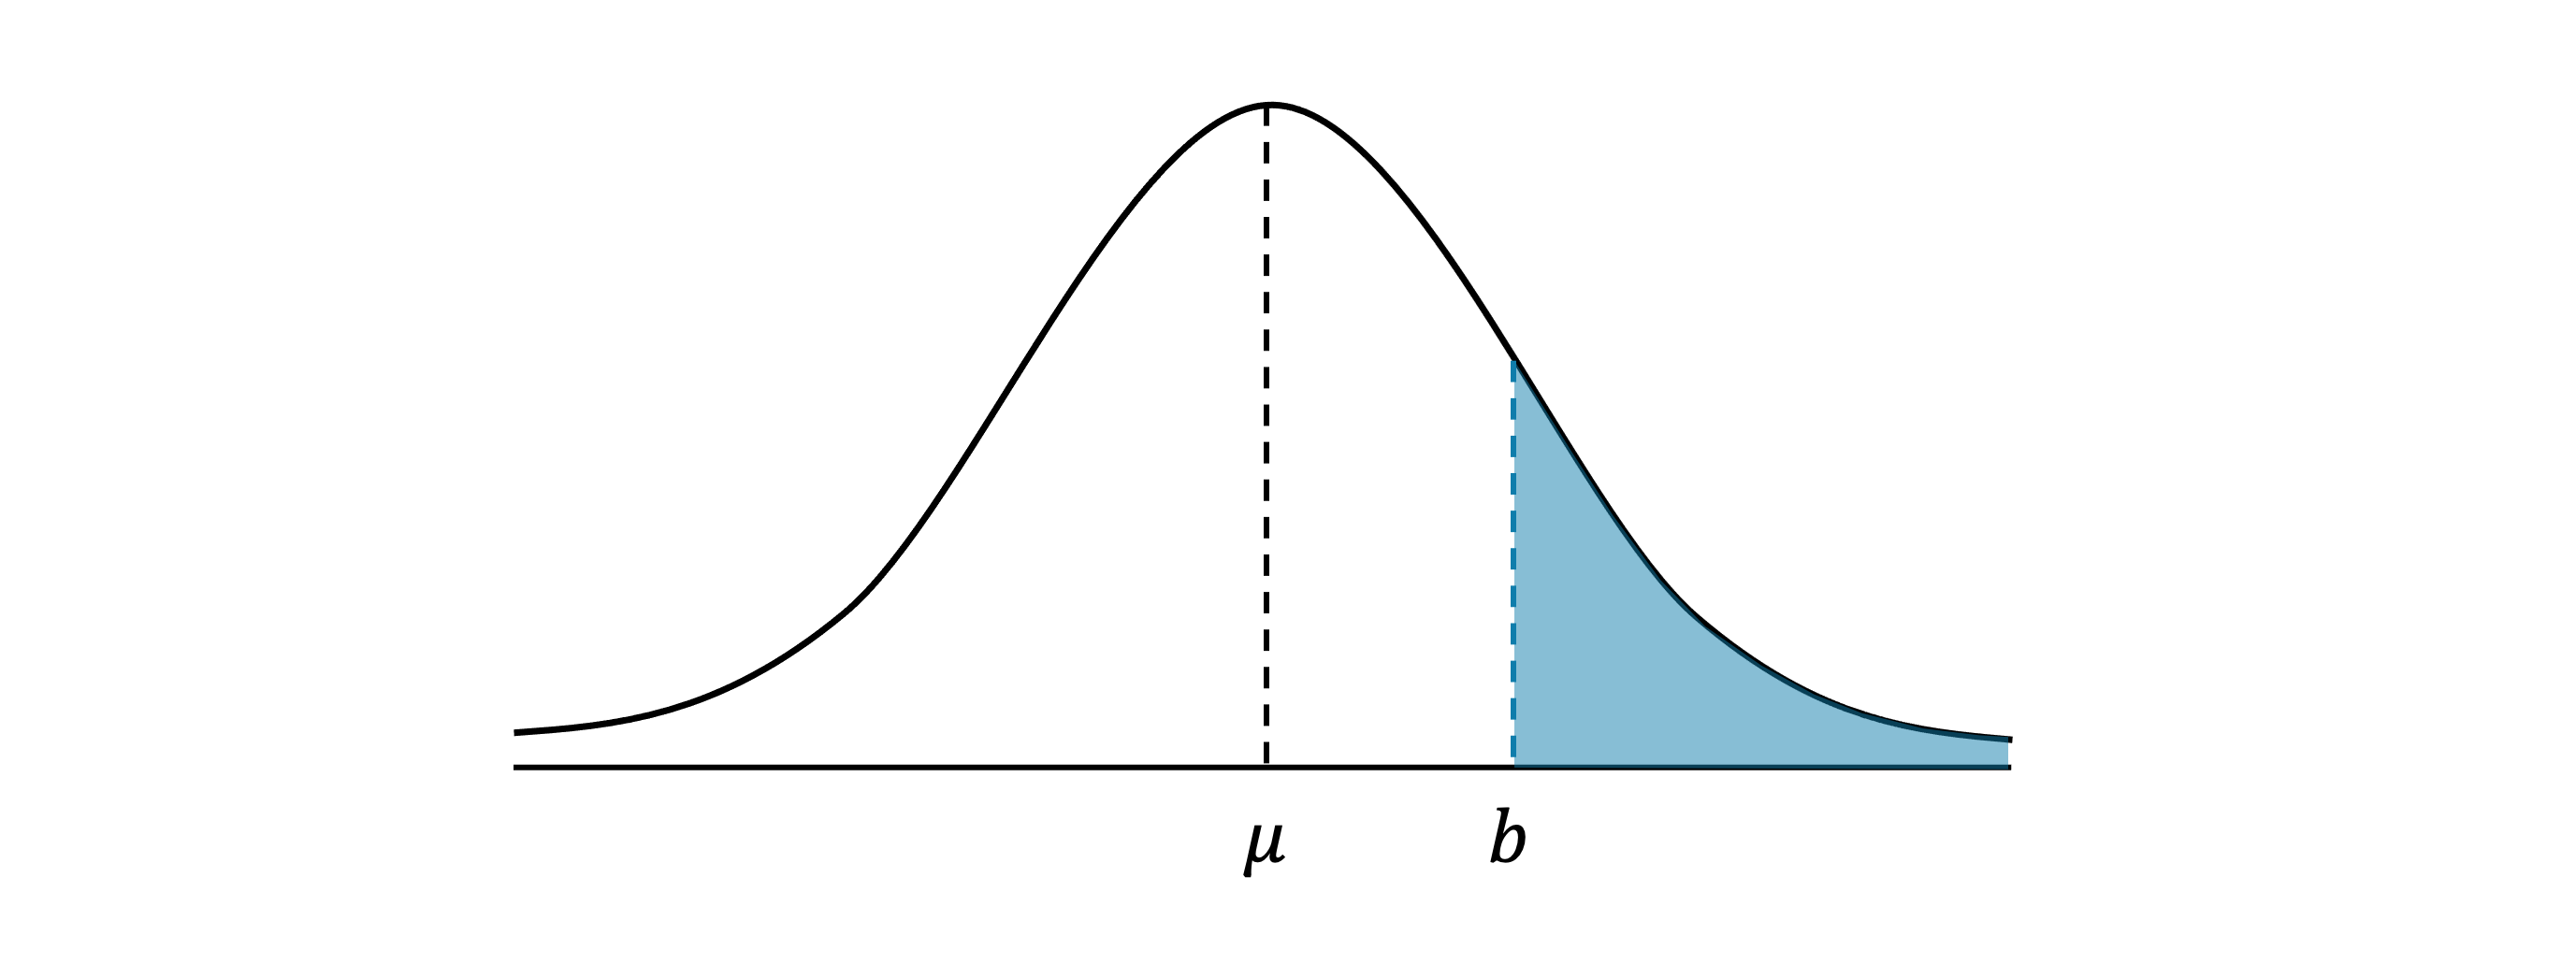
Given the value of P(X > b) how do I find the value of a using the standard normal table?
The proportion of a a distribution of a variable that lies above a given value is the area under the curve to the right of the given value
This is also the probability that the variable lies above this value
where is the -score of the value
The total area under the curve is 1
So
If you are given the proportion (or probability) and want to work out the value of :
subtract the proportion from 1
find the cell in the standard normal table that is
equal to this result
or the lowest value that is greater than the proportion
identify the -score by listing the relevant row and column
convert the -score back into an actual value
Given the value of P(X > b) how do I find the value of b using a calculator?
You will need to use the Inverse Normal Distribution function again
Given
Use to rewrite this as
Then use the method for to find
Your calculator may have the tail option (left, right or centre)
If so, you can use the Inverse Normal Distribution function straightaway by:
selecting right for the tail
and entering the area as
Examiner Tips and Tricks
Always check your answer makes sense!
If is less than 0.5 then should be bigger than the mean,
If is more than 0.5 then should be smaller than the mean.
A sketch will help you see this.
How can I use the table for t-distribution critical values?
You will later learn that the t-distribution tends to the standard normal distribution when the degree of freedom tends to infinity
In your exam, you have a table of t-distribution critical values
These give the values of such that
You can use the row for infinity (∞) to find z-scores that give probabilities
The table only gives certain common values of
You can use symmetries of the normal distribution to find negative z-scores
For example, the table tells you
This means
To use this table, write the probability statement in the form
If the probability is greater than 0.5, subtract it from 1 and flip the inequality
For example, if you want then rewrite as
If the sign is , then flip the inequality and change the sign of the z-score
For example, if you want then find and change the z-score to a negative
Worked Example
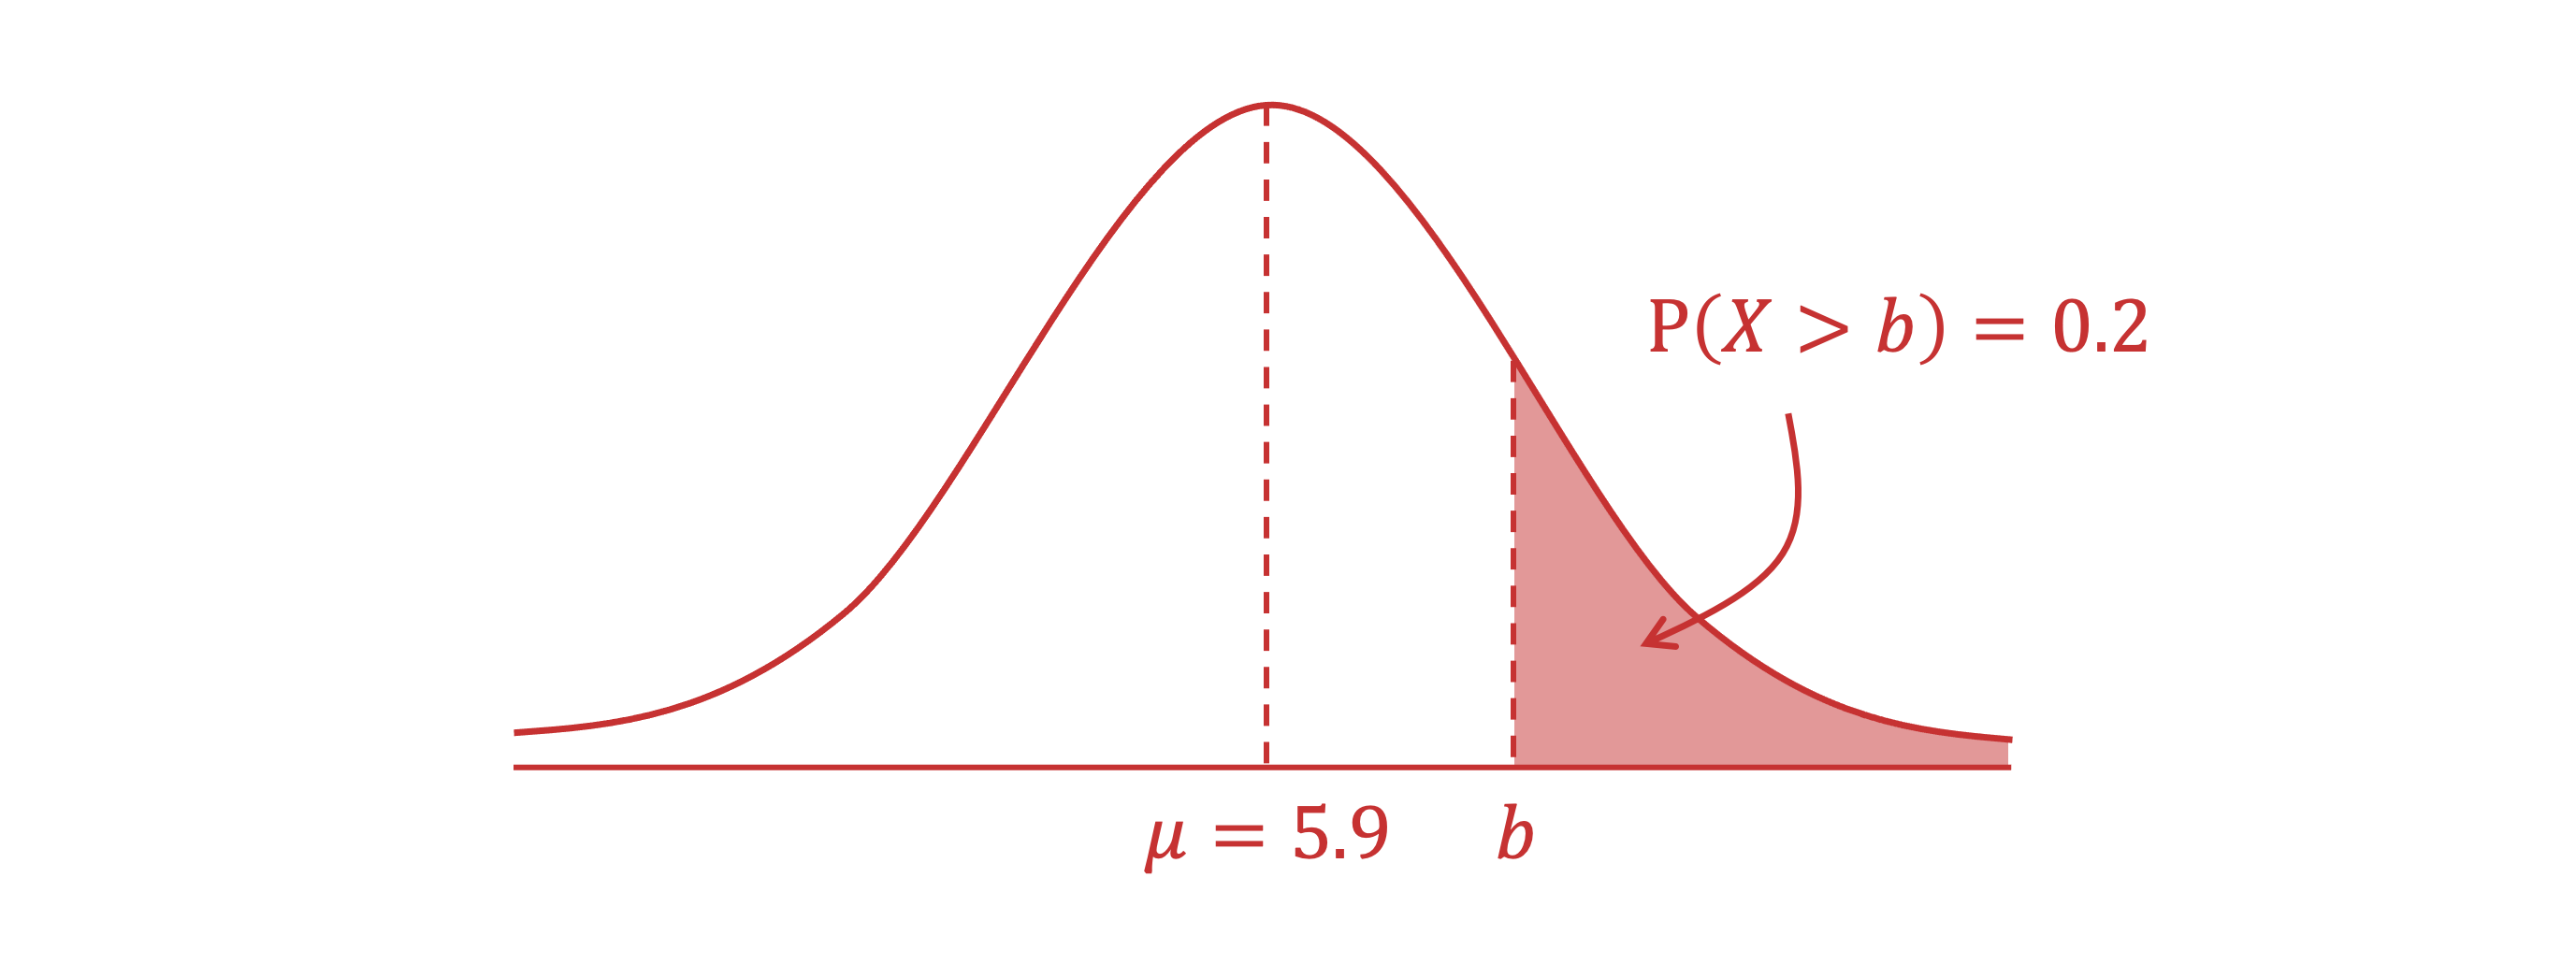
The distribution of heights of all adult male bison in a particular herd of bison is approximately normal with a mean of 5.9 feet and standard deviation 0.16 feet. The rancher wants to select the tallest twenty percent of the bison to use for a breeding program.
What is the minimum height that an adult male bison must be to qualify for the breeding program?
Answer:
Draw a sketch of the situation
Because , is less than 0.5, should be bigger than the mean, i.e. lies to the right of the mean
Method 1: Using the tables
Using the standard normal table, look at the section with the positive -values as is above the mean
You can use the ∞ row in the table for t-distribution critical values
Convert the -score into an actual value, using
Explain the value in the context of the question
The minimum height that an adult male bison must be to qualify for the breeding program is 6.04 feet (to 3 significant figures)
Method 2: Using a calculator
Write down the parameters for the situation
Enter these values into the Inverse Normal Distribution function on your calculator and calculate
Explain the value in the context of the question
The minimum height that an adult male bison must be to qualify for the breeding program is 6.04 feet (to 3 significant figures)

Unlock more, it's free!
Join the 100,000+ Students that ❤️ Save My Exams
the (exam) results speak for themselves:

Was this revision note helpful?
Build on this topic
