Finding Probabilities from Normal Distributions (College Board AP® Statistics): Study Guide

Finding probabilities from normal distributions
What is the standard normal table?
The proportion of a distribution of a variable within a particular interval can be determined using the standard normal table given to you in the exam
The standard normal table shows the proportion of the distribution (or percentage of values) that lie below a particular -score on a standard normal distribution
A -score is the number of standard deviations that a value is from the mean
A -score on the table is made up from
the row that corresponds to the correct units and tenths of the -score
and the column that corresponds to the correct hundredths of the -score
e.g. a -score of -1.32 would use the row -1.3 and the column 0.02
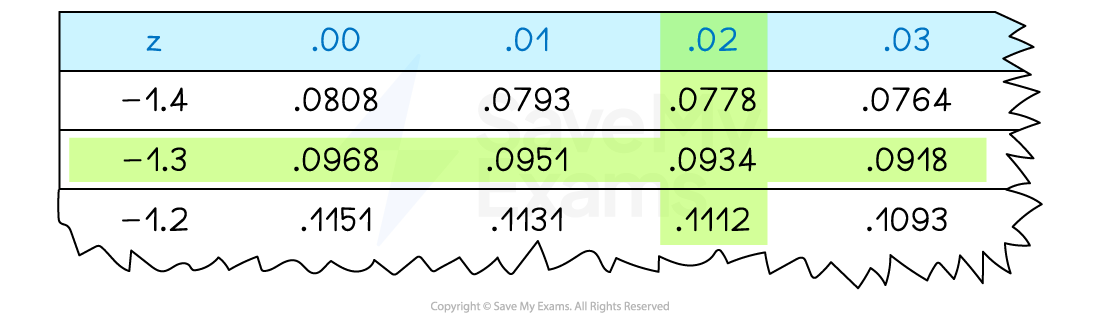
You can also calculate proportions using your calculator
Examiner Tips and Tricks
When using technology to find the proportion of a distribution within a given interval it is essential to always show full working in Free Response Questions (FRQs). Write down any -scores and parameters that you use.
How do I find a probability that a normal variable is below a given value using a standard normal table?
The proportion of a distribution of a variable that lies below a given value is the area under the curve to the left of the given value

To find this proportion using the standard normal table:
find the -score for the value
use this -score to locate the appropriate row and column in the standard normal table
identify the cell that corresponds to this row and column
the value in this cell is , the proportion of the distribution that lies below the -score
this is equal to , the proportion of the distribution that lies below
How do I find a probability that a normal variable is below a given value using a calculator?
You need a calculator that can calculate cumulative normal probabilities
You want to use the Normal Cumulative Distribution function
This is sometimes shortened to NCD, Normal CD or Normal Cdf
When using a calculator to find a proportion you can use the given values
You do not need to enter the associated -scores first
However you should write down the -score in the exam to support your work
To find , you will need to enter:
The lower bound
this needs to be a value that is sufficiently smaller than the mean
an easy option is to input lots of 9's for the lower bound with a negative sign (-99999999... or -1099)
The upper bound
this will be the value
The mean,
The standard deviation,
How do I find a probability that a normal variable is above a given value using a standard normal table?
The proportion of a distribution of a variable that lies above a given value is the area under the curve to the right of the given value

The total area under the curve is 1
So
To find this proportion using the standard normal table:
find the -score for the value
use this -score to locate the appropriate row and column in the standard normal table
identify the cell that corresponds to this row and column
subtract the value in this cell from 1
the result is , the proportion of the distribution that lies above the -score
this is equal to , the proportion of the distribution that lies above
How do I find a probability that a normal variable is above a given value using a calculator?
You will still use the Normal Cumulative Distribution function
To find , you will need to enter:
The lower bound
this will be the value
The upper bound
this needs to be a value that is sufficiently bigger than the mean
an easy option is to input lots of 9's for the upper bound with a positive sign (99999999... or 1099)
The mean,
The standard deviation,
How do I find a probability that a normal variable is within an interval using a standard normal table?
The proportion of a distribution that lies in a given interval is the area under the curve between the lower bound value, , and the upper bound value,

To find this proportion using the standard normal table:
find the -score for both the value and the value
use these -scores in the standard normal table to find the proportion of the distribution that lies below each value
subtract the proportions of the two -scores
This is equal to ,the proportion of the distribution that lies between and
How do I find a probability that a normal variable is within an interval using a calculator?
You will still use the Normal Cumulative Distribution function
To find , you will need to enter:
The lower bound
this will be the value
The upper bound
this will be the value
The mean,
The standard deviation,
Examiner Tips and Tricks
It is often useful to sketch a quick diagram of the section of the distribution that you are looking for.
Worked Example
An environmental group conducted a study measuring the dissolved oxygen content in a large number of samples of water to determine the water quality of a local lake. The results of the study found a mean level of 6.8 mg/l and a standard deviation of 0.7mg/l. A water sample with a dissolved oxygen content of less than 5 mg/l is considered to be unhealthy for fish.
What proportion of the water samples are considered to contain levels of dissolved oxygen that are unhealthy for fish?
Answer:
Define your variable and its distribution
Let be the level of dissolved oxygen in the water samples
The distribution of is normal with mean 6.8 and standard deviation 0.7
Draw a sketch describing the proportion of the distribution you are trying to find and write a probability statement for
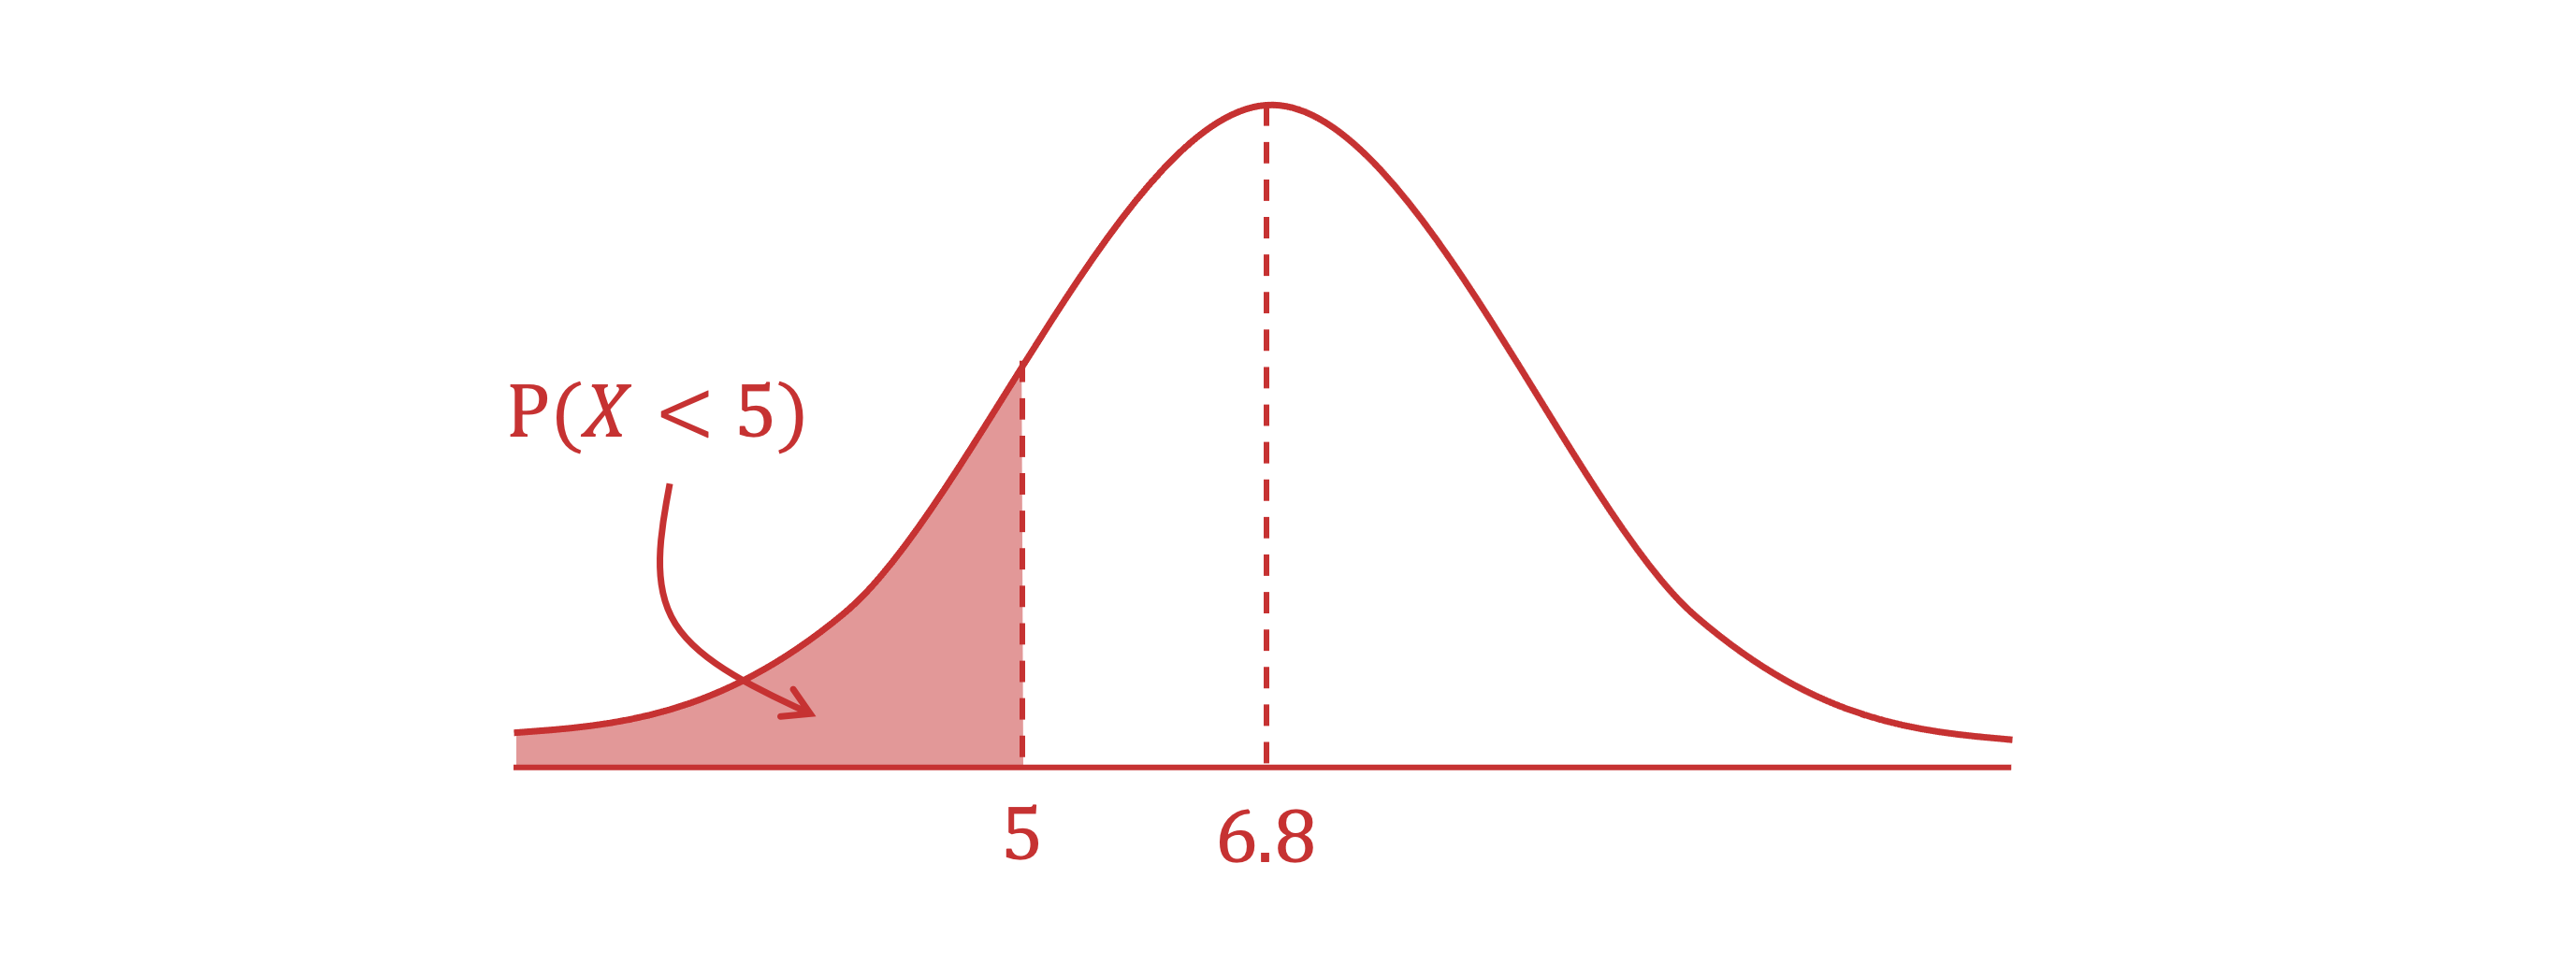
Method 1: Using the standard normal table
Calculate the -score for the value of 5mg/l, using
A value of 5mg/l lies 2.57 standard deviations below the mean
Using the -score 2.57, find the row labeled -2.5 and the column labeled 0.7 on the standard normal table, and the cell where they intersect
Write a probability statement for
Explain the value in the context of the question, leaving the value from the table to 4 significant figures
The proportion 0.0051 (or 0.51%) of water samples taken contain an unhealthy dissolved oxygen level of less than 5mg/l
Method 2: Using a calculator
Even though you do not need to enter it into your calculator, it is a good idea to write down the calculation of the -score for the value of 5mg/l, using ,
Write a probability statement for
Write down the parameters for the situation
lower bound = -1099
upper bound = 5
Enter these values into the Normal Cumulative Distribution function on your calculator
Explain the value in the context of the question
The proportion 0.0051 (or 0.51%) of water samples taken contain an unhealthy dissolved oxygen level of less than 5mg/l

Unlock more, it's free!
Join the 100,000+ Students that ❤️ Save My Exams
the (exam) results speak for themselves:

Was this revision note helpful?
Build on this topic
