Interpolation & Extrapolation using Linear Models (College Board AP® Statistics): Study Guide

Linear models for scatterplots
What is a linear model?
A linear model is a line that best fits the data on a scatterplot
The linear model shows the linear relationship between the explanatory variable, , and the response variable,
What is a linear regression line?
A linear regression model is of the form
is the y-intercept
is the slope
A linear model allows you to make predictions (estimates) of a -value, when given a specific -value
The straight line is called a linear regression line ('regression line' for short)
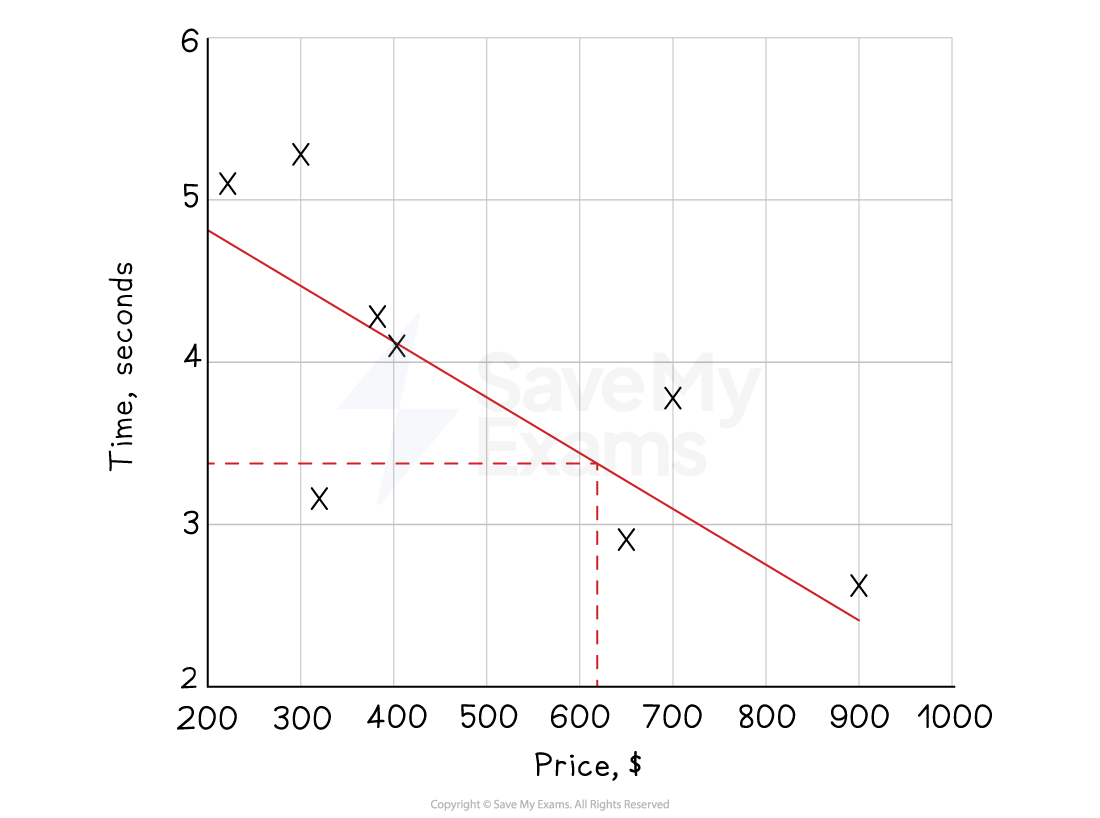
For example, data for the price of a computer and the time it takes the computer to start up are shown below
The regression line predicts that a computer worth $620 will start up in 3.4 seconds

Interpolation & extrapolation
What is interpolation?
Interpolation means using a regression line to predict a -value from a given -value
where the value of lies within the interval of -values seen in the data
This is seen as a reliable prediction
For example, data for the price of the computer and the time it takes the computer to start up are shown below
Predicting the start up time of a computer worth $620 is interpolation
because $620 lies within the interval of -values seen, from $220 to $900
What is extrapolation?
Extrapolation means using a regression line to predict a -value from a given -value
where the value of lies outside the interval of -values seen in the data
It can be thought of as extending the regression line on either side
then using those line segments to predict values
e.g. from above, predicting the start up time for a computer costing over $900 would be extrapolation
This is far less reliable as you do not know how the variables relate outside of the range of data given
The linear relationship might break down or change direction
The further you extrapolate, the less reliable the estimates become
Worked Example
A marine biologist collected data on the length (in centimeters) and weight (in kilograms) of 15 adult female harbor seals in a specific region. The lengths of the adult seals in the sample ranged from 135 cm to 175 cm. The data were used to create the following least-squares regression line:
(a) Calculate the predicted weight for a harbor seal from this population that is 160 cm long. Does this calculation represent interpolation or extrapolation? Justify your answer.
(b) The biologist wants to use this regression model to predict the weight of a newborn harbor seal pup that is 85 cm long. Calculate the predicted weight for this seal pup. Does this calculation represent interpolation or extrapolation? Explain why this prediction might be unreliable.
Answer:
(a)
Calculate the predicted weight
74.8 kilograms
Interpolation is predicting a response value using a value for the explanatory variable that is within the interval of x-values used to determine the regression line
This calculation represents interpolation
Because 160 cm falls between the sample lengths of 135 cm and 175 cm, it is an interpolated prediction
(b)
Calculate the predicted weight
18.55 kilograms
Extrapolation is predicting a response value using a value for the explanatory variable that is beyond the interval of x-values used to determine the regression line
This calculation represents extrapolation
Because 85 cm is significantly outside the observed domain of 135 cm to 175 cm, the prediction is less reliable
There is no guarantee that the linear relationship observed for adult female seals will remain the same for newborn pups (the true relationship might be curved or have a different rate of change outside the studied interval)

Unlock more, it's free!
Join the 100,000+ Students that ❤️ Save My Exams
the (exam) results speak for themselves:

Was this revision note helpful?
Build on this topic
