Tectonic Hazards & Impacts (Edexcel A Level Geography): Exam Questions

Exam code: 9GE0

2 hours12 questions
1a
Sme Calculator
1 mark

Study Figure 1

Year

Location

Deaths recorded

1979

Colombia

600

1991

Costa Rica

2

1992

Nicaragua

170

1995

Mexico

1

1996

Peru

12

2001

Peru

26

2007

Chile

10

2007

Peru

3

2010

Chile

156

2015

Chile

8

Summary Statistics

Number of tsunami events

10

Deaths recorded

988

Mean

Median

Interquartile range

Figure 1

The number of deaths resulting from tsunami events, Eastern Pacific 1979 - 2015

This is part of an investigation into the spatial impacts of tsunami events

Calculate the mean number of deaths recorded.

Mean = ...........................................

1b
Sme Calculator
1 mark

Calculate the median number of deaths recorded.

Median = ..........................................................

1c
Sme Calculator
2 marks

Calculate the interquartile range for the number of deaths recorded. You must show your working.

Interquartile range = .....................................................

2
Sme Calculator
2 marks

Study Figure 1. This is part of an investigation showing the total number of deaths caused by earthquake events for 11 years from 2011 to 2021.

Year

Total deaths from earthquake events

2011

21,942

2012

689

2013

1,572

2014

756

2015

9,624

2016

1,297

2017

1,012

2018

4,535

2019

244

2020

180

2021

2,476

Using the data in Figure 1, calculate the mean number of deaths for these earthquake events.

Give your answer to one decimal place. You must show your working.

3
Sme Calculator
2 marks

Study Figure 1. This is part of an investigation showing the total number of deaths caused by earthquake events for 11 years from 2011 to 2021.

Year

Total deaths from earthquake events

2011

21,942

2012

689

2013

1,572

2014

756

2015

9,624

2016

1,297

2017

1,012

2018

4,535

2019

244

2020

180

2021

2,476

Using the data in Figure 1, calculate the median number of deaths caused by these earthquake events.

You must show your working.

4
Sme Calculator
1 mark

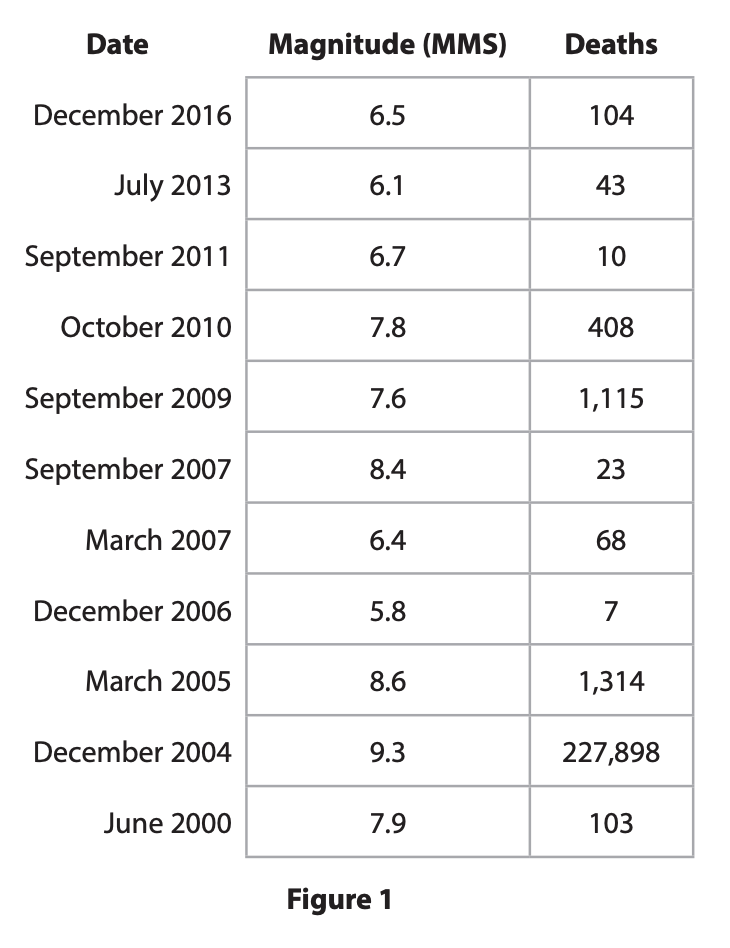
Study Figure 1. This is part of an investigation into the impacts of earthquake events with over five deaths, in Sumatra, Indonesia.

Table titled Figure 1 listing earthquakes from 2000–2016 with date, magnitude (MMS) and deaths, including the deadly 9.3 event in December 2004

Calculate the mean magnitude of these earthquakes. Give your answer to one decimal place.

5
Sme Calculator
1 mark

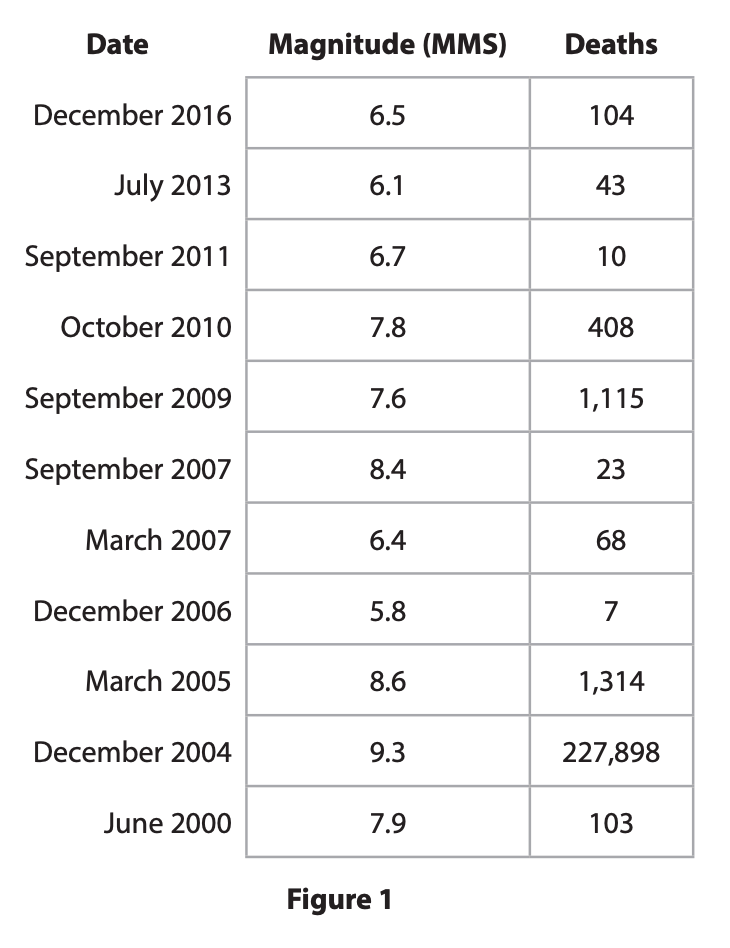
Calculate the median number of deaths caused by these earthquakes.

Table titled Figure 1 listing earthquakes from June 2000 to December 2016 with magnitudes 5.8–9.3 and corresponding deaths ranging from 7 to 227,898
6
Sme Calculator
2 marks

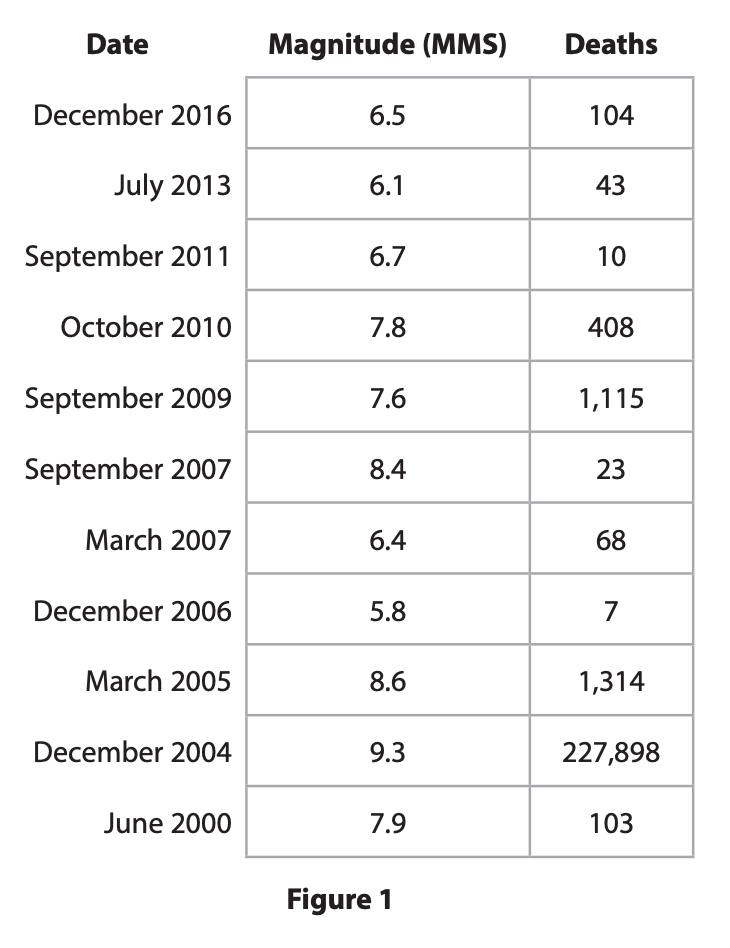
Calculate the interquartile range of deaths caused by these earthquakes. You must show your working.

Table titled Figure 1 listing earthquake dates from 2000–2016 with magnitudes 5.8–9.3 MMS and corresponding death tolls from 7 to 227,898
1
Sme Calculator
12 marks

Assess the view that the social and economic impacts of earthquakes are mainly the result of their magnitude.

2
12 marks

Assess the importance of levels of development in understanding the impacts of tectonic hazards.

3
20 marks

Evaluate the view that the level of development is the most important factor in determining the scale of impacts of a tectonic hazard.

4
12 marks

Assess the importance of the level of development in determining the impacts of tectonic hazards.

5
12 marks

Assess the extent to which the magnitude of a tectonic event determines the scale of its impacts.

6
12 marks

Assess the usefulness of hazard profiles in comparing tectonic hazards.