Shape & Skewness of Distributions (College Board AP® Statistics): Revision Note

Skewness of distributions
What is skewness?
Skewness describes the shape of a distribution
It describes the symmetry or asymmetry of the distribution
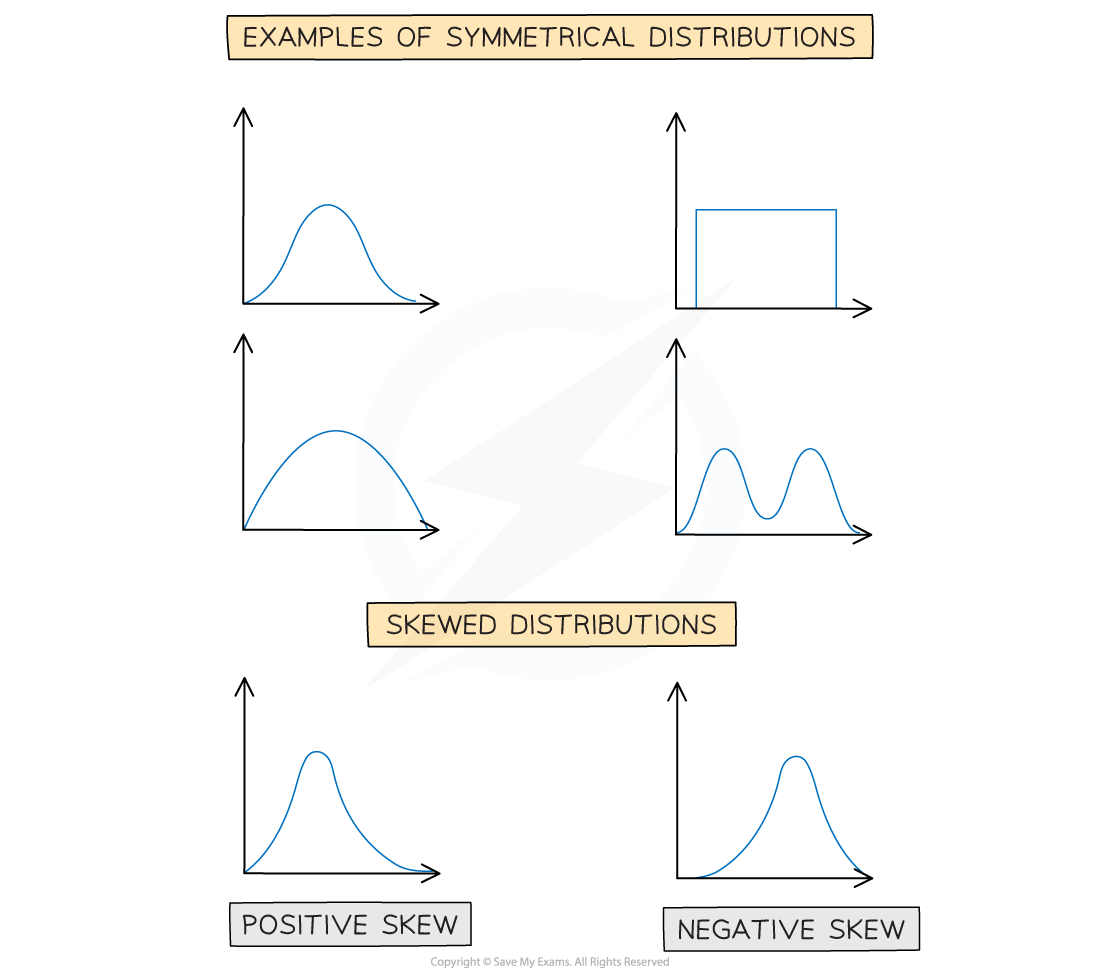
A distribution has positive skew if the shape leans to the left
Values above the median have a greater spread than values below the median
The right tail is longer than the left tail
The distribution is said to be skewed to the right
This is because the data usually cause the mean to be to the right of the median
A distribution has negative skew if the shape leans to the right
Values below the median have a greater spread than values above the median
The left tail is longer than the right tail
The distribution is said to be skewed to the left
This is because the data usually cause the mean to be to the left of the median
A distribution is symmetrical if the left side and right side are reflections of each other about the median
The mean and median are equal
How is the skew related to the median and the mean?
The skewness is related to the median and the mean of the data set
In a symmetric distribution
the median and the mean are roughly the same
median mean
In a positively skewed distribution
median < mean
In a negatively skewed distribution
mean < median
Examiner Tips and Tricks
If you are asked to describe a distribution then comment on its skewness.
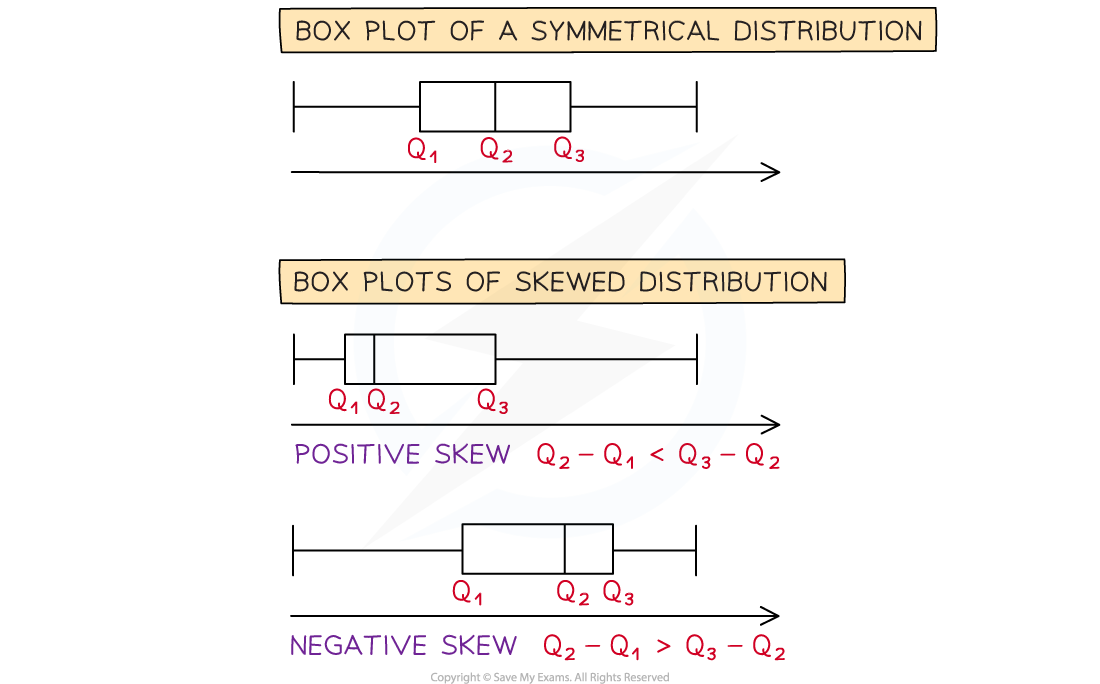
How do I find the skewness from the quartiles?
If the median is roughly in the middle of the first and third quartiles, then the distribution is approximately symmetric
If the median is closer to the first quartile, then the distribution has positive skew
If the median is closer to the third quartile then the distribution has negative skew
Examiner Tips and Tricks
If you are asked to state the shape of a distribution, then you must give a reason. You could use summary statistics or describe its visual feature.
Features of a distribution
What are clusters, gaps, outliers and peaks?
A cluster is a region of the distribution where the data is concentrated
This means there are a lot of data points in a region
A gap is a region of the distribution where there is no data
Clusters are normally separated by gaps
An outlier is a point that is far away from the majority of the data
An outlier is very small or very large compared to the rest of the data points
A peak of a distribution occurs at a value or group where the frequency is higher than the nearby values or groups
A peak occurs at the mode
Peaks can occur at places other than the mode

What are uniform, unimodal and bimodal distributions?
A uniform distribution has no peaks
The frequency is the same for all values or groups
If the frequencies are approximately equal then the distribution is approximately uniform
A unimodal distribution has one main peak
A bimodal distribution has two prominent peaks
One peak might be higher than the other

Examiner Tips and Tricks
If you are asked to describe a distribution then comment on any unusual features such as clusters, gaps, outliers and peaks.

Unlock more, it's free!
Join the 100,000+ Students that ❤️ Save My Exams
the (exam) results speak for themselves:

Was this revision note helpful?
Build on this topic