Two-Way Tables & Relative Frequencies (College Board AP® Statistics): Revision Note

Two-way tables
What is a two-way table?
A two-way table is used when there are two categorical variables
e.g. the school year and favorite subject of a random sample of students
The rows represent one variable and the columns represent the other variable
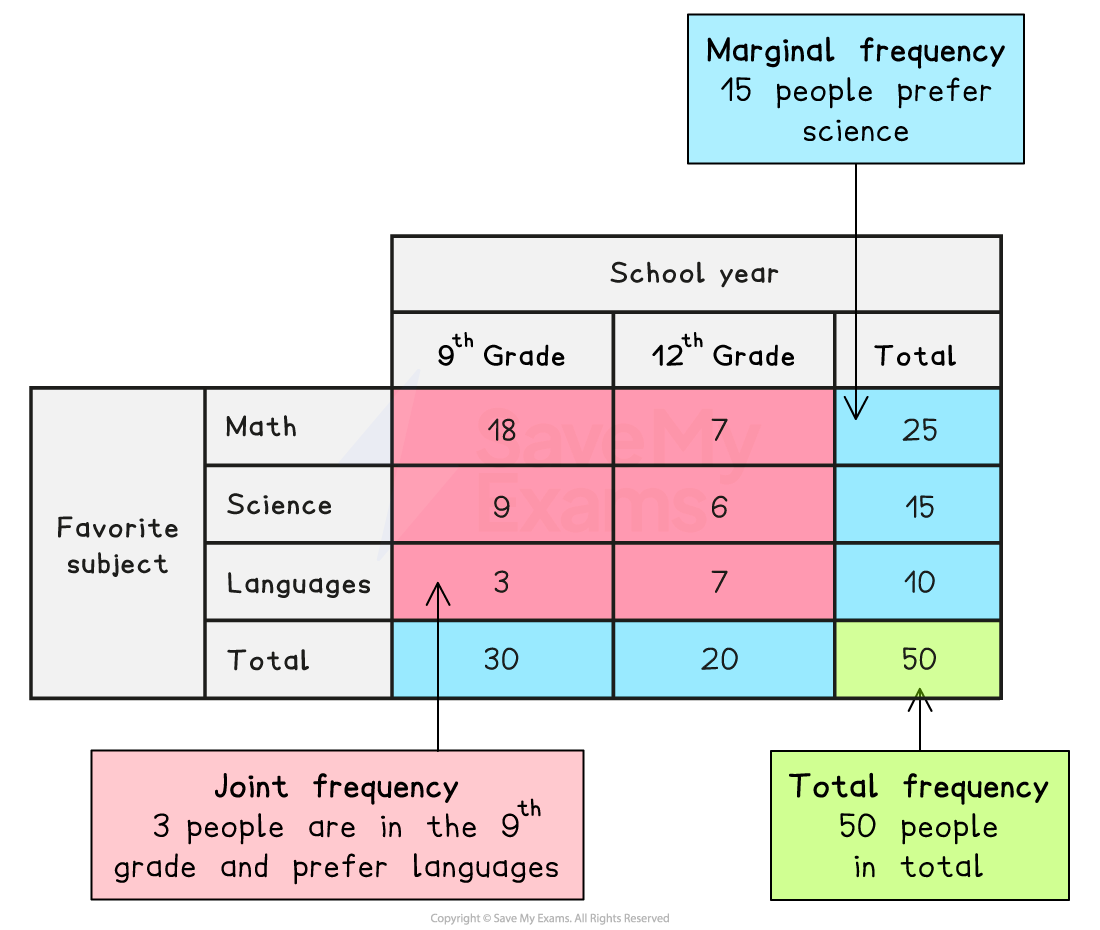
The number in a cell of a two-way table represents the frequency of the data, which satisfies the relevant values of both variables
This is called the cell frequency or the joint frequency
The totals for each row and each column are usually included in a two-way table
These are called marginal frequencies
Joint, marginal & conditional relative frequencies
What are joint relative frequencies?
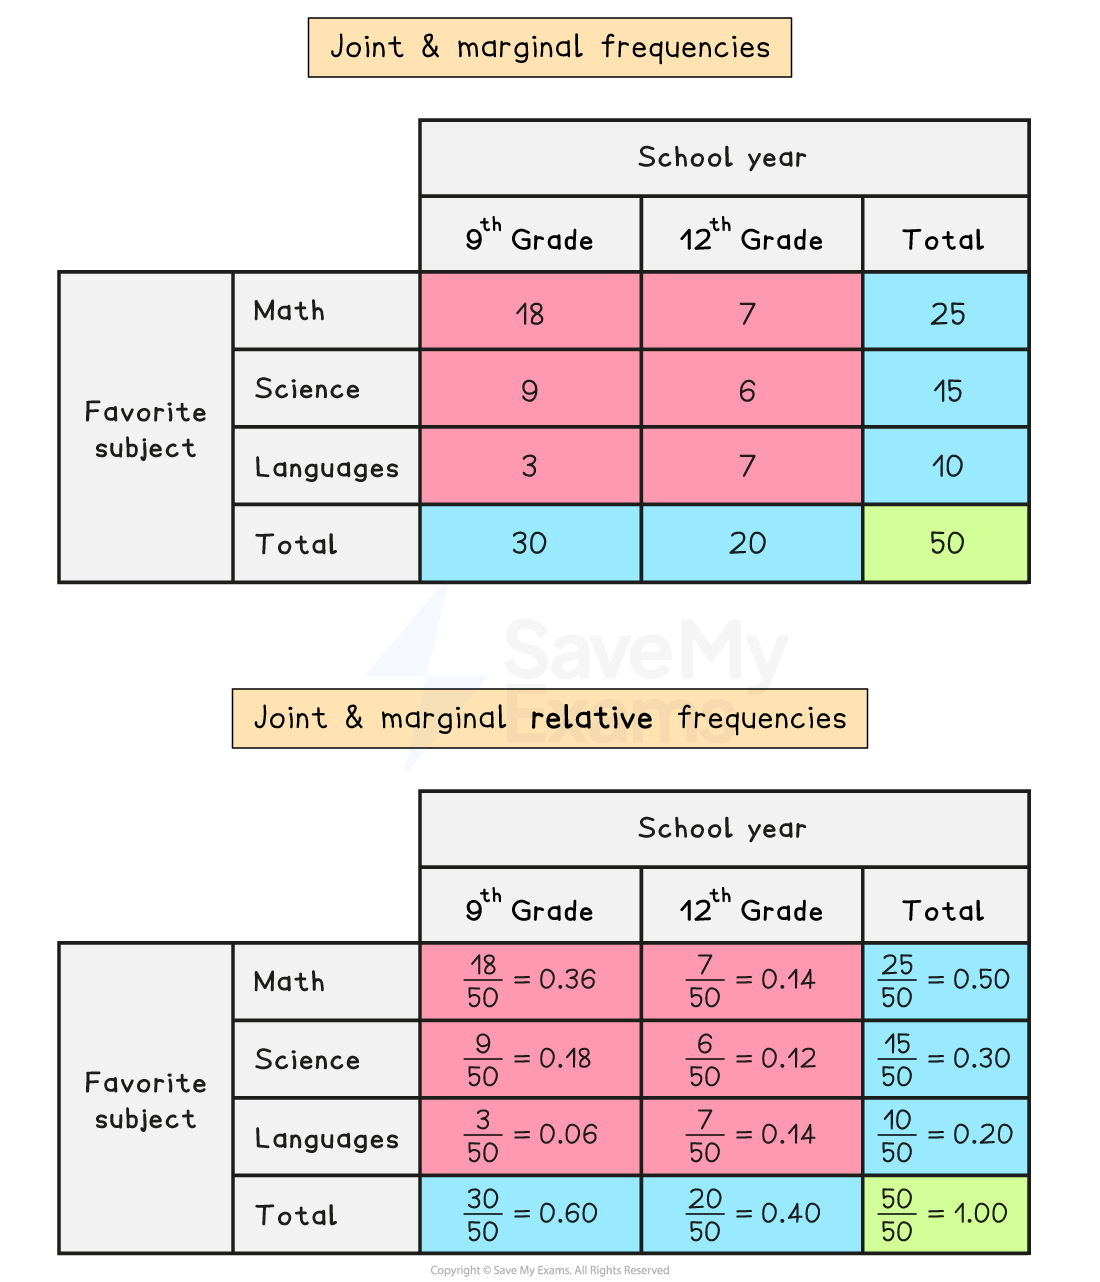
The joint relative frequencies are the proportions of the total that belong to each cell
To calculate a joint relative frequency for a cell
divide the joint (cell) frequency by the total frequency
e.g. divide the number of students in the 9th grade who say math is their favorite subject by the total number of students
If a two-way table is used to display joint relative frequencies then the total for the table is 1
What are marginal relative frequencies?
The marginal relative frequencies are the proportions of the total that belong to each row or column
To calculate a marginal relative frequency for a row or column
divide the marginal frequency by the total frequency
e.g. divide the number of students in the 9th grade by the total number of students
If a two-way table is used to display joint relative frequencies then each row or column will add up to the corresponding marginal relative frequency
What are conditional relative frequencies?
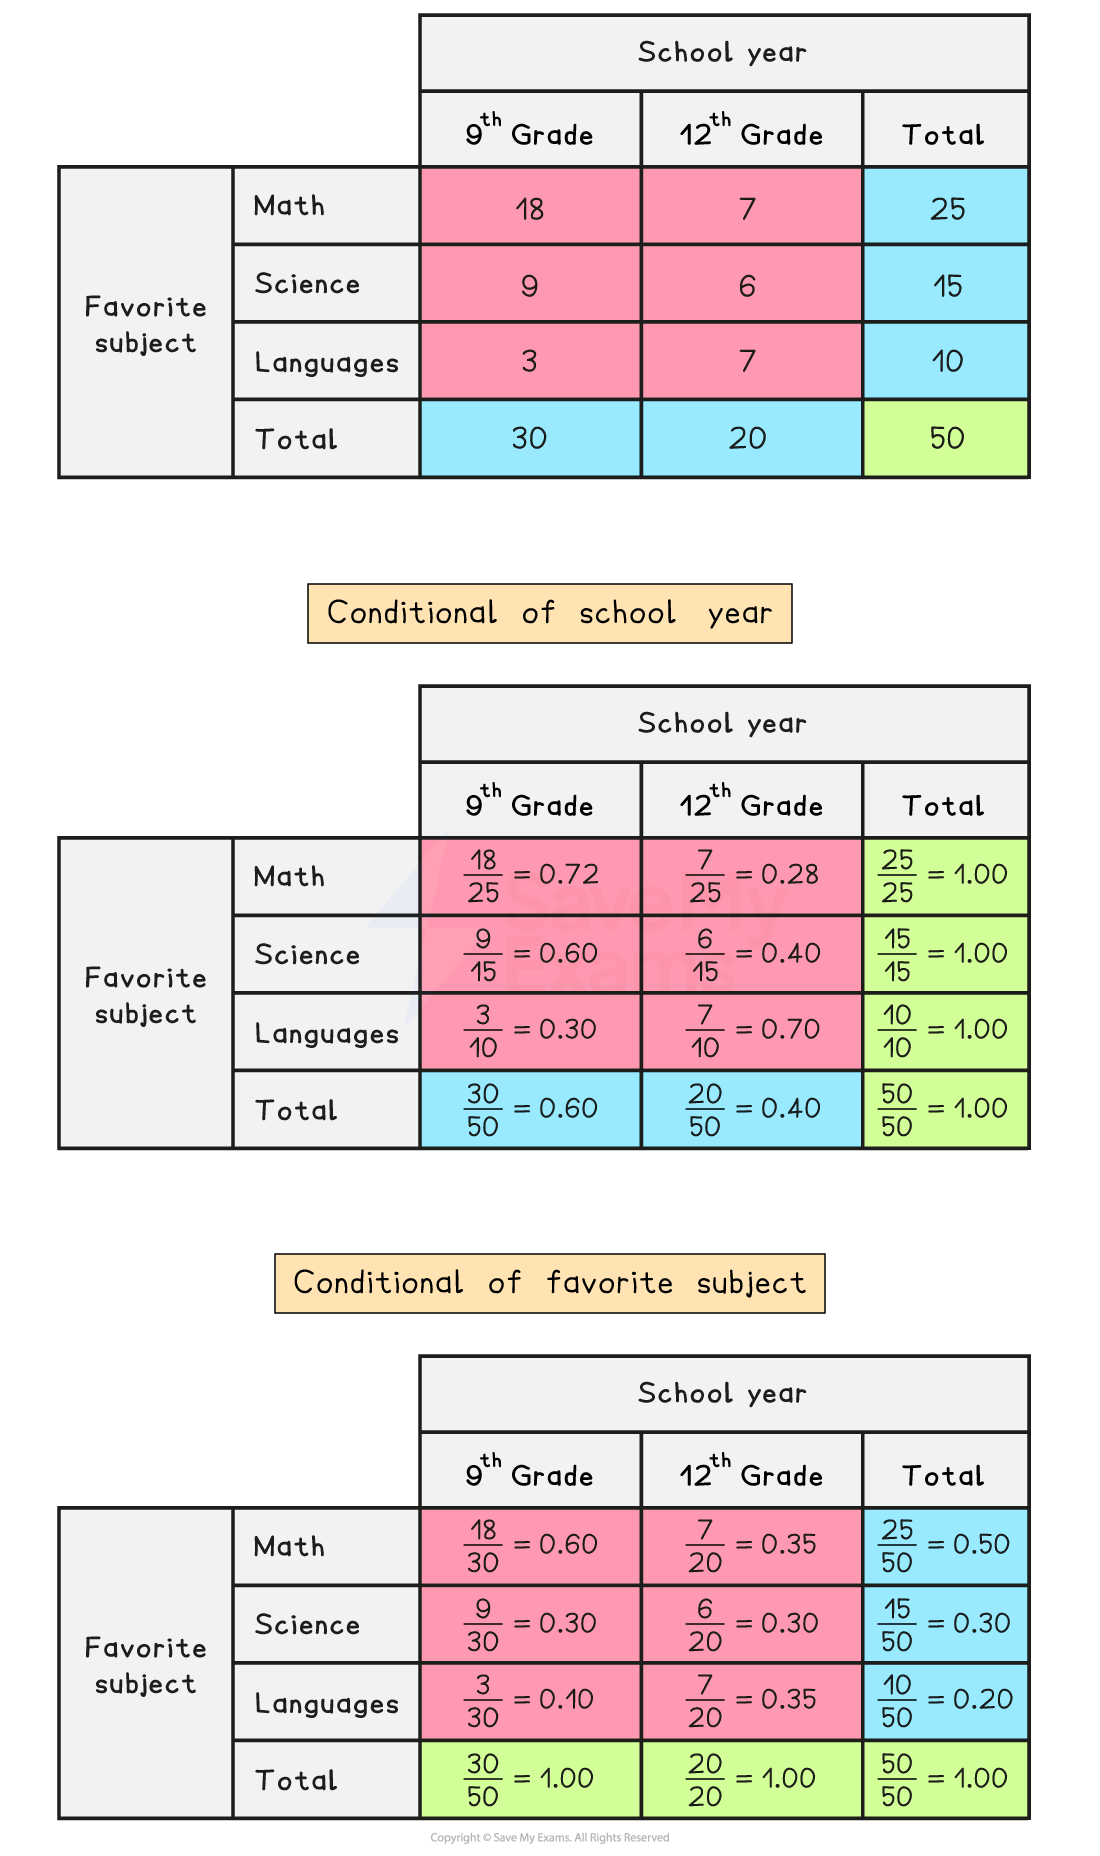
A conditional relative frequency is the proportion of the total of a row or column that belongs to that cell
e.g. the proportion of students in the 9th grade who say math is their favorite subject is a conditional relative frequency
To calculate a conditional relative frequency
divide the joint (cell) frequency by the relevant marginal frequency
e.g. divide the number of students in the 9th grade who say math is their favorite subject by the total number of students in the 9th grade
If a two-way table is used to display conditional relative frequencies which are conditional of the row variable
then the conditional relative frequencies in each row will add up to 1
If a two-way table is used to display conditional relative frequencies which are conditional of the column variable
then the conditional relative frequencies in each column will add up to 1
Worked Example
A university administration is evaluating a proposed change to campus parking fees. To understand how students commute, researchers selected a random sample of 400 students. Each student was asked to identify their housing status (On-Campus or Off-Campus) and their primary mode of transportation to campus (Drive, Public Transit, or Walk/Bike). The responses are summarized in the two-way frequency table below.
Drive | Public Transit | Walk/Bike | Total | |
|---|---|---|---|---|
On-Campus | 20 | 40 | 90 | 150 |
Off-Campus | 130 | 90 | 30 | 250 |
Total | 150 | 130 | 120 | 400 |
(a) Calculate the marginal relative frequency of students in the sample who primarily use public transit.
(b) Calculate the joint relative frequency of students in the sample who live off-campus AND primarily drive to campus.
(c) Calculate the conditional relative frequency of students who primarily walk or bike to campus among those who live on-campus. Then, calculate the conditional relative frequency of students who primarily walk or bike to campus among those who live off-campus.
(d) Based on the relative frequencies calculated in Part C, does there appear to be an association between housing status and primary mode of transportation for the students in this sample? Justify your answer.
Answer:
(a)
A marginal relative frequency is the row or column total divided by the table total
The marginal relative frequency of students who primarily use public transit is the total number of public transit users divided by the total number of students:
32.5% of students in the sample primarily use public transit
(b)
A joint relative frequency is a specific cell frequency divided by the total for the entire table
The joint relative frequency of students who live off-campus and drive is the number of students in that specific intersecting cell divided by the total number of students:
32.5% of students in the sample live off-campus AND primarily drive to campus
(c)
A conditional relative frequency restricts the denominator to a particular row or column category of interest
The conditional relative frequency of walking/biking given the student lives on-campus is:
60% of students who live on-campus walk or bike to campus
The conditional relative frequency of walking/biking given the student lives off-campus is:
12% of students who live off-campus walk or bike to campus
(d)
Yes, there appears to be an association between housing status and primary mode of transportation
If the two variables were not associated (independent), the conditional relative frequencies of walking/biking would be approximately equal for both housing groups
However, a much greater proportion of on-campus students walk or bike (60%) compared to off-campus students (12%)

Unlock more, it's free!
Join the 100,000+ Students that ❤️ Save My Exams
the (exam) results speak for themselves:

Was this revision note helpful?
Build on this topic