Impulse on a Force-Time Graph (OCR AS Physics): Revision Note
Exam code: H156

Impulse on a Force-Time Graph
In real life, forces are often not constant and will vary over time
If the force is plotted against time, the impulse is equal to the area under the force-time graph
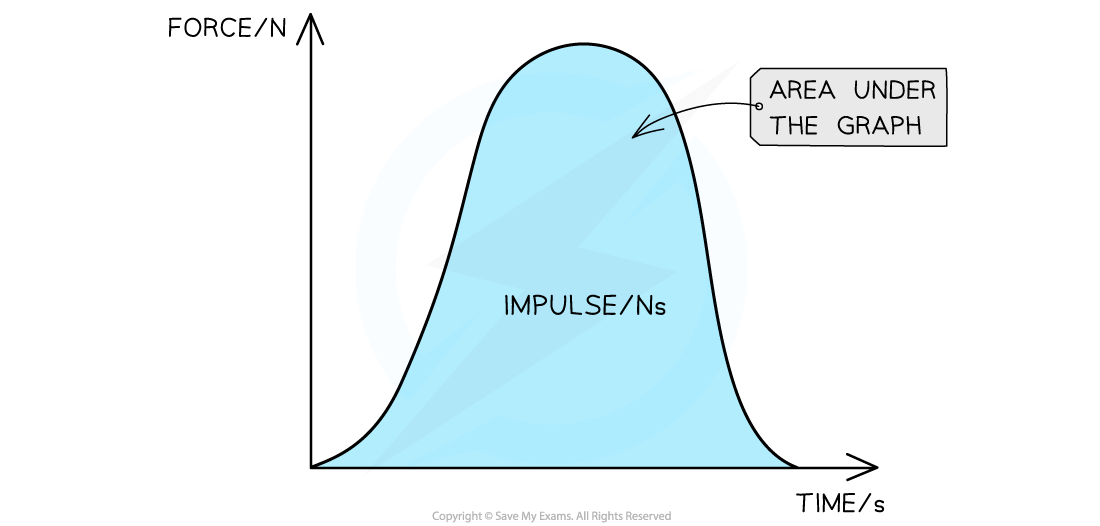
When the force is not constant, the impulse is the area under a force–time graph
This is because
Impulse = FΔt
Where:
F = force (N)
Δt = change in time (s)
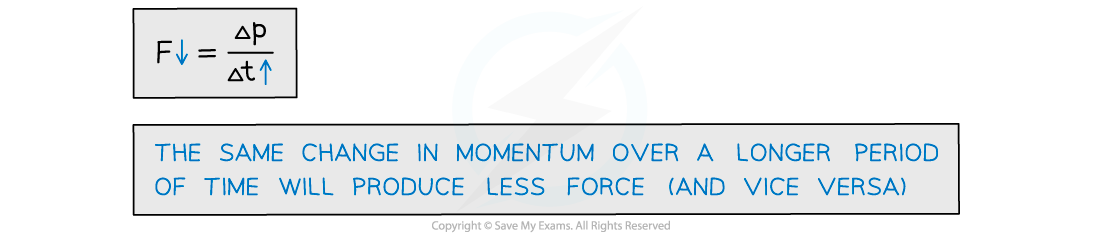
The impulse is therefore equal whether there is
A small force over a long period of time
A large force over a small period of time
The force-time graph may be a curve or a straight line
If the graph is a curve, the area can be found by counting the squares underneath
If the graph is made up of straight lines, split the graph into sections. The total area is the sum of the areas of each section
Worked Example
A ball of mass 3.0 kg, initially at rest, is acted on by a force F which varies with t as shown by the graph.

Calculate the velocity of the ball after 16 s.
Answer:
Step 1: List the known quantities
Mass, m = 3.0 kg
Initial velocity, u = 0 m s-1 (since it is initially at rest)
Step 2: Calculate the impulse
The impulse is the area under the graph
The graph can be split up into two right-angled triangles with a base of 8 s and a height of 4 kN

Area = Impulse = 32 × 103 N s
Step 3: Write the equation for impulse
Impulse, I = Δp = m(v – u)
Step 4: Substitute in the values
I = mv
32 × 103 = 3.0 × v
v = (32 × 103) ÷ 3.0
v = 10666 m s–1 = 11 km s-1
Examiner Tips and Tricks
Some maths tips for this section: Rate of Change
‘Rate of change’ describes how one variable changes with respect to another
In maths, how fast something changes with time is represented as dividing by Δt (e.g. acceleration is the rate of change in velocity)
More specifically, Δt is used for finite and quantifiable changes such as the difference in time between two events
Areas
The area under a graph may be split up into different shapes, so make sure you’re comfortable with calculating the area of squares, rectangles, right-angled triangles and trapeziums!

Unlock more, it's free!
Join the 100,000+ Students that ❤️ Save My Exams
the (exam) results speak for themselves:

Was this revision note helpful?
Build on this topic