Stress-Strain Graphs (OCR AS Physics): Revision Note
Exam code: H156

Stress-Strain Graphs
Stress-strain curves give an indication of the properties of materials such as
Whether they are brittle, ductile or polymeric
Up to what stress and strain they obey Hooke's Law
Whether they exhibit elastic and/or plastic behaviour
The value of their Young Modulus
Each material has a unique stress-strain curve
Brittle
A brittle material is defined asA material that fractures before plastic
deformation
For a brittle material:
Elastic behaviour is shown until the breakpoint where the material snaps
There is no plastic deformation, and the loading and unloading curves are the same
Brittle materials include: glass, ceramic
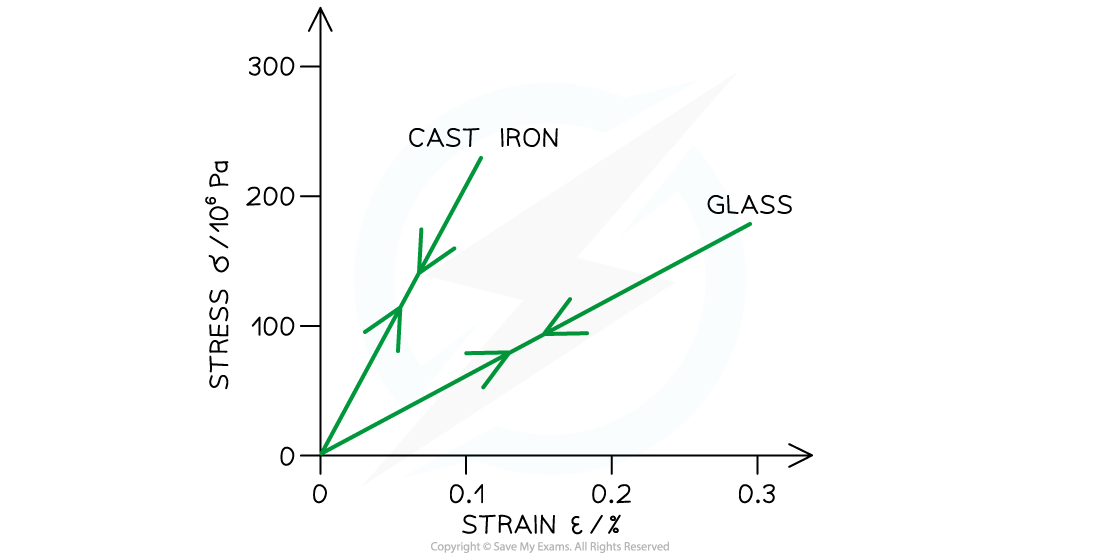
The stress-strain graph for a brittle material
Ductile
A ductile material is defined as
A material that can withstand large plastic deformation without breaking
For a ductile material:
They generally experience elastic deformation up until their elastic limit
After this, they then undergo plastic deformation before reaching their ultimate tensile stress and breakpoint
For this reason, they can be easily hammered into thin sheets or drawn into long wires
Ductile materials include: copper
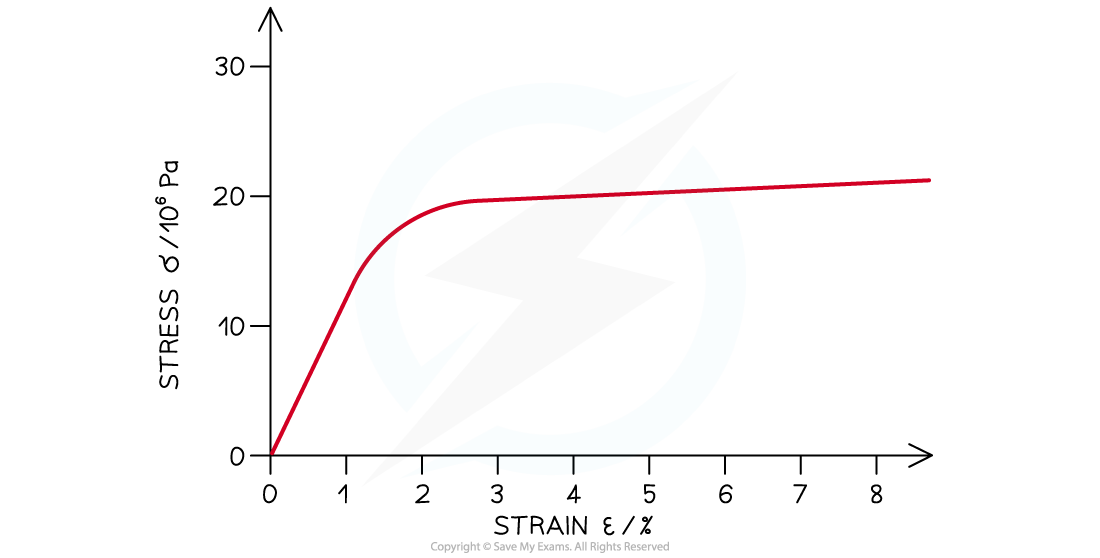
The stress-strain graph for a ductile material
Polymeric
A polymeric material is defined as:
A material made up of long, repeating chains of molecules
For a polymeric material:
They can endure a lot of tensile stress before breaking
There is no plastic deformation, but the unloading curve is different to the loading curve, as some energy has been lost as thermal energy
Polymeric materials include: rubber, polythene

The stress-strain graph for a polymeric material
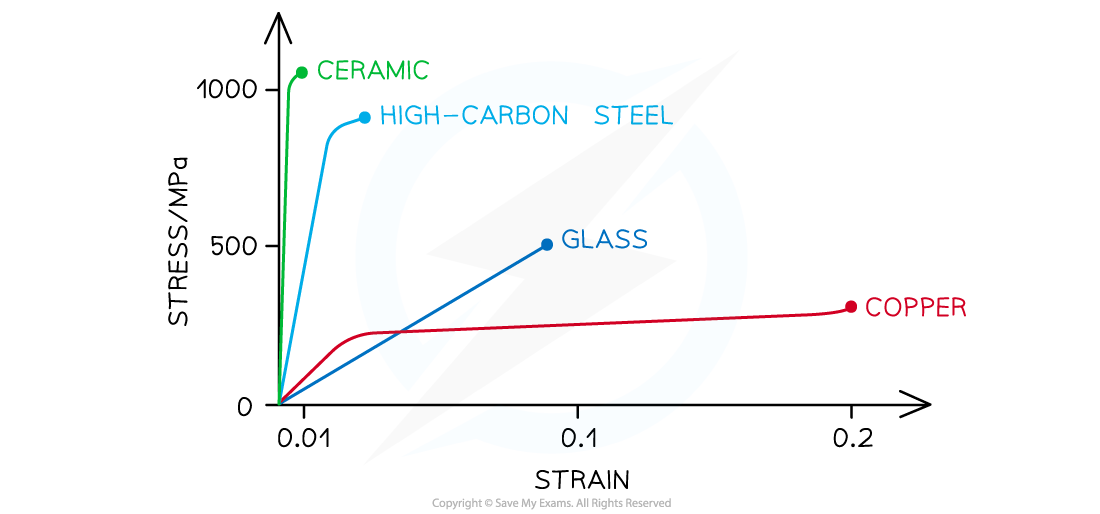
Stress-strain graph for different materials up to their breaking stress
There are important points on the stress-strain graph, some are similar to the force-extension graph
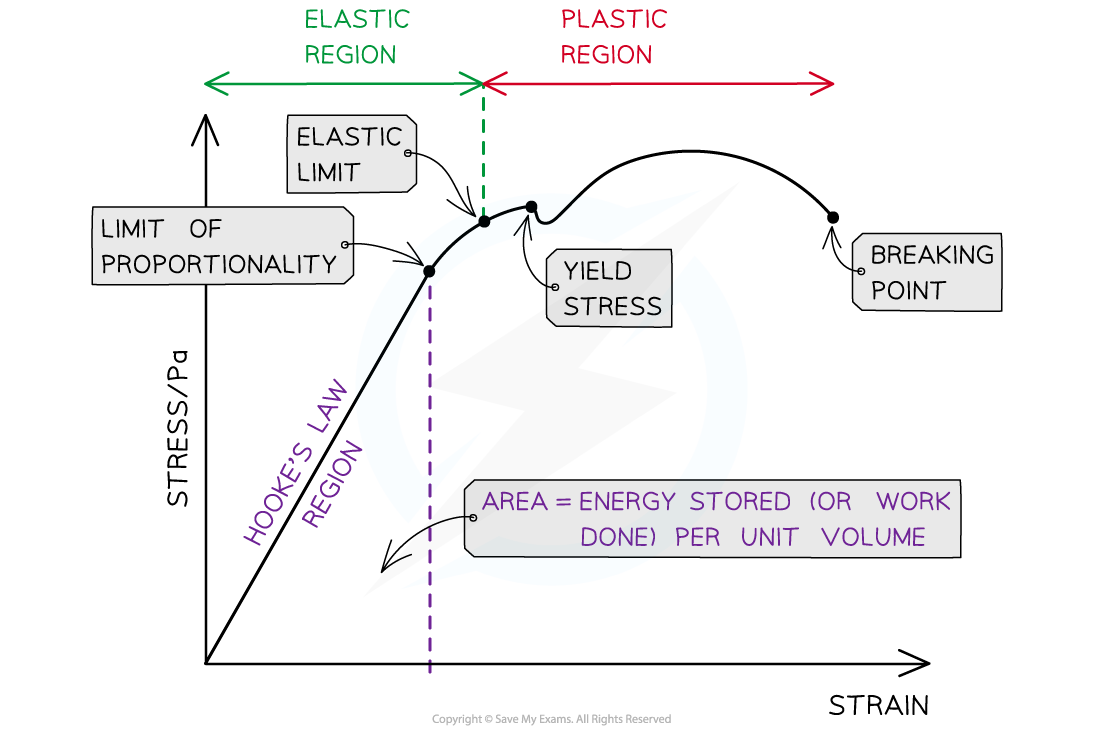
The important points shown on a stress-strain graph
The key points that are unique to the stress-strain graph are:
The elastic strain energy stored per unit volume is the area under the Hooke's Law (straight line) region of the graph
Yield Stress:
The force per unit area at which the material extends plastically for a small increase in stress
Breaking point:
The stress at this point is the breaking stress
This is the maximum stress a material can stand before it fractures
Elastic region:
The region of the graph up until the elastic limit
In this region, the material will return to its original shape when the applied force is removed
Plastic region:
The region of the graph after the elastic limit
In this region, the material has deformed permanently and will not return to its original shape when the applied force is removed
Worked Example
The graph below shows a stress-strain curve for a copper wire.
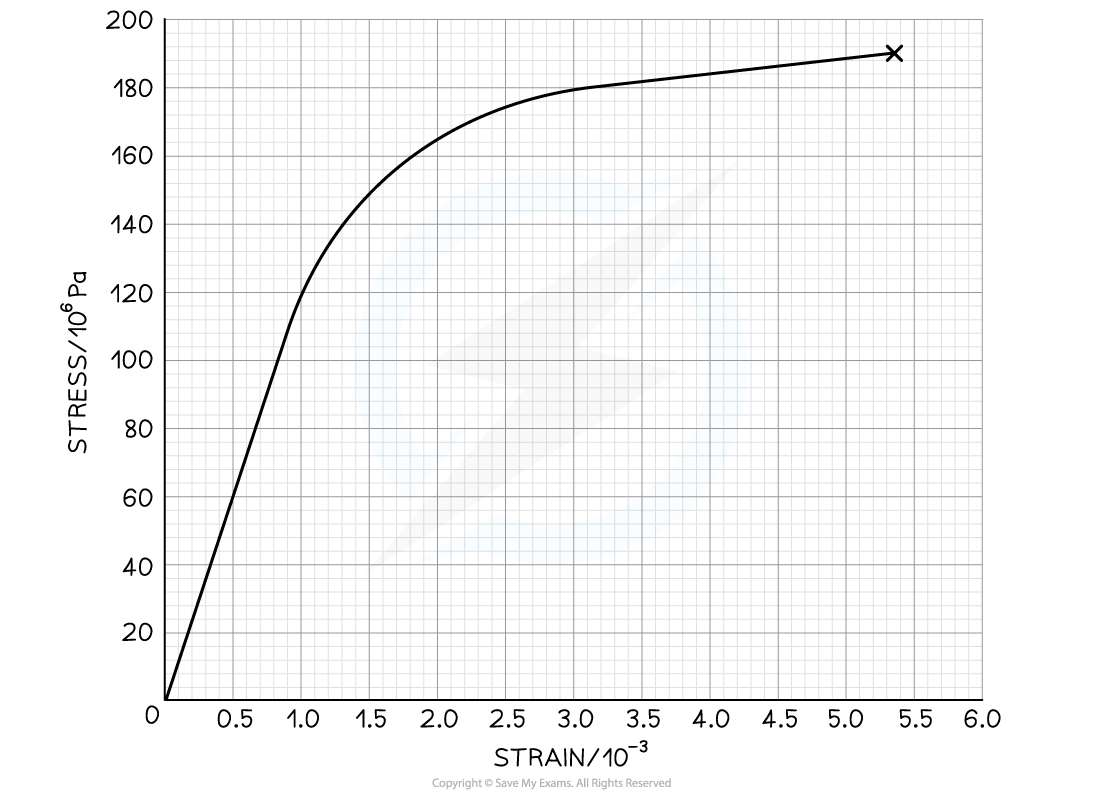
From the graph, state the value of:
(a) The breaking stress
(b) The stress at which plastic deformation begins
Answer:
Part (a)
Step 1: Define breaking stress
The breaking stress is the maximum stress a material can stand before it fractures. This is the stress at the final point on the graph
Step 2: Determine breaking stress from the graph
Draw a line to the y axis at the point of fracture
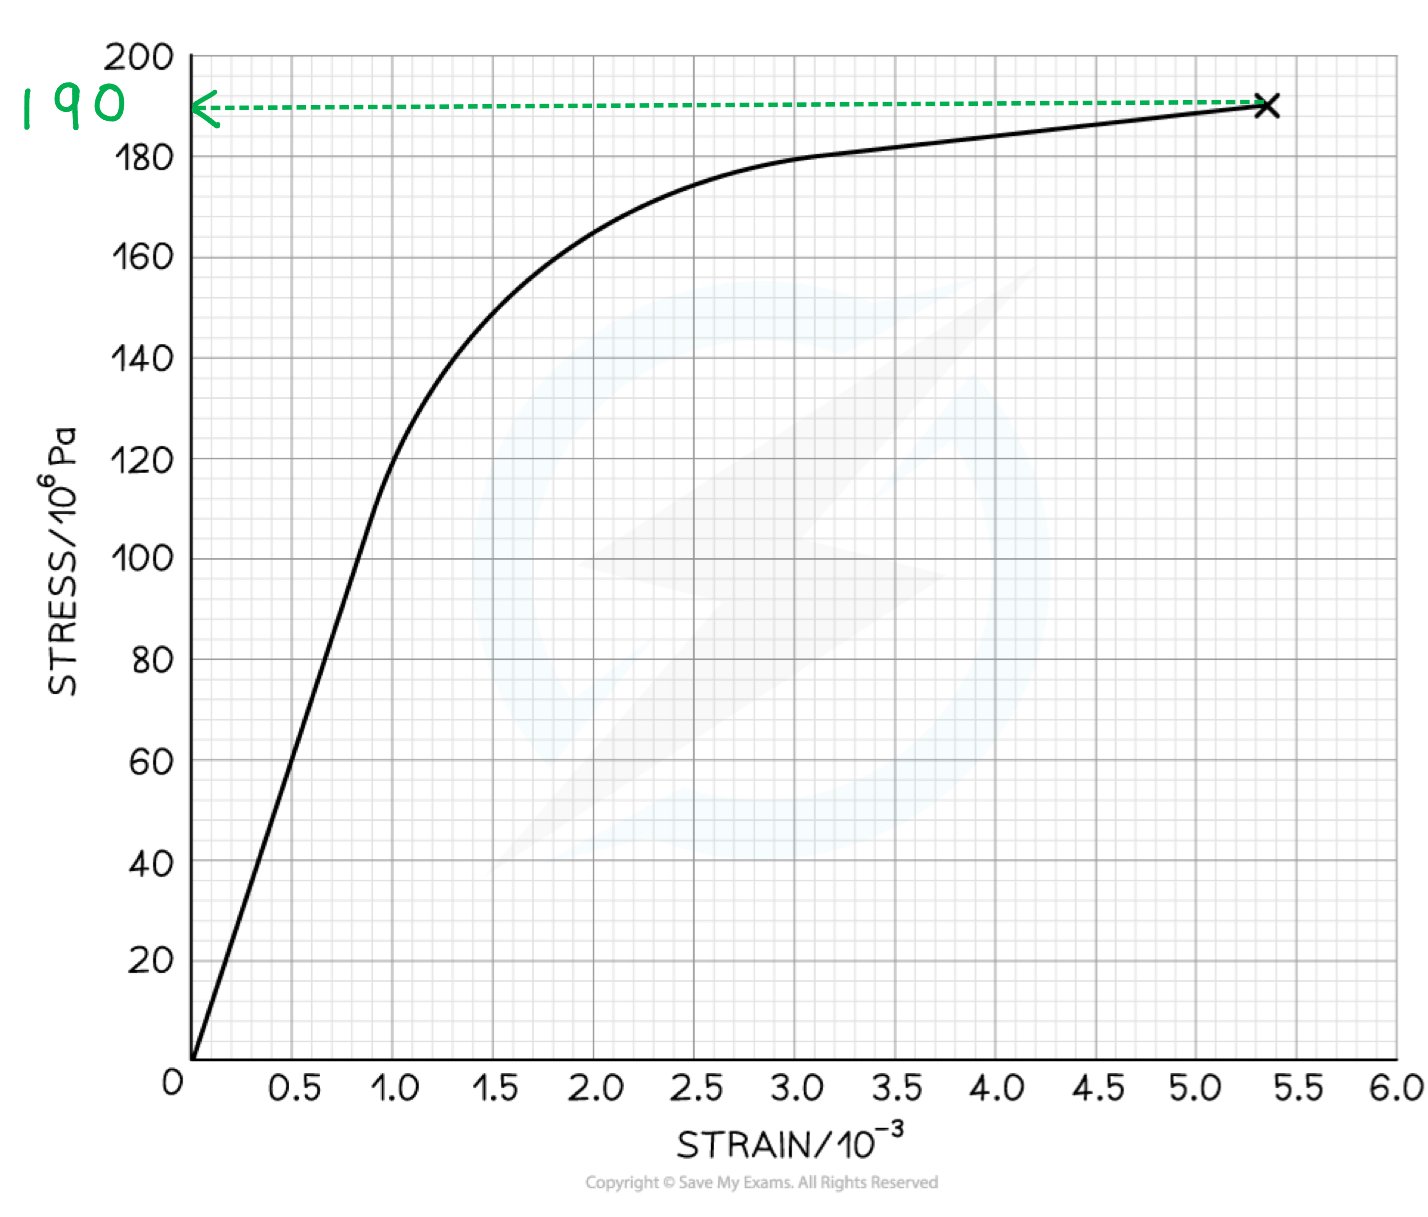
The breaking stress is 190 MPa
Part (b)
Step 1: Define plastic deformation
Plastic deformation is when the material is deformed permanently and will not return to its original shape once the applied force is removed
This is shown on the graph where it is curved
Step 2: Determine the stress of where plastic deformation beings on the graph
Draw a line to the y axis at the point where the graph starts to curve
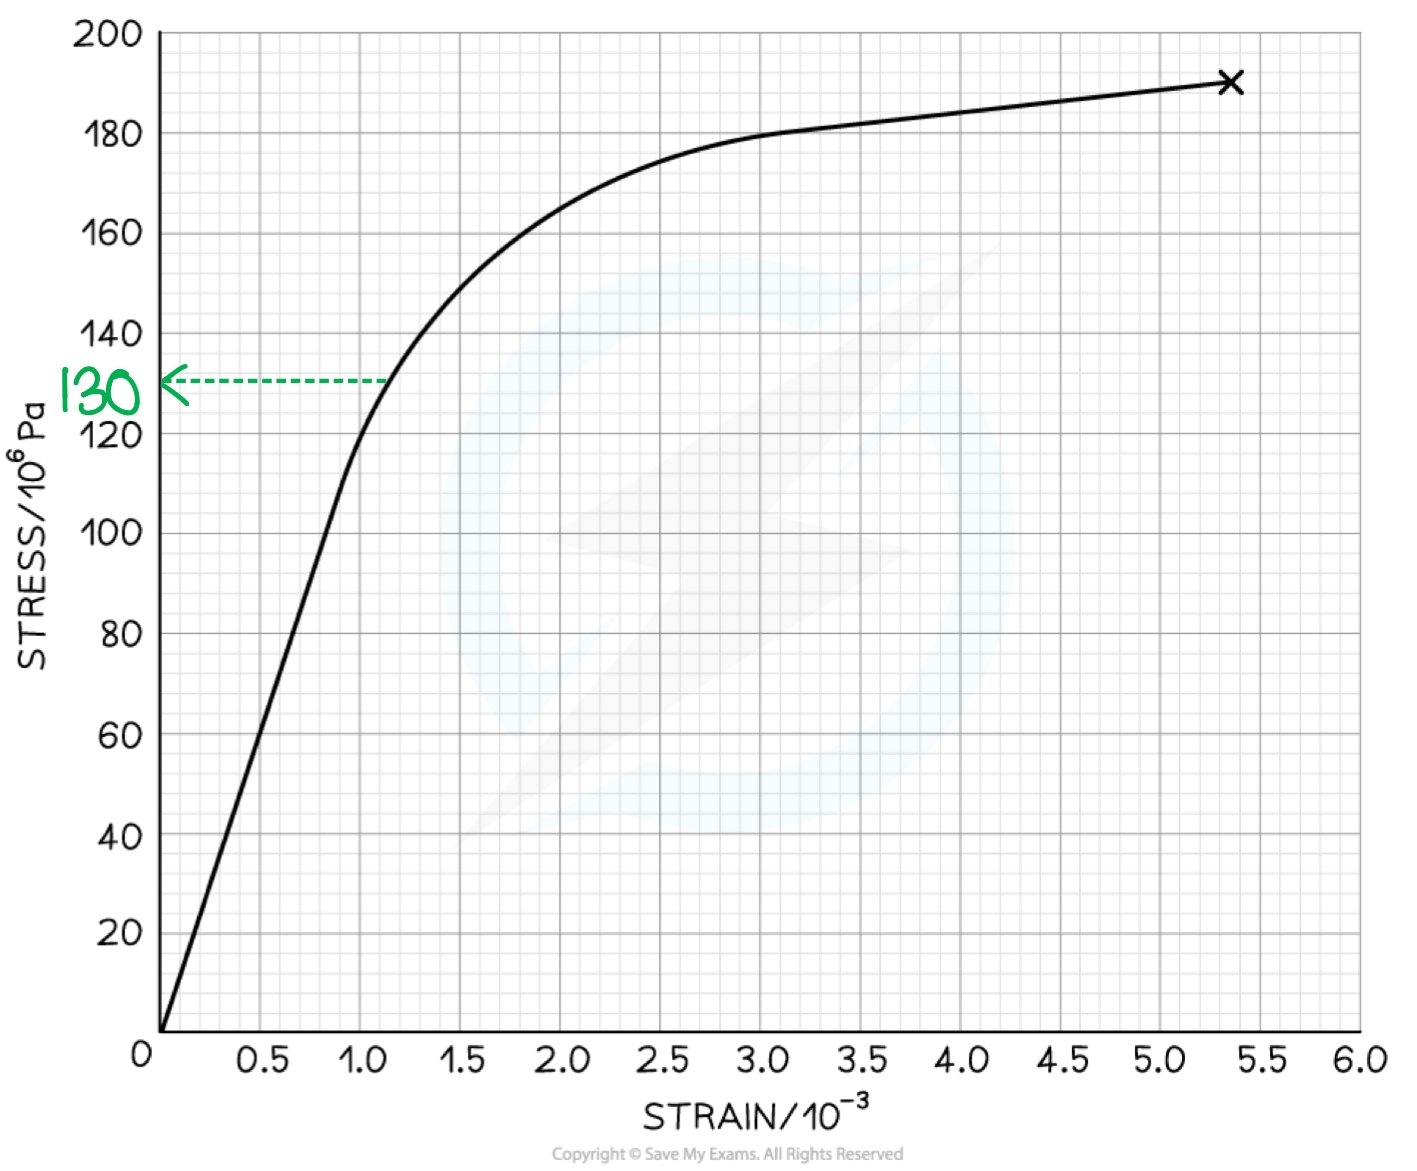
Plastic deformation begins at a stress of 130 MPa

Unlock more, it's free!
Join the 100,000+ Students that ❤️ Save My Exams
the (exam) results speak for themselves:

Was this revision note helpful?
Build on this topic