Analysing Quantitative Data (OCR AS Physics): Revision Note
Exam code: H156

Analysing Quantitative Data
Maths is very important throughout the whole of physics
In particular, maths skills are required when dealing with data from experiments
The mathematical skills required for the analysis of quantitative data include:
Using standard form
Quoting to an appropriate number of significant figures
Calculating mean values
Graph skills
Using Standard Form
Often, physical quantities will be presented in standard form
This makes it easier to present numbers that are very large or very small without having to repeat many zeros
For example, the speed of light in a vacuum equal to 3.00 × 10⁸ m s−1
It will also be necessary to know the prefixes for the numbers of ten
Using Significant Figures
Calculations must be reported to an appropriate number of significant figures
Also, all the data in a column should be quoted to the same number of significant figures
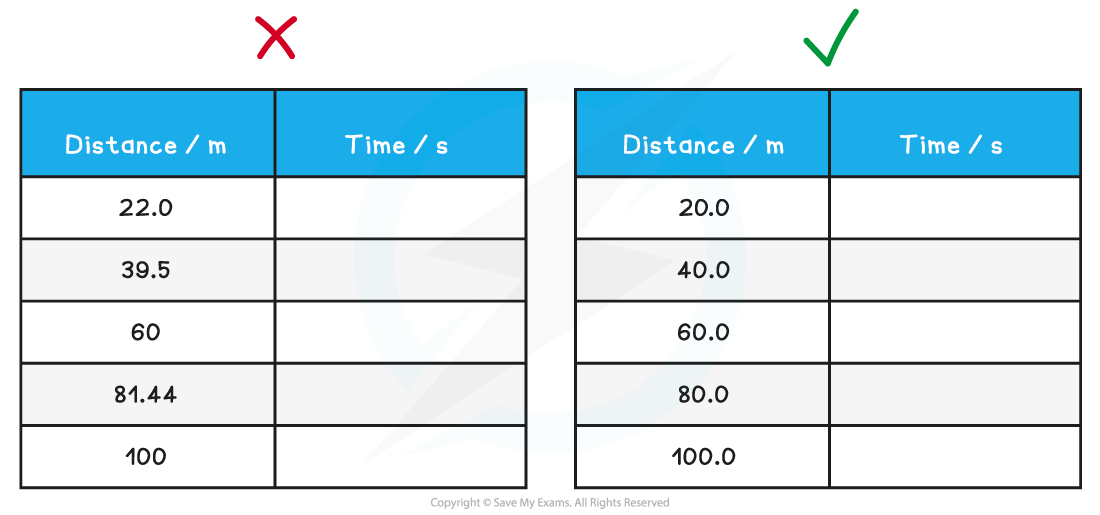
It is important that the significant figures are consistent in data
Calculating Mean Values
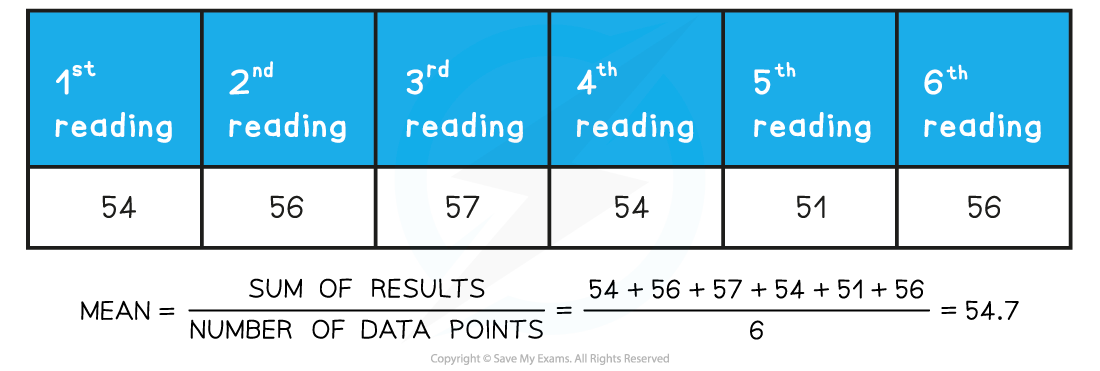
When several repeat readings are made, it will be necessary to calculate a mean value
When calculating the mean value of measurements, it is acceptable to increase the number of significant figures by 1
Graph Skills
In several experiments during A-Level Physics, the aim is generally to find if there is a relationship between two variables
This can be done by translating information between graphical, numerical, and algebraic forms
For example, plotting a graph from data of displacement and time, and calculating the rate of change (instantaneous velocity) from the tangent to the curve at any point
Graph skills that will be expected during A-Level include:
Understanding that if a relationship obeys the equation of a straight-line y = mx + c then the gradient and the y-intercept will provide values that can be analysed to draw conclusions
Finding the area under a graph, including estimating the area under graphs that are not linear
Using and interpreting logarithmic plots
Drawing tangents and calculating the gradient of these
Calculating the gradient of a straight-line graph
Understanding where asymptotes may be required

Unlock more, it's free!
Join the 100,000+ Students that ❤️ Save My Exams
the (exam) results speak for themselves:

Was this revision note helpful?
Build on this topic