Useful Production Metrics (DP IB Business Management: HL): Revision Note

Capacity utilisation
Capacity utilisation measures how effectively a business uses its assets to produce output
It compares current output to the maximum possible output a business can produce using all of its assets
Capacity utilisation is calculated using the following formula and expressed as a percentage
Worked Example
Bäkkerei Lola produces specialist Indian and Bangladeshi breads which are sold to restaurants in the Munich area. Batch production is used in the factory to manufacture the range of breads and the factory can produce a maximum of 68,400 units per month. In May factory output was 51,420 units
Calculate Bäkkerei Lola's capacity utilisation in May [2 marks]
Step 1 - Divide the current output by the maximum output
(1 mark)
Step 2 - Multiple the outcome by 100 to obtain the percentage capacity utilisation
(1 mark)
Examiner Tips and Tricks
In your exam, you may need to rearrange the capacity utilisation formula. You may be given the percentage of capacity utilisation and have to calculate the volume of output.
Implications of under- and over-capacity utilisation
Under-utilisation
Low capacity utilisation means resources are being under-used
This is likely to increase unit costs because fixed costs are spread over fewer units of output
Workers are under-deployed leading to fears of redundancy
Operating under capacity provides flexibility
Workers are freed up to complete maintenance tasks
The business can respond to sudden increases in demand
Over-utilisation
High capacity utilisation may mean flexibility to respond to new orders is lost
Staff are under pressure to increase output
Overworked staff may leave increasing staff turnover
Machinery operates at its limit and is more prone to breakdowns which disrupts production
High capacity utilisation minimises unit costs and increases competitiveness
Busy workers feel secure in their employment
A busy business is likely to be well thought-of and attract customers who are willing to wait for delivery of products
Worked Example
Production Data for Pencil Manufacturers A and B
Manufacturer | Capacity Utilisation |
|---|---|
A | 55% |
B | 80% |
Explain one implication of the level of capacity utilisation for pencil manufacturer A, compared to manufacturer B. [2 marks]
Step 1 - Identify an implication
One implication is that manufacturer A's unit costs are likely to be higher than those of manufacturer B (1 mark)
Step 2: Develop the point with a reason
because resources such as workers and machinery are not being used to their full potential (1 mark)
Defect rate
The defect rate is the proportion of output that is judged to be substandard in a given time period
It is expressed as a percentage and calculated using the formula
Worked Example
HomeFlex manufactures high-strength universal charging cables for mobile phones. In 2022 it manufactured and tested 14,220 cables of which 213 were found to be defective
Calculate Homeflex's defect rate in 2022. [2 marks]
Step 1: Divide the number of defects by the total output
(1 mark)
Step 2: Multiply the outcome by 100 and express as a percentage
(1 mark)
Sometimes it is not feasible to quality check every item of output
In these cases the defect rate is expressed as a percentage and is calculated using the formula
Reasons to reduce the defect rate
Businesses take steps to reduce the defect rate for several reasons
Avoid loss of revenue as faulty products can rarely be sold
Customers will likely complain about substandard products which causes dissatisfaction and impacts business reputation
Unsafe products may harm customers and could lead to legal issues/prosecution
Defective products are often returned and require refunds, processing and disposal
Examiner Tips and Tricks
The defect rate is likely to be much lower when businesses adopt a system of quality assurance, especially Total Quality Management (TQM)
However these approaches usually require a whole-business commitment to quality which may not be easy - or quick - to achieve
Businesses may therefore be willing to operate with a determined level of defects in order to avoid the upheaval and expense of moving to quality assurance
Measuring productivity
Productivity is the output per input (person or machine) per hour
For example, an Ikea worker is able to produce 2 Poāng chairs per hour
Labour productivity measures output per worker during a specified period of time
It is expressed as a number of units and calculated using the formula
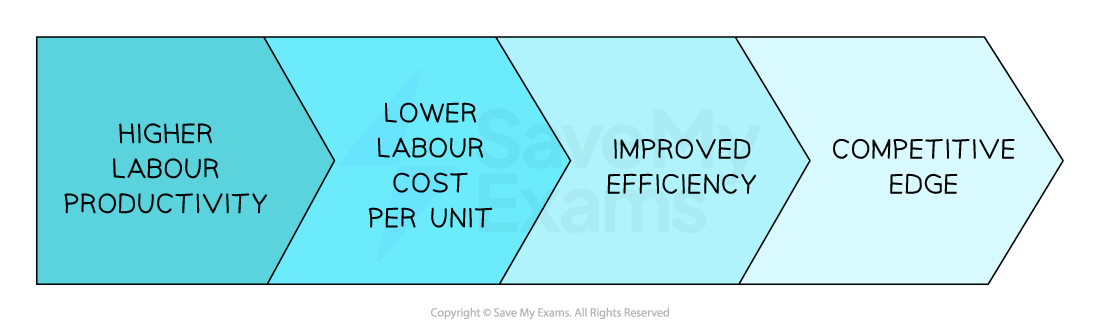
Businesses aim to increase the level of labour productivity to improve competitiveness
The link between high labour productivity and competitive edge
Worked Example
The table shows the number of pairs of luxury wool socks produced by Sokkemani in 2021 and 2022
Year | Units Produced |
|---|---|
2021 | 46,000 |
2022 | 69,000 |
In 2021 Sokkemani employed 50 staff. In 2022 the number of staff employed by the business increased by 20%
Calculate the percentage change in labour productivity between 2021 and 2022.
[4]
Step 1 - Calculate the labour productivity for 2021
(1 mark)
Step 2 - Calculate the labour productivity for 2022
(1 mark)
Step 3 - Calculate the percentage difference between the two years ((new-old) / old)
(1 mark)
Step 4 - Identify whether the percentage difference is an increase or decrease
Labour productivity has increased by 25% (1 mark)
Capital productivity measures of the output of capital employed (e.g. machinery) during a specified period of time
Capital productivity is expressed as a number of units and is calculated using the formula
Businesses aim to maximise capital productivity as expenditure on machines is likely to be high
Ways to minimise lost production time due to breakdowns
Upgrading and recalibrating machinery
Regular servicing and maintenance
Training workers using machinery
Use good-quality raw materials and components
Worked Example
Ferramenta forecasts that by the end of the year it will produce 250,800 units and that capital productivity will be 1,100 units per machine
Calculate the number of machines Ferramenta has in use.
[2]
Step 1 - Divide the output by the capital productivity
(1 mark)
(1 mark)
Factors that determine productivity
Rivalry is an incentive for managers and workers to increase productivity
Investments in technology such as ICT improves worker productivity by allowing flexible working and higher quality output
Innovations such as online scheduling software give employees tools to make their tasks more efficient
Workers' skills and experience is improved by careful recruitment and ongoing training
Business owners' or managers' attitude towards risk determines the steps taken to improve productivity
Cost to buy (CTB) and cost to make (CTM)
Make or buy decisions occur when a business has to choose between manufacturing a product itself or purchasing it from an external supplier
The business compares the cost to buy and the cost to make
The Cost to Buy (CTB) is expressed as a monetary value and calculated using the formula
The Cost to Make (CTM) is expressed as a monetary value and calculated using the formula
Worked Example
Orosi Valley Farm has decided to sell free range eggs in its popular shop. It could introduce chickens to the farm and sell the eggs they produce. Alternatively it could source eggs from a neighbouring farm. It expects to sell around 5,000 eggs per week.
Costs associated with each option are shown in the table below
| Purchase eggs from neighbouring farm | Source eggs from own chickens |
|---|---|---|
Average cost per egg | 7.2 pence | 6.4 pence |
Delivery cost | £5 per 1000 | N/A |
Fixed costs | N/A | £60 per week |
Recommend whether Orosi Valley Farm should make or buy eggs to sell in its shop. You are advised to show your calculations.
[5]
Step 1: Calculate the cost to buy the eggs
(1 mark)
(1 mark)
Step 2: Calculate the cost to make the eggs
(1 mark)
(1 mark)
Step 3: Make a recommendation
Orosi Valley Farm should make the eggs, as the cost to make is lower than the cost to buy. (1 mark)
Make or buy decisions
Comparison of the cost to buy and cost to make determines a businesses choice
If the cost to buy is greater than the cost to make production should be kept in-house
If the cost to make is greater than the cost to buy production should be outsourced
A range of non-financial factors may be considered
This is particularly important if a potential supplier is being used for the first time
Qualitative factors in make or buy decisions
Capacity | Quality |
|---|---|
|
|
Reliability | Core competency |
|
|
Examiner Tips and Tricks
When considering make or buy decisions, you must weigh up both the quantitative factors (calculations) and qualitative factors
Look for clues in the case study that can support your qualitative points and ensure that your decision is holistic - in other words, consider all of the evidence!

Unlock more, it's free!
Join the 100,000+ Students that ❤️ Save My Exams
the (exam) results speak for themselves:

Was this revision note helpful?
Build on this topic