Data for Fitness Testing (OCR GCSE Physical Education (PE)): Revision Note

Exam code: J587

Emma Mulhern

Written by: Emma Mulhern

Reviewed by: Ruth Brindle

Updated on

How data is collected for fitness testing

  • Fitness test scores are typically measured and recorded using specific units

  • This is known as quantitative data

    • involves numerical measurements or counts obtained

      • This includes objective data such as time taken to complete a task, distance covered, number of repetitions or level achieved in a test

Comparing Quantitative Data to National Averages:

  • All the fitness tests provide quantitative data which can be compared to normative scores

    • These are indicators of how the participant has performed in comparison to the general population

  • This comparison allows performers to:

    • Assess performance: Evaluate an individual's performance relative to their peers or national standards

    • Identify strengths and weaknesses: Identify areas of strength and areas needing improvement based on benchmark data

    • Set goals: Establish realistic goals for improvement based on where an individual's performance falls in relation to national averages

  • Comparing fitness test scores to national averages provides valuable context and helps guide training programs

    • Participants can use the data collected in their fitness tests and evaluations to develop performance enhancement strategies and to set future goals

  • Elite athletes may find that normative comparisons are no longer relevant to their own progress as they are much beyond these levels

    • they will instead compare their fitness data to other athletes and specifically to their own previous fitness test performances

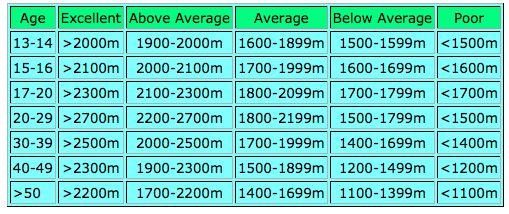
Example of Normative figures table for Cooper 12 minute run/walk test

Table categorising running distances by age: columns for "Age", "Excellent", "Above Average", "Average", "Below Average", and "Poor" performance.
Normative scores are indicators of how the participant has performed in comparison to the general population

Drawing conclusions to inform training requirements table

Name of test

Method of measurement

Drawing conclusions

Cooper 12 minute run/walk test

Distance in metres or kilometres

The quantitative score can provide a prediction of an individual’s VO2 max 

  • Further distance indicate better cardiovascular fitness

  • Participants walking or stopping during the time may require some aerobic conditioning to improve their endurance during sport

Multi-stage fitness test

Level and shuttle

The quantitative score can provide a prediction of an individual’s VO2 max 

  • Higher levels achieved indicate better cardiovascular fitness

  • Participants dropping out at a lower level may require some aerobic conditioning to improve their endurance during sport

Press-up test

Number of press-ups

  • A high number of press-ups completed within the allotted time indicates a high level of abdominal muscle endurance and strength

  • Strengthening exercises should be used to improve muscle endurance in those with low scores

Sit-up test

Number of sit-ups

  • A high number of sit-ups completed indicates a high level of abdominal muscle endurance

  • Strengthening exercises should be used to improve muscle endurance in those with low scores

30m sprint test

Time taken in seconds

  • A quicker time recorded reflects faster speed and acceleration

  • Participants with slower speeds and acceleration could integrate interval training or hill sprints into their training programme

Grip strength dynamometer test

Kg score on dynamometer

  • A higher reading on the dynamometer indicates greater forearm and hand strength

  • If a lower reading is achieved, individuals can integrate specific grip training exercises into their training programme

1 Repetition Maximum (RM)

Kg lifted once

  • The ability to lift a heavier weight in a specific lift indicates greater strength of the muscle groups involved

  • Participants can increase their one rep max through resistance training designed specifically to support the target muscle groups

Standing jump/Vertical jump Test

The observer records the quantitative score as the height jumped in cm. The score is compared to normative averages

  • A greater vertical height achieved demonstrates greater explosive power

  • Participants struggling to reach height during the jump would benefit from plyometric training to enhance explosive leg power

Sit and reach test

Centimetres (cm)

  • Better flexibility of the lower back and hamstrings is indicated by a greater distance reached on the measuring scale

  • Individuals with limited flexibility should integrate stretching routines into their training programme

Illinois agility test

Time taken in seconds

  • Recording a faster time for the completion of the course indicates better agility and speed of the participant

  • Slower recorded times would suggest that the participant may benefit from agility training to improve their speed and directional change

Stork stand test

The time held in seconds

  • The longer the duration of the hold indicates better balance and stability

  • Holds of a shorter duration might indicate that the participant would need to work on balance and proprioception

Wall throw test

Number of catches

  • A higher number of points indicates a higher level of coordination and a better reaction time

  • Slower reaction times and lower points due to dropping would suggest that the participant would benefit from drills to enhance hand-eye coordination and reflexes

Reaction time ruler test

Centimetres (cm)

  • A shorter distance measured on the ruler indicates faster reflexes and greater hand-eye coordination

  • A longer distance on the ruler indicates slower reaction times and would suggest that the participant would benefit from drills to enhance hand-eye coordination and reflexes

Worked Example

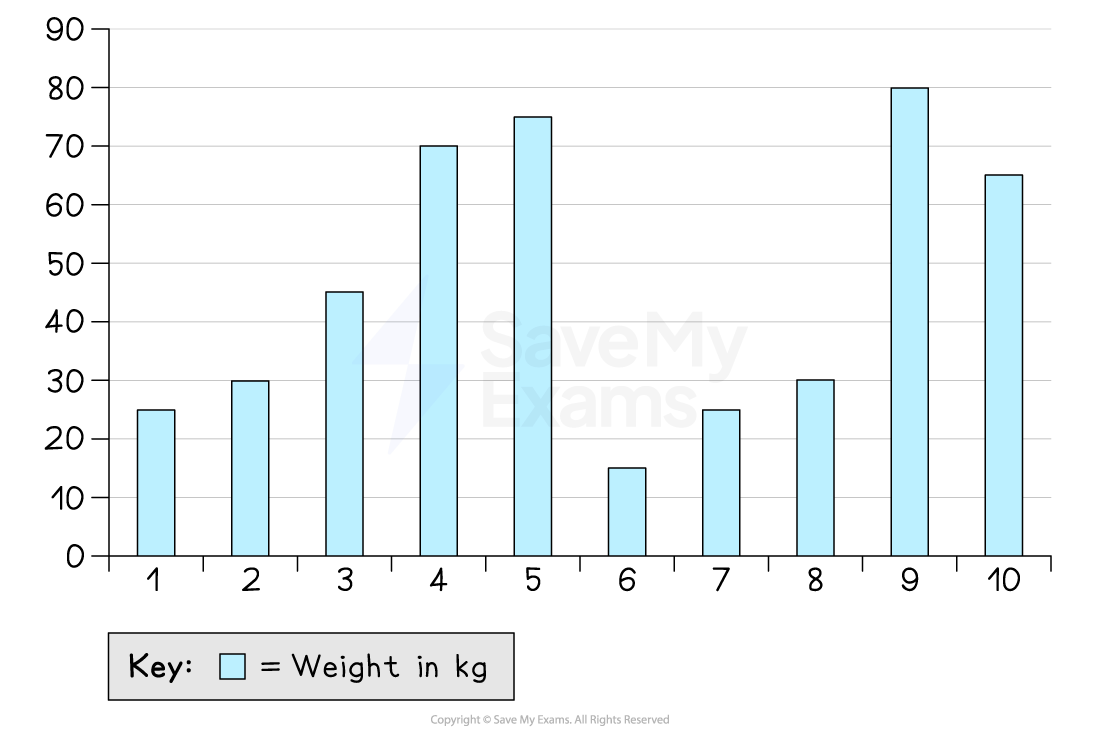
The data below show the results of 10 classmates who have completed a one rep max test.

Turn the data into a bar graph.

Classmate Number

1

25 kg

2

30 kg

3

45 kg

4

70 kg

5

75 kg

6

15 kg

7

25 kg

8

30 kg

9

80 kg

10

65 kg

Bar graph showing weights in kg from 1 to 10 on the x-axis, and 0 to 90 on the y-axis. Bars vary in height, with peaks at 4, 5, and 9.

Worked Example

Table 1 shows the results of the Stork stand balance test in participants of different ages.

Age

Balance time (seconds)

20-29

42

30-39

42

40-49

40

50-59

37

60-69

28

70-79

13

Describe the relationship between age and balance time (2 marks)

  • As age increases, balance time decreases (1 mark)

  • Between the ages of 20-39 there is no change in balance time (1 mark)

Unlock more, it's free!

Join the 100,000+ Students that ❤️ Save My Exams

the (exam) results speak for themselves:

Emma Mulhern

Author: Emma Mulhern

Expertise: Content Writer

Emma is currently Head of Physical Education at her school, with over 14 years’ experience in education, specialising in GCSE and A-level teaching across multiple exam boards. Alongside her teaching, she has worked as an examiner at both GCSE and A-level, giving her a detailed understanding of assessment criteria and what students need to succeed. This insight enables her to support students in mastering key content and exam technique, helping them maximise their potential and achieve outstanding results.

Ruth Brindle

Reviewer: Ruth Brindle

Expertise: Biology Content Creator

Ruth graduated from Sheffield University with a degree in Biology and went on to teach Science in London whilst also completing an MA in innovation in Education. With 10 years of teaching experience across the 3 key science disciplines, Ruth decided to set up a tutoring business to support students in her local area. Ruth has worked with several exam boards and loves to use her experience to produce educational materials which make the mark schemes accessible to all students.