Titration Curves (Edexcel International A Level (IAL) Chemistry): Revision Note
Exam code: YCH11

Titration Curves - Interpretation
During a titration a pH meter can be used and a pH curve plotted
A pH curve is a graph showing how the pH of a solution changes as the acid (or base) is added
The result is characteristically shaped graph which can yield useful information about how the particular acid and alkali react together with stoichiometric information

The features of a pH curve
All pH curves show an s-shape curve and the midpoint of the inflection is called the equivalence or stoichiometric point
From the curves you can
Determine the pH of the acid by looking where the curve starts on the y-axis
Find the pH at the equivalence point
Find volume of base at the equivalence point
Obtain the range of pH at the vertical section of the curve
Four types of acid-base titrations
There are four combinations of acids and alkalis that you should know about:
strong acid + strong base
weak acid + strong base
strong acid + weak base
weak acid + weak base
Strong acid + strong base
The curve starts at a low pH (about 1)
There is a very steep vertical section (about pH 3 to 11)
The equivalence point is at pH 7 (after 25.0 cm3 of base)
The curve ends at a high pH (about 13)
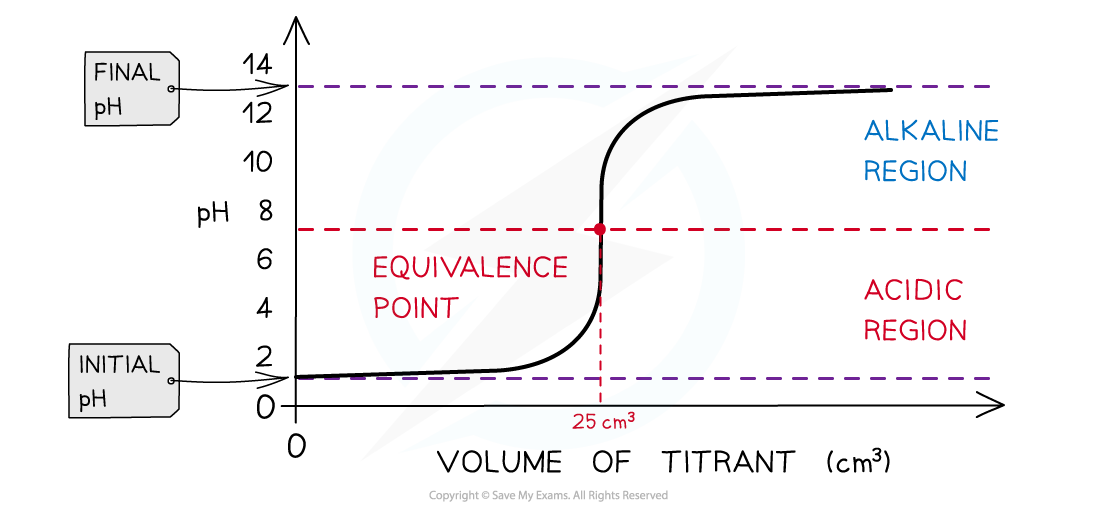
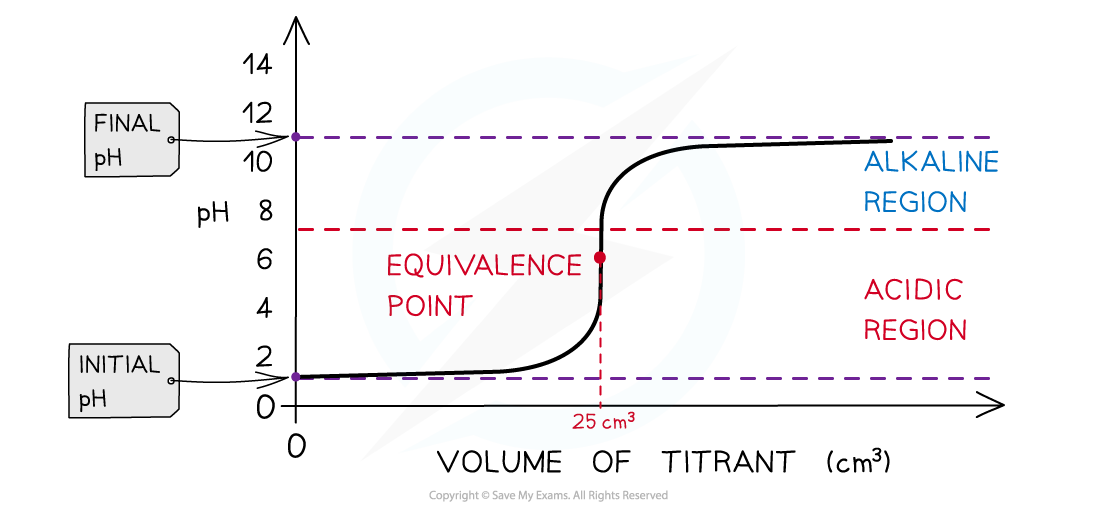
Strong acid + weak base
The curve starts at a low pH
The equivalence point is below pH 7 (after 25.0 cm3 of base)
The curve ends at a lower final pH than with a strong base
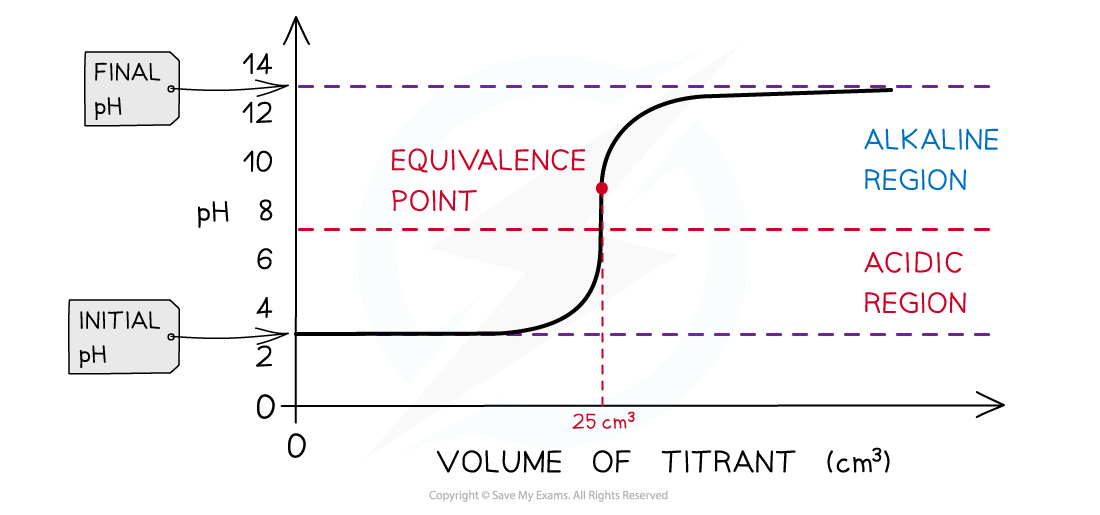
Weak acid + strong base
The curve starts at a higher pH than a strong acid
The buffer region is before the vertical section
The equivalence point is above pH 7
The curve ends at a high pH
Weak acid + weak base
The curve starts at a higher pH than a strong acid
It rises gradually with no steep vertical section
The curve ends at a lower final pH than with a strong base
There is no sharp end-point and no indicator is suitable
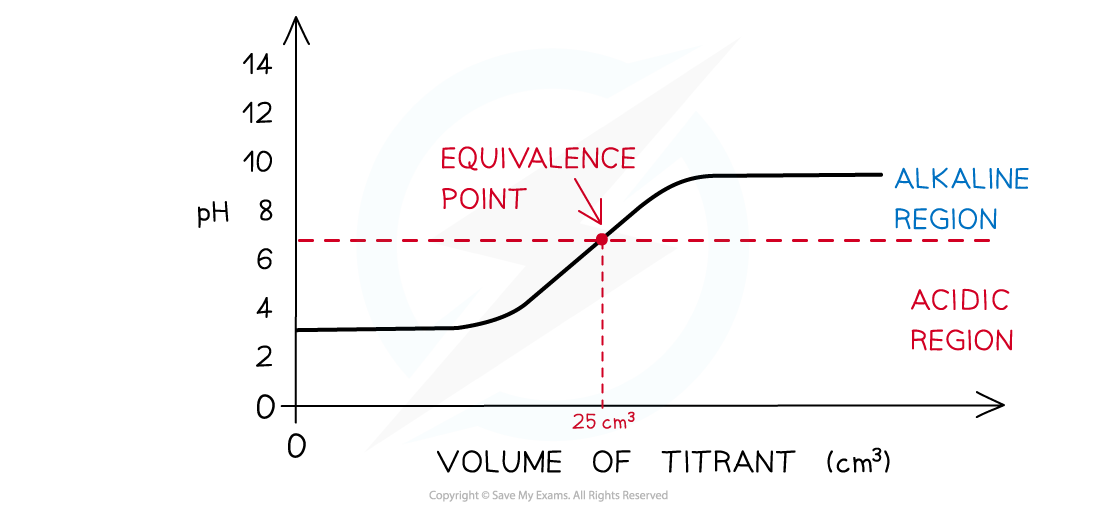
Without titles for the graph you can easily recognise which combination is shown by looking at the starting and ending pH and deducing whether the acid and alkali are strong or weak
Sometimes you may see pH titration curves which show pH plotted against volume of acid added
This produces the mirror image graph from which you can get all the same information

Comparing different versions of pH titration curves
Choosing an Indicator
Not all indicators are suitable for every type of titration
Indicators behave like weak acids and form an equilibrium between two coloured species:
HA(colour 1) H+ + A- (colour 2)
The equilibrium constant, Ka, for indicators, is known as KIn and is normally expressed in the logarithmic form, pKIn
The working pH range of an indicator is a range of pH on either side of the pKIn value
For example, the pKIn of methyl orange is 3.7
Below pH 3.7 the dominant colour is colour 1 (red for methyl orange) and above it is colour 2 (yellow for methyl orange)
The range of change for a weak acid-strong base titration is around pH 8-10
Using methyl orange for this titration won't work because the range of change is far too high
You would see the indicator changing to yellow before you reach the end-point
In this case, you need to use an indicator with a high pH range such as phenolphthalein
Examiner Tips and Tricks
The word base and alkali are being used interchangeably here, but you should know an alkali is a soluble base.Since we are dealing with titrations here, the bases are always in solution so they are also alkalis.
Titration Curves - Application
In this example, strong sodium hydroxide, NaOH (aq), is being added to weak ethanoic acid, CH3COOH (aq)
NaOH (aq) + CH3COOH (aq) → CH3COONa (aq) + H2O (l)
The pH on the intercept on the y axis starts at roughly 3 due to the relative strength of the ethanoic acid
The initial rise in pH is steep because [CH3COOH] is much greater than [CH3COO-], so each addition of base changes the ratio of [CH3COO-] to [CH3COOH] significantly
Ethanoate ions (conjugate base to ethanoic acid) are formed which then creates a Buffer
A buffer consists of a weak acid and its conjugate base or a weak base and its conjugate acid
At this point, the buffer formed will resist changes in pH so the pH rises gradually as shown in the buffer region
The half equivalence point is the stage of the titration at which exactly half the amount of weak acid has been neutralised
[CH3COOH (aq)] = [CH3COO- (aq)]
At this point, it is important to note that the pKa of the acid is equal to the pH
pKa = pH at half equivalence
The equivalence point in a weak acid - strong base titration is above 7

Weak acid - strong base pH curve

Unlock more, it's free!
Join the 100,000+ Students that ❤️ Save My Exams
the (exam) results speak for themselves:

Was this revision note helpful?
Build on this topic