Types of Graphs (Edexcel GCSE Maths: Higher): Revision Note
Exam code: 1MA1

Types of graphs
What types of graphs do I need to know?
You need to be able to recognise, sketch, and interpret the following types of graph:
Linear ()
or
Quadratic ()
where
Cubic ()
or where
Reciprocal ()
where
Exponential () where
where
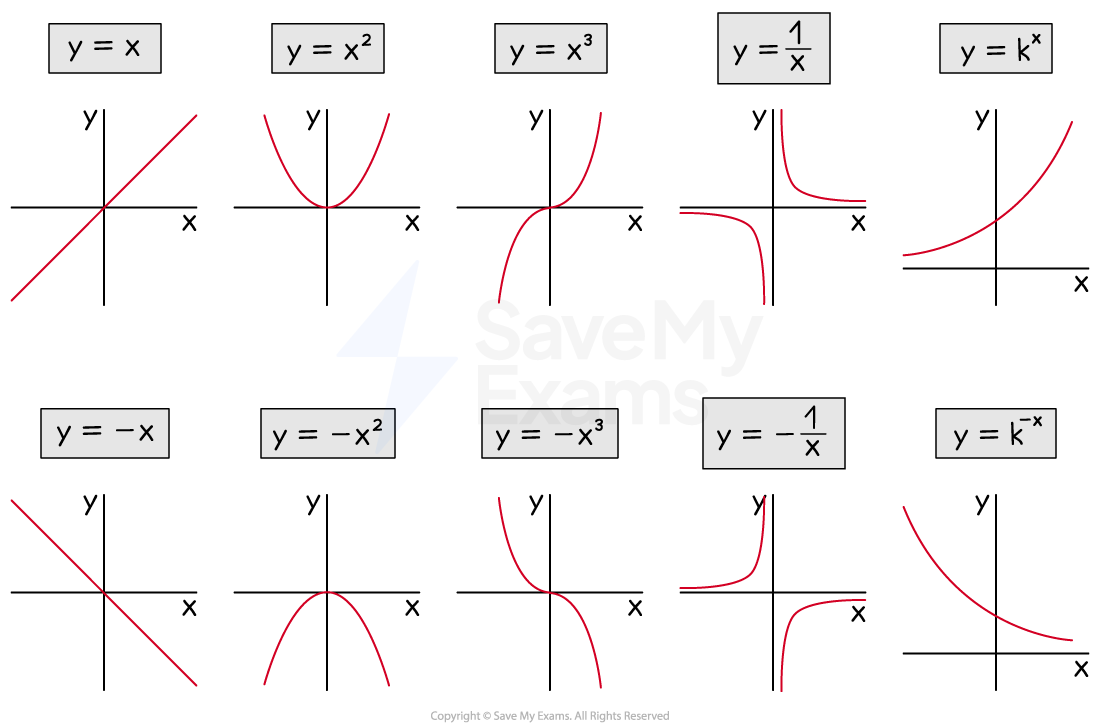
You must also be able to recognise the three basic trigonometric graphs, covered in the Trigonometry section
Where are the asymptotes on reciprocal graphs?
An asymptote is a line on a graph that a curve becomes closer to but never touches
These may be horizontal or vertical
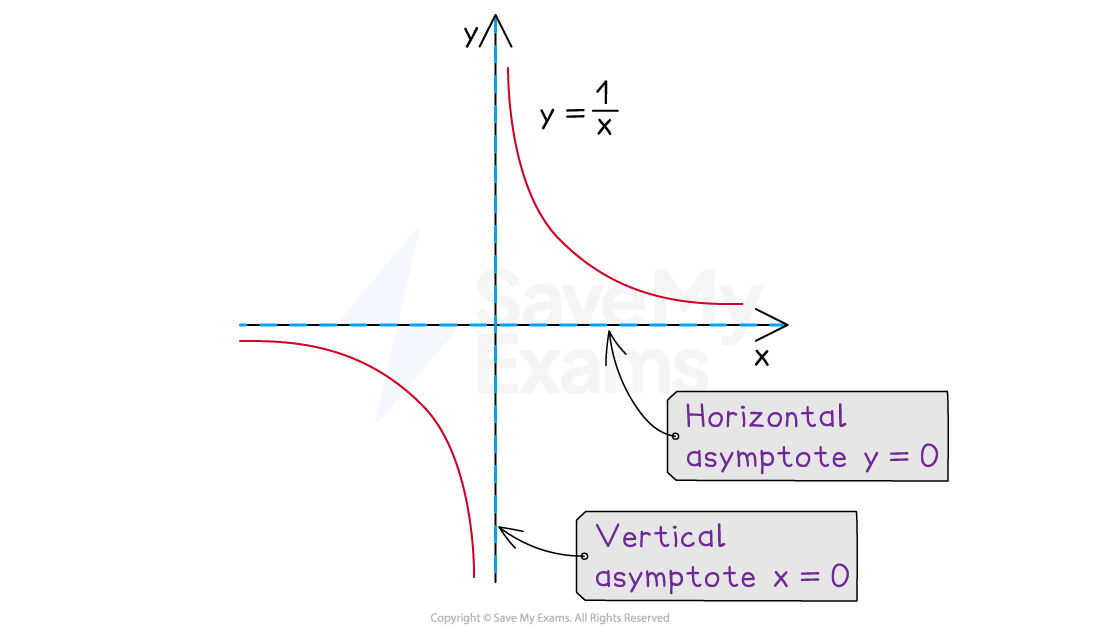
The reciprocal graph, (where is a constant)
does not have a y-intercept
and does not have any roots
This graph has two asymptotes
A horizontal asymptote at the x-axis:
This is the limiting value when the value of x gets very large (or very negative)
A vertical asymptote at the y-axis:
This is the value that causes the denominator to be zero
The reciprocal graph, (where and are both constants)
is the same shape as
but is shifted upwards by units
would be shifted down by 3 units
This means the horizontal asymptote also shifts up by units
The vertical asymptote remains on the y-axis
How do I draw exponential growth and decay?
The equation represents exponential growth when
represents exponential decay when
is positive but less than 1
Both of these graphs:
have a horizontal asymptote at
do not have a vertical asymptote
have a -intercept of
The graph of is a similar shape to , but there are some differences
It is first stretched vertically by
It is then shifted units upwards
Therefore it has a horizontal asymptote at
and a -intercept of
For example, a population may be modelled as , where is the population and represents time
This is an exponential decay as
The initial population (when ) will be 400 + 100 = 500
The -intercept is (0, 500)
Over a long period of time (large -value) the population will settle to 100
The asymptote is at
Exponential decay can also be identified by a negative power using index laws
so is the model above
This has the form where
Worked Example
Match the graphs to the equations.
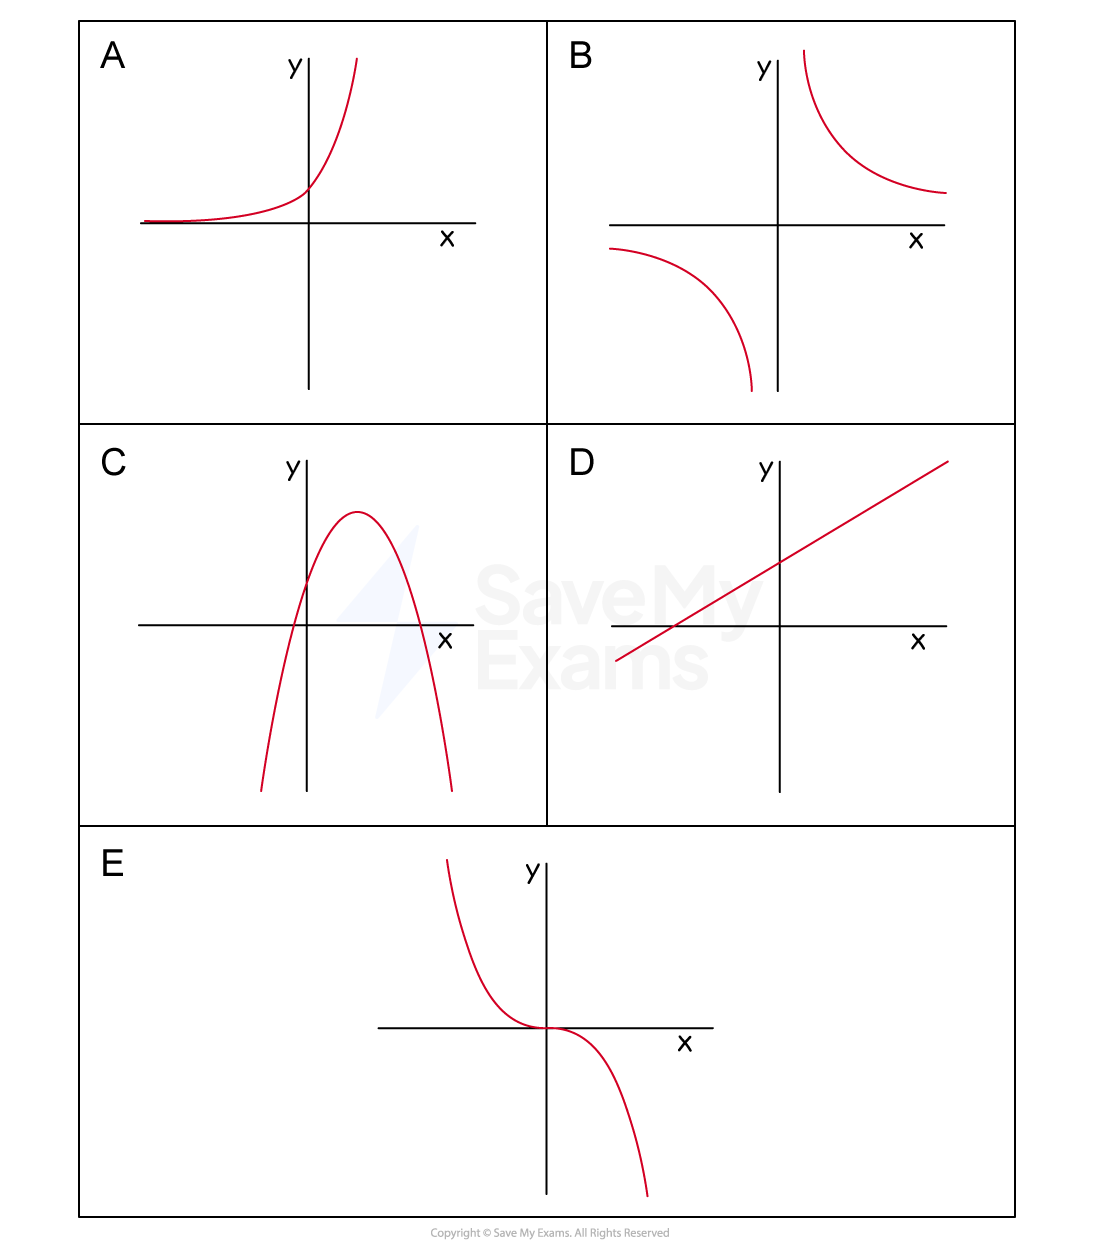
(1) , (2) , (3) , (4) , (5)
Answer:
Starting with the equations,
(1) is a linear equation (y = mx + c) so matches the only straight line, graph D
(2) is an exponential equation with a positive coefficient so matches graph A
(3) is a cubic equation with a negative coefficient so matches graph E
(4) is a reciprocal equation with a positive coefficient so matches graph B
(5) is a quadratic equation with a negative coefficient so matches graph C
Graph A → Equation 2
Graph B → Equation 4
Graph C → Equation 5
Graph D → Equation 1
Graph E → Equation 3

Unlock more, it's free!
Join the 100,000+ Students that ❤️ Save My Exams
the (exam) results speak for themselves:

Was this revision note helpful?
Build on this topic
