Rotational Kinetic Energy, Torque & Work (College Board AP® Physics 1: Algebra-Based): Exam Questions

52 mins20 questions
1a
Sme Calculator
2 marks
A sphere attached to a rod on an axle via a rod. The center of mass of the system is located just below the center of the sphere.

Figure 1

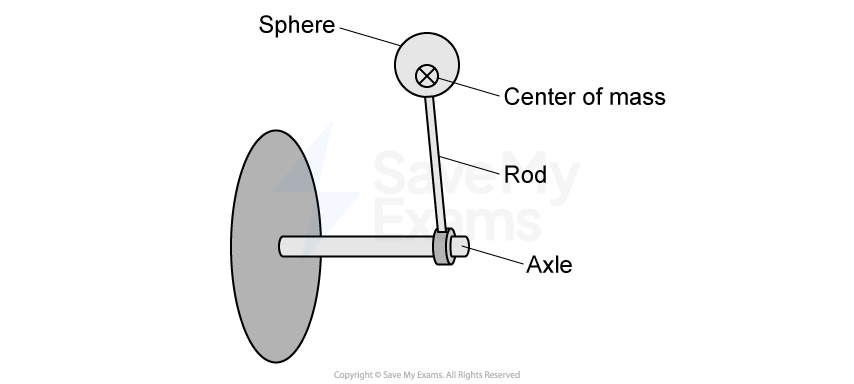
A rod with a sphere attached to the end is connected to a horizontal mounted axle and carefully balanced so that it rests in a position vertically upward from the axle. The center of mass of the rod sphere system is indicated with a circled times, as shown in Figure 1. The sphere is lightly tapped, and the rod-sphere system rotates clockwise with negligible friction about the axle due to the gravitational force.

A student takes a video of the rod rotating from the vertically upward position to the vertically downward position. Figure 2 shows five frames (still shots) that the student selected from the video.

Note: these frames are not equally spaced apart in time.
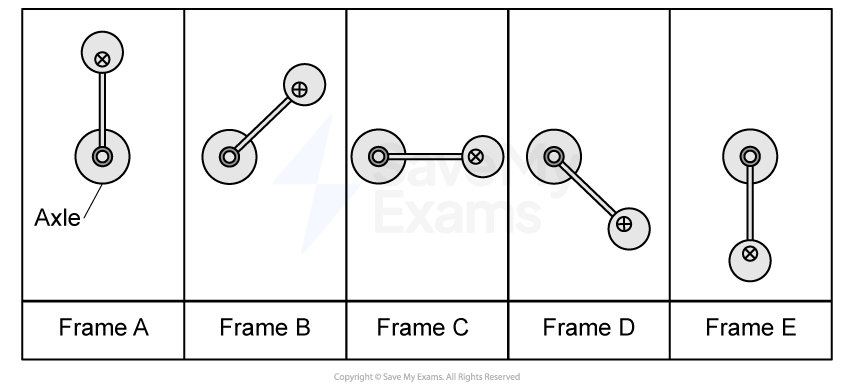
Five still frames, A to E, from a video of the rotating rod-sphere system. Frame A: the sphere is positioned vertically upward. Frame B: the sphere is between the vertically upward and horizontal positions. Frame C: the sphere is positioned horizontally. Frame D: the sphere is between the vertically downward and horizontal positions. Frame E: the sphere is positioned vertically downward.

Figure 2

In which of the frames of the video in Figure 2 is the rotational kinetic energy of the rod-sphere system the greatest? Justify your answer using qualitative reasoning beyond referencing equations.

1b
Sme Calculator
3 marks
A rod-sphere system hanging vertically downward with respect to the axle. Two lengths are indicated, length "L" represents the distance from axle to the bottom of the sphere, and length "3/4 L" represents the distance from the axle to the center of mass.

Figure 3

The rod-sphere system has mass M and length L, and the center of mass is located a distance 3 over 4 L from the axle, as shown in Figure 3.

Derive an expression for the change in kinetic energy of the rod-sphere-Earth system from the moment shown in Frame A to the moment shown in Frame E. Express your answer in terms of M, L, and fundamental constants, as appropriate. Begin your derivation by writing a fundamental physics principle or an equation from the reference information.

1c
Sme Calculator
3 marks

A student makes the following claim:

"The rod and sphere gain kinetic energy, even if the Earth is not included in the system".

Justify whether or not the student's claim is correct by referring to the equation you derived in part b).

2a
Sme Calculator
4 marks
A wheel mounted on an axle at its center with a block hanging from a string wound around the wheel. The block hangs from a height above the floor below.

Figure 1

A group of students have a wheel mounted on a horizontal axle and a small block of known mass attached to one end of a light string. The other end of the string is attached to the wheel's rim and wrapped around it several times, as shown in Figure 1. When the block is released from rest and begins to fall, the wheel begins to rotate with negligible friction.

The students are asked to determine the rotational inertia I of the wheel. The students measure the angular velocity \omega of the wheel as the block falls a distance d and determine the translational kinetic energy K_{T} of the block immediately before it reaches the floor.

The mass of the block is m space equals space 0.2 space kg. The student's measurements for different falling distances are shown in Table 1.

Table 1

d (m)

\omega (rad/s)

K_{T} (J)

0.10

2.4

0.08

0.30

3.8

0.16

0.50

5.1

0.36

0.70

6.0

0.47

0.90

6.7

0.59

1.10

7.5

0.72

The students create a graph with \omega^{2} plotted on the horizontal axis.

i) Label the vertical axis of Figure 2 with a measured or calculated quantity. Include units, as appropriate. The graphed quantities should yield a linear graph that can be used to determine the rotational inertia I of the wheel.

ii) On the grid provided in Figure 2, create a graph of the quantities indicated in part a)i).

  • Clearly label the vertical axis with a numerical scale

  • Plot the corresponding data points on the grid

  • Any columns added to Table 1 for scratch work will not be scored

Blank graph with horizontal axis labelled ω² in units of (rad/s)², ranging from 0 to 60 with evenly spaced gridlines. Vertical axis is blank with spaces for "Quantity" and "Units (if appropriate)" labelled.

Figure 2

iii) Draw a best-fit line to the data graphed in part a)ii).

2b
Sme Calculator
2 marks

Calculate an experimental value for the rotational inertia of the wheel using the best-fit line that you drew in part a)iii.

3
Sme Calculator
3 marks
A ball on the ground just below a pivot connected to a horizontal rod, with a curved dashed line representing the rotational path of the end of the rod once released.

Figure 1

A system consists of a small sphere of mass m and radius R at rest on a horizontal surface and a uniform rod of mass M space equals space 2 m and length l attached at one end to a pivot with negligible friction, where R space much less-than space l. There is negligible friction between the surface and the sphere. The rod is held horizontally as shown in Figure 1, and then is released from rest. The total rotational inertia of the rod about the pivot is 1 third M l squared. After the rod is released, the rod swings down and strikes the sphere head-on.

Starting with conservation of energy, derive an expression for the angular speed of the rod just before striking the sphere in terms of the length l and physical constants as appropriate. Begin your derivation by writing a fundamental physics principle or an equation from the reference information.

4a
Sme Calculator
2 marks
A spring with one end attached to a wall and one end attached to a string, which is wound three times around a horizontal cylinder on an axle. A side view of the setup shows that the string is slack.

Figure 1

A group of students would like to determine the spring constant k of a spring. One end of the spring is attached to a wall, and the other end is attached to a string, as shown in Figure 1. The string is wrapped around a horizontal cylinder of known rotational inertia I_{C}. The cylinder is free to rotate about a fixed horizontal axle with negligible friction.

The students want to take measurements using the setup shown in Figure 1. They do not have access to any devices that can measure force or mass.

i) Indicate quantities that could be measured by the students that would allow them to determine the spring constant k using a linear graph.

ii) Briefly describe a method to reduce experimental uncertainty for the measured quantities.

4b
Sme Calculator
2 marks

i) Indicate what quantities the students could plot on a graph to obtain a linear relationship that can be used to determine the spring constant k.

ii) Briefly describe how the graph could be analyzed to determine k. Your answer may include an equation that relates the measured or calculated quantities and the chosen feature of the graph.

4c
4 marks
A cylinder rolling down an inclined plane from an initial vertical height of delta y and then along a horizontal surface of length L.

Figure 2

The students would like to verify the value of the rotational inertia I subscript C of the cylinder. With the cylinder removed from the axle shown in Figure 1, the students measured its diameter D subscript C space equals space 0.1000 space straight m and its mass M subscript C space equals space 2.00 space kg.

In a series of experimental trials, the cylinder was released from rest on a ramp from various heights increment y, as shown in Figure 2. In each trial, the cylinder rolled without slipping down the ramp and onto a horizontal surface. The students then measured the time t subscript L it took the cylinder to travel a distance L space equals space 3.00 space straight m along the horizontal surface. The results of each experimental trial are shown in Table 1.

Table 1

Vertical height, increment y space open parentheses straight m close parentheses

Time taken to travel distance L, t subscript L space open parentheses straight s close parentheses

0.040

4.32

0.080

3.18

0.120

2.46

0.160

2.18

0.200

1.97

0.240

1.75

The students create a graph with increment y plotted on the horizontal axis.

i) Label the vertical axis of Figure 3 with a measured or calculated quantity. Include units, as appropriate. The graphed quantities should yield a linear graph that can be used to determine an experimental value for I subscript C.

ii) On the grid provided in Figure 3, create a graph of the quantities indicated in part c)i).

  • Clearly label the vertical axis with a numerical scale

  • Plot the corresponding data points on the grid

  • Any columns added to Table 1 for scratch work will not be scored.

Rectangular grid for plotting a graph with 7 by 5 large squares divided into 5 by 5 smaller squares. The horizontal axis is labelled with delta y in meters scaled from 0.00 to 0.25 in 0.05 increments.

Figure 3

iii) Draw a best-fit line to the data graphed in part c)ii).

4d
Sme Calculator
2 marks

Calculate an experimental value for I subscript C using the best-fit line that you drew in part c)iii).

5a
Sme Calculator
8 marks
A rotating platform of radius D with a vertical axis at its center, and a motor-driven wheel of radius r positioned perpendicularly to the right edge of the platform. Arrows indicate that the platform rotates counterclockwise and the wheel rotates clockwise.

Figure 1

A horizontal circular platform with rotational inertia I subscript P rotates freely without friction on a vertical axis. A small motor-driven wheel that is used to rotate the platform is mounted under the platform and touches it. The wheel has radius r and touches the platform a distance D from the vertical axis of the platform, as shown in Figure 1. The platform starts at rest, and the wheel exerts a constant horizontal force of magnitude F tangent to the wheel until the platform reaches an angular speed omega subscript P after time increment t. During time increment t, the wheel stays in contact with the platform without slipping.

i) On the axes shown in Figure 2, sketch and label a graph of the magnitude of the net torque tau exerted on the platform as a function of angular position theta during time increment t.

Graph axes with horizontal axis labelled theta (angular position) and vertical axis labelled tau (net torque).

Figure 2

Express your answers for a)ii), a)iii), and a)iv) in terms of I subscript P, r, D, F, increment t, and physical constants as appropriate.

ii) Derive an expression for the angular speed omega subscript P of the platform. Begin your derivation by writing a fundamental physics principle or an equation from the reference information.

iii) Determine an expression for the kinetic energy of the platform at the moment it reaches angular speed omega subscript P.

iv) Derive an expression for the angular speed of the wheel omega subscript W when the platform has reached angular speed omega subscript P. Begin your derivation by writing a fundamental physics principle or an equation from the reference information.

5b
Sme Calculator
2 marks
A non-rotating disk above a rotating circular platform, and a motor-driven wheel at the edge of the platform. Both disks have the same radius.

Figure 3

A student holds a disk directly above and concentric with the platform, as shown in Figure 3. The disk has the same rotational inertia I subscript P as the platform. When the platform is spinning at angular speed omega subscript P, the student releases the disk from rest, and the disk falls onto the platform. The motor-driven wheel keeps the disk and platform rotating together at the same constant angular speed omega subscript P.

In order to keep the system rotating with constant angular speed omega subscript P, is the motor doing positive work, negative work, or no work on the rotating system?

⎽⎽⎽⎽⎽⎽⎽⎽⎽⎽ Positive work‎ ‎ ‎ ‎ ‎ ‎ ‎ ‎ ‎ ‎ ⎽⎽⎽⎽⎽⎽⎽⎽⎽⎽ Negative work ‎ ‎ ‎‎ ‎ ‎ ‎ ‎ ‎ ‎ ⎽⎽⎽⎽⎽⎽⎽⎽⎽⎽ No work

Justify your answer.