Translation Between Representations (College Board AP® Physics 1: Algebra-Based): Exam Questions

2 hours9 questions
1a
Sme Calculator
2 points

A ball is dropped from rest from a height habove the ground. The ball reaches the ground in time t.

Determine an expression for the velocity of the ball just before it hits the ground in terms of t and physical constants as appropriate.

1b
Sme Calculator
3 points

Air resistance is found to be non-negligible.

On the axis provided in Figure 1, sketch a graph of the velocity of the ball as a function of time from its release to the time just before it hits the ground.
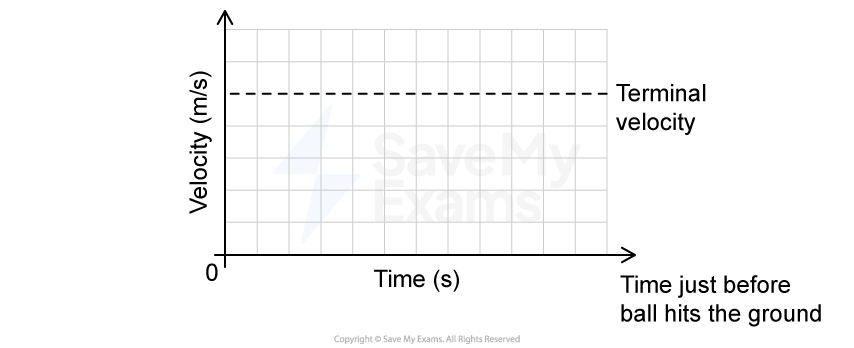
Graph showing velocity (m/s) against time (s). Horizontal line marks terminal velocity. Note: "Time when ball hits the ground" at graph end.

Figure 1

1c
Sme Calculator
3 points

On the axis provided in Figure 2, sketch a graph of the displacement of the ball as a function of time from its release to the time just before it hits the ground.
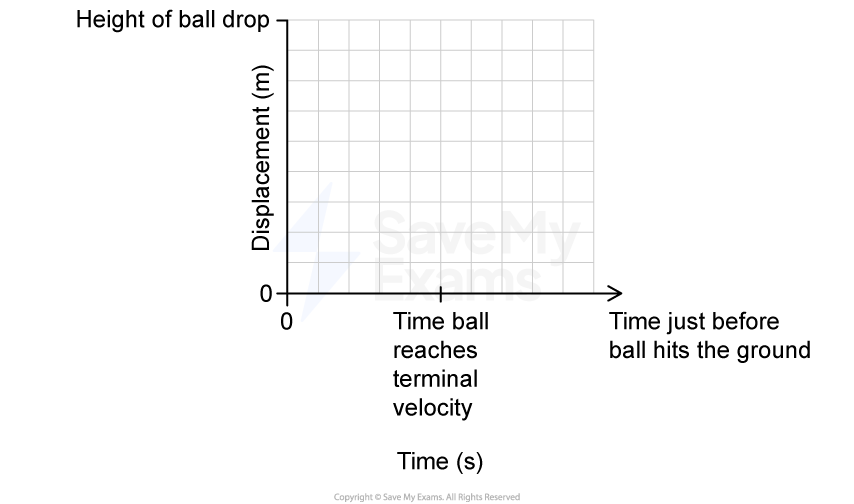
Graph with labelled axes; vertical is displacement in metres, horizontal is time in seconds. Notes: height of ball drop, terminal velocity, ground impact.

Figure 2

1d
Sme Calculator
3 points

Figure 3 shows the free-body diagram of the forces acting on the ball during its fall. The diagram has been drawn by a student. 
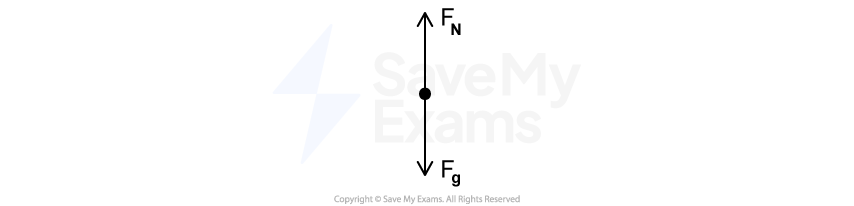
Diagram of a force diagram on graph paper, showing a dot with two opposing arrows labelled "Fn" upwards and "Fg" downwards, representing normal and gravitational forces.

Figure 3

A student sketches the free-body diagram in Figure 3 and makes the following claim:

"The free body diagram shows the forces acting on the ball for the entire time the ball falls."

Indicate whether the student’s sketch (Figure 3) and claim are or are not consistent with the graph of displacement as a function of time you sketched in part c). Justify your reasoning.

2a
Sme Calculator
3 points

A projectile is fired from level ground with speed v0 at an angle θ to the ground, where θ > 45°. The projectile is fired from a few centimeters before position x1, reaches its maximum height at position x2, and lands on the ground at position x3.

The energy bar charts in Figure 1 represent the gravitational potential energy Ug and the kinetic energy K of the projectile as it passes through positions x1, x2 and x3. The bar chart at position x1 is complete. Draw shaded rectangles to complete the energy bar charts in Figure 1 for positions x2 and x3.

  • Positive energy values are above the zero-energy line.

  • Shaded regions should start at the dashed line representing zero energy.

  • Represent any energy that is equal to zero with a distinct line on the zero-energy line.

  • The relative height of each shaded region should reflect the magnitude of the respective energy consistent with the scale shown.

Three energy bar charts, each with axes labelled Ug and K. The first graph shows two bars, one short measuring 0.5, the other tall, measuring 3.5; the other two graphs are empty.

Figure 1

2b
Sme Calculator
5 points

i) Derive an expression for the maximum height of the projectile in terms of v0, g, θ and physical constants as appropriate. Begin your derivation by writing a fundamental physics principle or an equation from the reference book.

ii) Determine an expression for the mass of the projectile in terms of maximum gravitational potential energy Ugmax, v0, θ and physical constants as appropriate.

2c
2 points

On the axes provided in Figure 2 sketch a graph of the horizontal and vertical components of the acceleration of the projectile at t = 0 where y = 0. Label the lines ax and ay respectively. Add any relevant values to the axes.

Graph with x-axis labelled "t" and y-axis labelled "a". The axes intersect at the origin, with grid lines in the background.

Figure 2

2d
Sme Calculator
2 points
Diagram showing a dot with two arrows: one labelled 'F' pointing right, the other 'F₉' pointing downward, illustrating forces acting on an object.

Figure 3

A student sketches the free-body diagram shown in Figure 3, and makes the following claim:

"The free-body diagram shows the forces acting on the projectile at position x1. "

Justify why the student's sketch (Figure 3) and claim are or are not consistent with the graph you sketched in part c).

3a
Sme Calculator
3 points
A ball launched at angle φ with initial velocity v0 towards a pendulum. The pendulum hangs from length L and swings up by angle θ after the collision with the ball.

Figure 1

A clay ball of mass m is launched at an angle ϕ above the horizontal with initial speed v0. At the moment it reaches the highest point in its trajectory and is moving horizontally, it collides with and sticks to a wooden block of mass M, as shown in Figure 1. The block is suspended from a light string of length L. The block and the clay then swing up to a maximum height h0 above the block’s initial position and make an angle θ with the vertical.

On the axes provided in Figure 2 sketch and label graphs of the horizontal and vertical components of the velocity of the clay ball as a function of time from the time the ball is launched to the time it strikes the block.

Two blank graphs axes; left is horizontal component of velocity as a function of time, right is vertical component of velocity as a function of time.

Figure 2

3b
Sme Calculator
4 points

i) Starting with conservation of momentum, derive an expression for the velocity of the block-clay system immediately after the collision. Express your answer in terms of m, M, v0 and ϕ. Begin your derivation by writing a fundamental physics principle or an equation from the reference information.

ii) Starting with conservation of energy, derive an expression for the speed of the clay ball immediately before it strikes the block. Express your answer in terms of m, M, L, θ and physical constants, as appropriate. Begin your derivation by writing a fundamental physics principle or an equation from the reference information.

3c
Sme Calculator
3 points

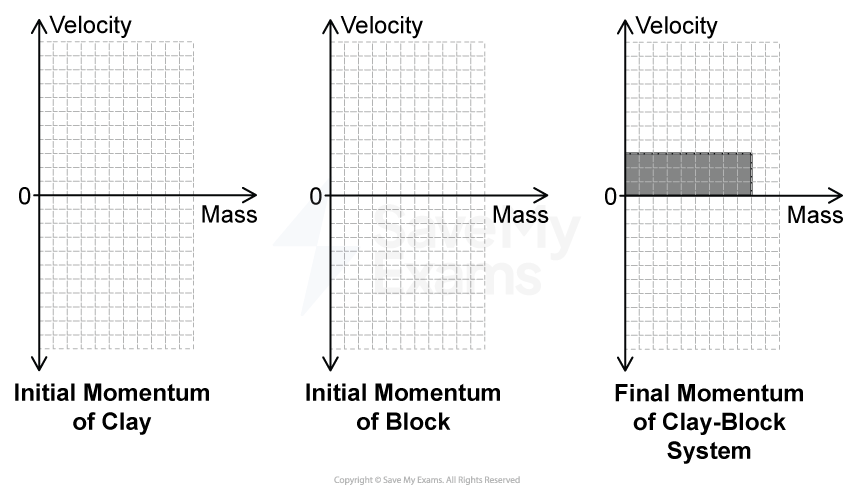
Figure 5 shows a momentum diagram that represents the velocity and mass of the clay-block system immediately after the clay ball strikes the block.

Draw shaded rectangles to complete the momentum diagrams in Figure 3 and Figure 4 to represent the velocity and mass of the clay ball and block, respectively, immediately before the clay ball strikes the block.

  • Positive values of velocity are above the zero line (“0”), and negative values of velocity are below the zero line.

  • Shaded regions should start at the lines representing zero velocity and mass.

  • Represent any velocity that is equal to zero with a distinct line on the zero line.

  • The relative height and width of each shaded region should reflect the magnitude of the velocity and mass, respectively, consistent with the scale used in Figure 5.

Three graphs showing momentum against mass. Left: Initial momentum of clay. Centre: Initial momentum of block. Right: Final momentum of clay-block system.

Figure 3‎ ‎ ‎ ‎ ‎ ‎ ‎ ‎ ‎ ‎ ‎ ‎ ‎ ‎ ‎ ‎ ‎ ‎ ‎ ‎ ‎ ‎ ‎ ‎ ‎ ‎ ‎ ‎ ‎ ‎ ‎ ‎ ‎ ‎ ‎ ‎ ‎ ‎ ‎ ‎ ‎ ‎ ‎ ‎ ‎ ‎ ‎ ‎ ‎ ‎ ‎ ‎ ‎Figure 4‎ ‎ ‎ ‎ ‎ ‎ ‎ ‎ ‎ ‎ ‎ ‎ ‎ ‎ ‎ ‎ ‎ ‎ ‎ ‎ ‎ ‎ ‎ ‎ ‎ ‎ ‎ ‎ ‎ ‎ ‎ ‎ ‎ ‎ ‎ ‎ ‎ ‎ ‎ ‎ ‎ ‎ ‎ ‎ ‎ ‎ ‎ ‎ ‎ ‎ ‎ ‎ ‎Figure 5

3d
Sme Calculator
2 points

In a second experiment, a steel ball is used instead of a clay ball. The steel ball is launched at the same speed and angle, but instead collides elastically with the block. The block swings up to a maximum height h0'.

Indicate whether h0' is greater than, less than, or equal to h0 by writing one of the following:

  • h0' > h0

  • h0' = h0

  • h0' < h0

Justify your answer.

4a
Sme Calculator
2 points
Spring 1 has constant k_1. It is in series with spring 2, with constant k_2. This is connected to a block with mass m. The block is to the left of equilibrium at x = -A, such that the springs are compressed.

Figure 1

Two ideal springs, 1 and 2, of spring constant k1 and k2 respectively, are connected end to end. A block of mass m is attached to the end of Spring 2 and the other end of Spring 1 is fixed to a wall. The block is displaced to the left of the spring's equilibrium position, x = 0, and held stationary at position x = A, as shown in Figure 1.

On the diagram in Figure 1, draw and label arrows that represent the forces (not components) that are exerted on Spring 2 as the block is held at position x = A.

  • Each force in your diagram must be represented by a distinct arrow starting on, and pointing away from, the point at which the force is exerted on Spring 2.

  • The length of arrows should represent the relative magnitudes of the forces.

4b
Sme Calculator
5 points

At time t = 0, the block is released. At time t = t0, the block's position is x = 12A and it is travelling to the right.

i) Derive an expression for the effective spring constant of Spring 1 and Spring 2 in terms of k1, k2 and physical constants as appropriate. Begin your derivation by writing a fundamental physics principle or an equation from the reference information.

ii) Starting with the equation for the position of an object in simple harmonic motion, derive an expression for time t0 in terms of k1, k2, m and physical constants as appropriate. Begin your derivation by writing a fundamental physics principle or an equation from the reference information.

4c
Sme Calculator
3 points

The energy bar chart in Figure 2 represents the spring potential energy Us of the block-spring system and the kinetic energy K of the block at time t = t0. Draw shaded rectangles to complete the energy bar charts in Figure 2 for the block-spring system at time t = t0.

  • Positive energy values are above the zero-energy line (“0”), and negative energy values are below the zero-energy line.

  • Shaded regions should start at the dashed line representing zero energy.

  • Represent any energy that is equal to zero with a distinct line on the zero-energy line.

  • The relative height of each shaded region should reflect the magnitude of the respective energy consistent with the scale shown.

Graph with a vertical arrow marked "E tot" and a horizontal line intersected by a vertical line at "0". Labels include "U s" and "K". Dotted horizontal lines.

Figure 2

4d
Sme Calculator
2 points
A negative cosine graph of displacement as a function of time. It oscillates between A and -A and has a period of T.

Figure 3

A student sketches a graph of the block's displacement as a function of time, as shown in Figure 3.

Indicate whether the student's graph (Figure 3) is consistent with the energy bar chart you drew in part c). Justify your answer.

5a
2 points
Two experiments: A rubber ball hits a block on a table in Experiment A; a clay ball hits a block on a table in Experiment B.

Figure 1

A student conducts an experiment using a rubber ball of mass m and a clay ball of the same mass. At time t = 0, each ball is thrown horizontally with speed v0 toward two identical blocks that are fixed in place, as shown in Figure 1. At time t = t0, the balls collide with their respective blocks. The forces exerted by the blocks on the balls last for the same amount of time. In Experiment A, the rubber ball bounces off of the block and rebounds with the same speed. In Experiment B, the clay ball sticks to the block.

The arrow in Figure 2 represents the momentum of the rubber ball immediately before the collision in Experiment A.

An 8 by 8 grid with dashed lines with a dot at the center and an arrow of 2 units in length pointing right.

Figure 2

The dots in Figure 3 represent the rubber ball in Experiment A and the clay ball in Experiment B respectively.

Two grids, labeled Experiment A (left) and Experiment B (right), each with a black dot at the center.

Figure 3

On the dots in Figure 3, draw arrows to represent the momentum of the rubber ball and the clay ball immediately after their respective collisions.

  • If the momentum is zero, write “zero” next to the dot.

  • The momentum, if it is not zero, must be represented by an arrow starting on, and pointing away from, the dot.

  • The length of the arrows, if not zero, should reflect the magnitude of the momentum relative to the arrow in Figure 2.

5b
Sme Calculator
3 points

i) Derive an expression for the magnitude of the impulse exerted by the block on the rubber ball in terms of m and v0. Begin your derivation by writing a fundamental physics principle or an equation from the reference information.

ii) Determine an expression for the magnitude of the impulse exerted by the block on the clay ball in terms of m and v0.

5c
4 points

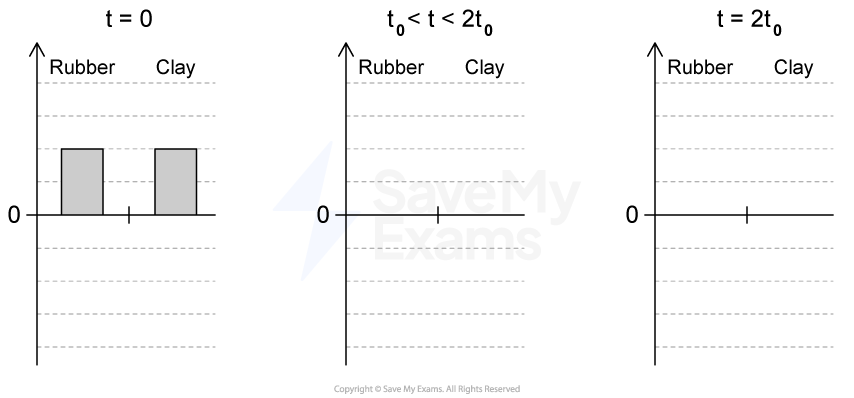
The momentum bar charts in Figure 4 represent the momentum of the rubber ball and clay ball before the collision at time t = 0, during the collision in the time interval between t = t0 and t = 2t0, and after the collision at time t = 2t0. The bar chart at t = 0 is complete. Draw shaded rectangles to complete the momentum bar charts in Figure 4 in the time interval t0 < t < 2t0 and at time t = 2t0.

  • Positive values of momentum are above the zero line (“0”), and negative values of momentum are below the zero line.

  • Shaded regions should start at the dashed line representing zero momentum.

  • Represent any momentum that is equal to zero with a distinct line on the zero line.

  • The relative height of each shaded region should reflect the magnitude of the respective momentum consistent with the scale shown.

Three graphs showing a signal over time. Left: two bars for rubber and clay at t=0. Middle: no bars for rubber or clay at t<2t0. Right: identical to middle.

Figure 4

5d
Sme Calculator
3 points
Two free-body diagrams on 6 by 6 grids. Both show forces Ff (length 2 units) acting up and Fg (length 2 units) acting down. Experiment A (left): force FA is 1.5 units in length and acts to the left. Experiment B (right): force FB is 3 units in length and acts to the left.

Figure 5

A student sketches the free-body diagrams in Figure 5, and makes the following claim:

“The free-body diagrams show the average forces exerted on each ball during the time interval t0 < t < 2t0”.

Justify why the student’s sketch (Figure 5) and claim are or are not consistent with the momentum bar charts you drew in part c).

6a
Sme Calculator
3 points
Two diagrams show carts A and B moving right towards force sensors on tracks, with velocities vA and vB indicated by arrows.

Figure 1

Two identical carts A and B, each of mass m, are moving along a frictionless horizontal track. A force sensor is positioned to record the motion of the carts along the track, as shown in Figure 1. The carts travel toward the force sensor and collide with it. Before the collision, Cart A travels at speed vA and Cart B travels at speed vB = 2vA. The graphs in Figure 2 show the forces exerted on the carts during the collisions as functions of time.

Two line graphs compare force over time for Cart A and Cart B. Each graph shows a peak force of 40 N at 0.05 seconds, returning to 0 N at 0.1 seconds.

Figure 2

i) Using the data from the graphs in Figure 2, determine the ratio of the change in Cart A's momentum to the change in Cart B's momentum.

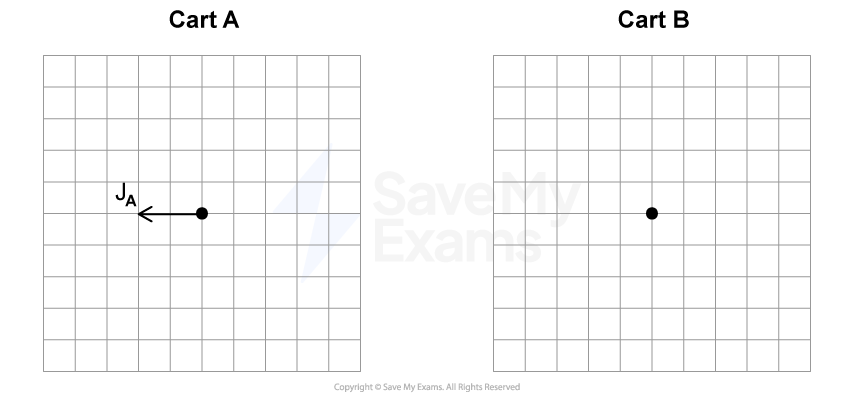
The dots in Figure 3 represent Cart A and B respectively. The arrow labeled  JA represents the impulse exerted on Cart A.

Grid diagram with two labelled sections, Cart A and Cart B. Cart A has an arrow pointing left from a central dot, labelled 'J_A'. Cart B shows a central dot only.

Figure 3

ii) On the dot in Figure 3 representing Cart B, draw an arrow to represent the impulse exerted on Cart B.

  • The impulse must be represented by a distinct arrow starting on, and pointing away from, the dot.

  • The length of the arrow should reflect the relative magnitude of the impulse exerted on Cart A.

6b
Sme Calculator
3 points

After the collision, Cart A rebounds with the same speed.

Derive an expression for the final speed of Cart B in terms of vB. Begin your derivation by writing a fundamental physics principle or an equation from the reference book.

6c
Sme Calculator
4 points

On the axes provided in Figure 4, sketch a graph of the momentum of the carts as a function of time.

Two graphs compare momentum over time for Cart A and Cart B. Both axes are labelled, with momentum on the y-axis and time on the x-axis.

Figure 4

6d
Sme Calculator
2 points

A spring is attached to the force sensor and the experiment is repeated. The carts collide with the spring, with both Cart A and Cart B having the same initial and final velocities as in the first collision. In the original collision without the spring, the magnitude of the average net force exerted on the carts is F0. In the collision with the spring, the magnitude of the average net force exerted on the carts is FS.

Indicate whether the magnitude of FS is greater than, less than, or equal to the magnitude of F0 by writing one of the following:

  • FS > F0

  • FS = F0

  • FS < F0

Justify your reasoning.

7a
Sme Calculator
3 points
Two blocks on a horizontal surface; Block A (6 kg) moving left to right towards Block B (2 kg) at time t = 0, with motion lines indicating speed.

Figure 1

At time t = 0, Block A slides along a horizontal surface toward Block B, which is initially at rest, as shown in Figure 1. The masses of blocks A and B are 6 kg and 2 kg, respectively. The blocks collide elastically at t = 1.0 s and, as a result, the magnitude of the change in kinetic energy of Block B is 9 J. All frictional forces are negligible.

i) Determine the speed of Block B immediately after the collision.

ii) Determine the speed of Block A immediately after the collision.

7b
Sme Calculator
2 points

The arrow in Figure 2 represents the velocity of the center of mass of the two-block system immediately after the collision.

An 8 by 8 grid with dashed lines with a dot at the center and an arrow of 1.5 units in length pointing right.

Figure 2

The dots in Figure 3 represent Block A and B respectively.

Two grids, labeled Block A (left) and Block B (right), each with a black dot at the center.

Figure 3

On the dots in Figure 3, draw arrows to represent the velocities of Block A and Block B immediately after the collision.

  • If the velocity is zero, write “zero” next to the dot.

  • The velocity, if it is not zero, must be represented by an arrow starting on, and pointing away from, the dot.

  • The length of the arrows, if not zero, should reflect the magnitude of the velocity relative to the arrow in Figure 2.

7c
Sme Calculator
4 points
Graph with time in seconds on the x-axis and position in metres on the y-axis. It shows the positions of Block A, Block B, and the center of mass of the system.

Figure 4

The graph shown in Figure 4 represents the positions x of Block A, Block B, and the center of mass of the two-block system as functions of t between t = 0 and t = 1.0 s.

On the graph in Figure 4, draw and label three lines to represent the positions of Block A, Block B, and the center of mass of the two-block system as functions of t between t = 1.0 s and t = 2.0 s. Each line should be distinctly labeled.

7d
Sme Calculator
3 points

A student considers whether the line drawn for the center of mass in part c) would change if the blocks stuck together after the collision rather than colliding elastically. They make the following claim:

“The slope of the line drawn for the center of mass of the two-block system would be less steep”.

Justify whether or not the student’s claim is correct.

8a
Sme Calculator
3 points
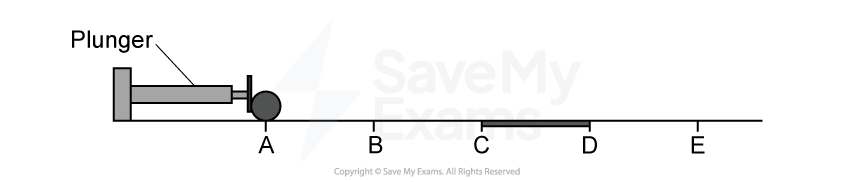
Plunger moves from position A to position F with a block at A and E; textured section between C and D.

Figure 1

Blocks 1 and 2, each of mass m, are placed on a horizontal surface at points A and E, respectively, as shown in Figure 1. The surface is frictionless except for the region between points C and D.

In the time interval t = tA to t = tB, a mechanical plunger pushes Block 1 with a constant horizontal force of magnitude Fp. At point B, Block 1 loses contact with the plunger and continues moving to the right with speed vB. In the time interval t = tC to t = tD, Block 1 moves over the rough surface where the coefficient of kinetic friction between the block and the surface is μ. At point D, Block 1 is moving to the right with speed vD. At point E, Block 1 collides with and sticks to Block 2, after which the two-block system continues moving across the surface, eventually passing point F at time tF.

Two blocks on a line; left image shows block 1 at D moving with velocity vD and block 2 at E with zero velocity; right image shows blocks together at E.

Figure 2

Figure 2 shows the location of the center of mass of the two-block system just before and during the collision.

The dots in Figure 3 represent the blocks while they are in contact during the collision, and the center of mass of the two-block system.

Three grids labelled Block 1, Block 2, and Two-block system, each with a central black dot on a 6x6 grid.

Figure 3

On each of the dots in Figure 3, draw arrows to indicate the direction of the net force, if any, exerted on each block, and the two-block system.

  • If the net force is zero for either block or the two-block system, write “zero” next to the dot.

  • The net force must be represented by a distinct arrow starting on, and pointing away from, the appropriate dot.

  • The length of the arrows, if not zero, should reflect the magnitude of the net force relative to the other arrows.

8b
3 points

The magnitude of the impulse exerted on Block 1 as it moves over the rough surface is equal to half the magnitude of the impulse exerted on it by the plunger.

i) Determine an expression for the magnitude of the force Fp exerted on Block 1 by the plunger, in terms of μ, m, tA, tB, tC, tD, and physical constants as appropriate.

ii) Derive an expression for the speed vD of Block 1 in terms of vB. Begin your derivation by writing a fundamental physics principle or an equation from the reference information.

8c
Sme Calculator
4 points

On the axes provided in Figure 4, sketch and label a graph of the velocity of the center of mass of the two-block system as a function of time, from time tA until the blocks pass point F at time tF. The times at which Block 1 reaches points A through F are indicated on the time axis.

Graph with time on the x-axis and velocity of center of mass on the y-axis, showing six points from tA to tF along the time axis.

Figure 4

8d
Sme Calculator
2 points
A solid sphere on a surface with marked points A to F. The sphere is at point A next to a plunger. The surface is shaded between points C and D to represent a region where friction acts.

Figure 5

A uniform solid sphere is placed at point A, as shown in Figure 5. The surface is frictionless except for the region between points C and D, where the surface is rough. The sphere is pushed by the plunger from point A to point B with a constant horizontal force that is directed toward the sphere’s center of mass. The sphere loses contact with the plunger at point B and continues moving across the horizontal surface toward point E.

In which interval(s), if any, does the sphere’s angular momentum about its center of mass change? Justify your reasoning.

9a
Sme Calculator
3 points
Diagram showing a spring-mass system with a block labelled "m" displaced to the left from its original position by a hand, past point -x₀.

Figure 1

A block of mass m is attached to an ideal spring, whose other end is fixed to a wall. The block is displaced a distance x0 to the left of the spring’s equilibrium position, as shown in Figure 1. The block is then released from rest and oscillates with negligible friction along the horizontal surface. While the block is oscillating, it has a maximum speed vmax .

The energy bar charts in Figure 2 represent the spring potential energy Us of the block-spring system, and the kinetic energy K of the block, as the block passes through positions x=x0, x=0 and x=+x0 while the block oscillates. The bar chart at x=x0 is complete. Draw shaded rectangles to complete the energy bar charts in Figure 2 for positions x=0 and x=+x0.

  • Positive energy values are above the zero-energy line (“0”), and negative energy values are below the zero-energy line.

  • Shaded regions should start at the dashed line representing zero energy.

  • Represent any energy that is equal to zero with a distinct line on the zero-energy line.

  • The relative height of each shaded region should reflect the magnitude of the respective energy consistent with the scale shown.

Three energy bar charts, labelled x = -x_0, x = 0 and x = +x_0 respectively. Each has a central x axis labelled "0". The y axis extends 4 dashed lines above this and 4 dashed lines below. Each bar chart has two spaces for a bar labelled U_s and K. The first bar chart, x = -x_0, has the U_s bar already filled. This is a height of 3 dashed lines above the "0" line.

Figure 2

9b
Sme Calculator
4 points

Figure 3 shows the position of the block as a function of time. Figure 4 shows the force exerted by the spring on the block as a function of time.

Graph of a sinusoidal wave showing position versus time, with peaks at +x₀ and troughs at -x₀. Time is marked at intervals t₀ to 4t₀.

Figure 3

Positive cosine displacement-time graph, starting at +F_max at time 0. At t_0, force is -F_max, at 2t_0 force is +F_max and at 3t_0 force is -F-max again.

Figure 4

i) Using figures 3 and 4, determine an expression for the spring constant of the spring.

ii) Starting with the equation for the period of a mass on a spring, derive an expression for the mass of the block. Express your answer in terms of t0, x0, Fmax, and physical constants, as appropriate. Begin your derivation by writing a fundamental physics principle or an equation from the reference information.

9c
Sme Calculator
3 points

On the axes provided in Figure 5 sketch a graph of the velocity of the block as a function of time.

Graph with labelled axes. Y-axis: Velocity (m/s), 0 to Vmax. X-axis: Time (s), 0 to 4t₀. Vertical and horizontal grid lines are present.

Figure 5

9d
Sme Calculator
2 points
Diagram of a force vector grid with a central dot; upward FN, downward Fg, and rightward Fs arrows, representing normal, gravitational, and static forces.

Figure 6

A student sketches the free-body diagram in Figure 6, and makes the following claim:

“The free-body diagram shows the forces exerted on the block at time t = 1.5t0”.

Justify why the student’s sketch (Figure 6) and claim are or are not consistent with the graph of velocity as a function of time you sketched in part c).