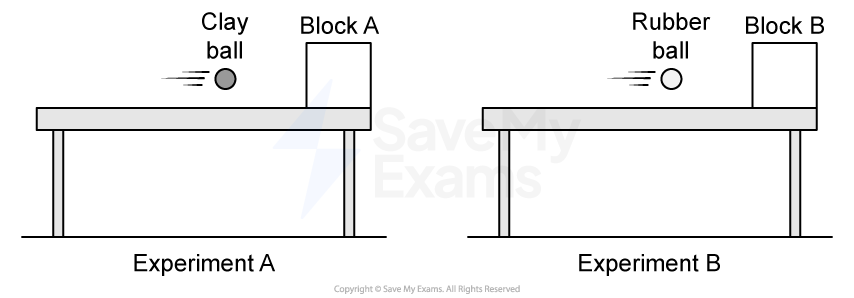
Figure 2
In a later experiment, Cart 2 is placed next to a wall. When the switch is pressed, the spring expands and the plunger pushes on the wall, causing Cart 2 to move towards Cart 1, as shown in Figure 2. Cart 1 is initially at rest. After the collision, the two carts stick together and move along the track with speed  . Blocks of identical, known mass can be attached to Cart 1 and Cart 2, as long as the total mass of the system remains constant. The spring constant
  of the spring in Cart 2 is unknown. When the spring is contained within the cart, it is compressed by a fixed distance
  from its equilibrium position.
The students are asked to determine the value of the spring constant of the spring. The students measure the combined mass format('truetype')%3Bfont-weight%3Anormal%3Bfont-style%3Anormal%3B%7D%3C%2Fstyle%3E%3C%2Fdefs%3E%3Ctext%20font-family%3D%22Times%20New%20Roman%22%20font-size%3D%2218%22%20font-style%3D%22italic%22%20text-anchor%3D%22middle%22%20x%3D%228.5%22%20y%3D%2216%22%3EM%3C%2Ftext%3E%3Ctext%20font-family%3D%22Times%20New%20Roman%22%20font-size%3D%2213%22%20text-anchor%3D%22middle%22%20x%3D%2220.5%22%20y%3D%2224%22%3E1%3C%2Ftext%3E%3Ctext%20font-family%3D%22math1f7177163c833dff4b38fc8d287%22%20font-size%3D%2212%22%20text-anchor%3D%22middle%22%20x%3D%2226.5%22%20y%3D%2224%22%3E%2C%3C%2Ftext%3E%3Ctext%20font-family%3D%22Times%20New%20Roman%22%20font-size%3D%2213%22%20font-style%3D%22italic%22%20text-anchor%3D%22middle%22%20x%3D%2232.5%22%20y%3D%2224%22%3EB%3C%2Ftext%3E%3C%2Fsvg%3E) of Cart 1 and the blocks, the combined mass
of Cart 1 and the blocks, the combined mass format('truetype')%3Bfont-weight%3Anormal%3Bfont-style%3Anormal%3B%7D%3C%2Fstyle%3E%3C%2Fdefs%3E%3Ctext%20font-family%3D%22Times%20New%20Roman%22%20font-size%3D%2218%22%20font-style%3D%22italic%22%20text-anchor%3D%22middle%22%20x%3D%228.5%22%20y%3D%2216%22%3EM%3C%2Ftext%3E%3Ctext%20font-family%3D%22Times%20New%20Roman%22%20font-size%3D%2213%22%20text-anchor%3D%22middle%22%20x%3D%2220.5%22%20y%3D%2224%22%3E2%3C%2Ftext%3E%3Ctext%20font-family%3D%22math1f7177163c833dff4b38fc8d287%22%20font-size%3D%2212%22%20text-anchor%3D%22middle%22%20x%3D%2226.5%22%20y%3D%2224%22%3E%2C%3C%2Ftext%3E%3Ctext%20font-family%3D%22Times%20New%20Roman%22%20font-size%3D%2213%22%20font-style%3D%22italic%22%20text-anchor%3D%22middle%22%20x%3D%2232.5%22%20y%3D%2224%22%3EB%3C%2Ftext%3E%3C%2Fsvg%3E) of Cart 2 and the blocks, and the final speed of the two-cart-block system.
of Cart 2 and the blocks, and the final speed of the two-cart-block system.
The students measure the fixed value format('truetype')%3Bfont-weight%3Anormal%3Bfont-style%3Anormal%3B%7D%3C%2Fstyle%3E%3C%2Fdefs%3E%3Ctext%20font-family%3D%22Times%20New%20Roman%22%20font-size%3D%2218%22%20font-style%3D%22italic%22%20text-anchor%3D%22middle%22%20x%3D%224.5%22%20y%3D%2216%22%3Ex%3C%2Ftext%3E%3Ctext%20font-family%3D%22math11824c643d1feb4da18b28ed527%22%20font-size%3D%2216%22%20text-anchor%3D%22middle%22%20x%3D%2222.5%22%20y%3D%2216%22%3E%3D%3C%2Ftext%3E%3Ctext%20font-family%3D%22Times%20New%20Roman%22%20font-size%3D%2218%22%20text-anchor%3D%22middle%22%20x%3D%2239.5%22%20y%3D%2216%22%3E0%3C%2Ftext%3E%3Ctext%20font-family%3D%22math11824c643d1feb4da18b28ed527%22%20font-size%3D%2216%22%20text-anchor%3D%22middle%22%20x%3D%2246.5%22%20y%3D%2216%22%3E.%3C%2Ftext%3E%3Ctext%20font-family%3D%22Times%20New%20Roman%22%20font-size%3D%2218%22%20text-anchor%3D%22middle%22%20x%3D%2262.5%22%20y%3D%2216%22%3E062%3C%2Ftext%3E%3Ctext%20font-family%3D%22Times%20New%20Roman%22%20font-size%3D%2218%22%20text-anchor%3D%22middle%22%20x%3D%2287.5%22%20y%3D%2216%22%3Em%3C%2Ftext%3E%3C%2Fsvg%3E) . The students repeat the experiment using different numbers of blocks on each cart and collect the data shown in Table 1.
. The students repeat the experiment using different numbers of blocks on each cart and collect the data shown in Table 1.
Table 1
Combined mass of Cart 1 and blocks, (kg) | Combined mass of Cart 2 and blocks, (kg) | Final speed of the two-cart-block system, (m/s) |
|---|
1.750 | 0.500 | 0.410 |
1.500 | 0.750 | 0.505 |
1.250 | 1.000 | 0.585 |
1.000 | 1.250 | 0.650 |
0.750 | 1.500 | 0.720 |
0.500 | 1.750 | 0.775 |
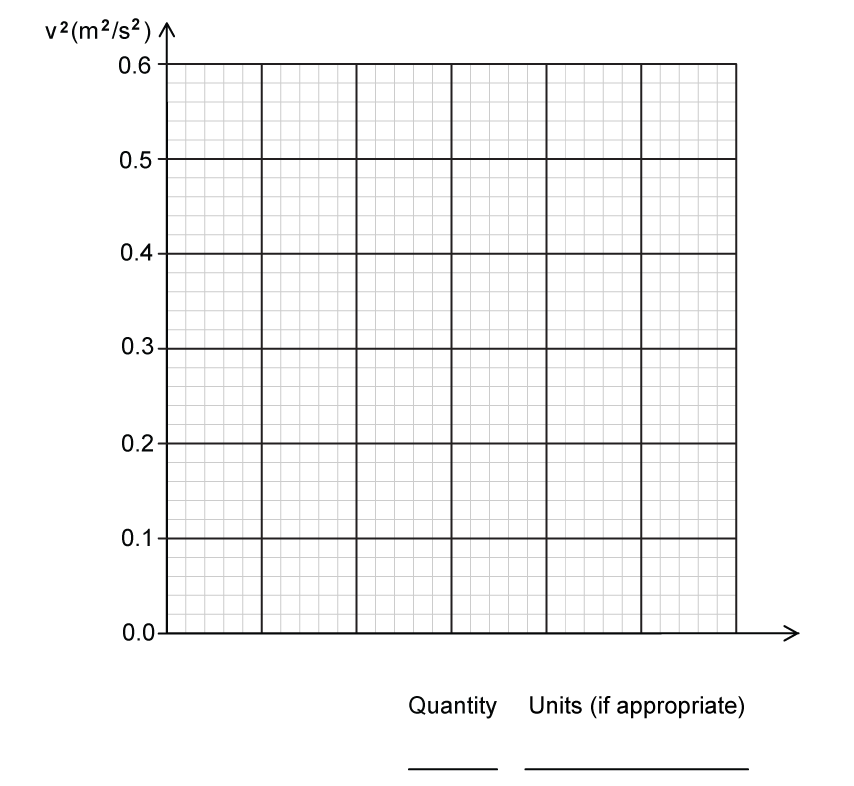
The students create a graph with  plotted on the vertical axis.
i) Label the horizontal axis of Figure 3 with a measured or calculated quantity. Include units, as appropriate. The graphed quantities should yield a linear graph that can be used to determine the spring constant of the spring.
ii) On the grid provided in Figure 3, create a graph of the quantities indicated in part c)i).
Clearly label the horizontal axis with a numerical scale
Plot the corresponding data points on the grid
Any columns added to Table 1 for scratch work will not be scored
Figure 3
iii) Draw a best-fit line to the data graphed in part c)ii).