Required Practical: Osmosis (AQA GCSE Biology): Revision Note
Exam code: 8461

Osmosis required practical
Aim:
To investigate the range of concentrations of salt or sugar solutions on the mass of plant tissue
Procedure:
Use a cork borer to prepare samples of potato tissue
Other types of plant tissue, e.g. carrot or beetroot, can also be used
Cut sample cylinders to the same length
Measure the mass of each sample and record as the initial mass
Prepare test tubes containing a range of solutions at different solute concentrations; label each solution clearly
This practical can be carried out with either salt or sucrose solutions of at least five different concentrations
Place a potato cylinder in each tube and leave for 15 minutes
Remove the cylinders, blot dry to remove excess solution from the surface (any left on would make the recorded mass higher) and record the final mass
Repeat at each concentration (e.g. three times) and calculate the mean change in mass, leaving out any anomalous results
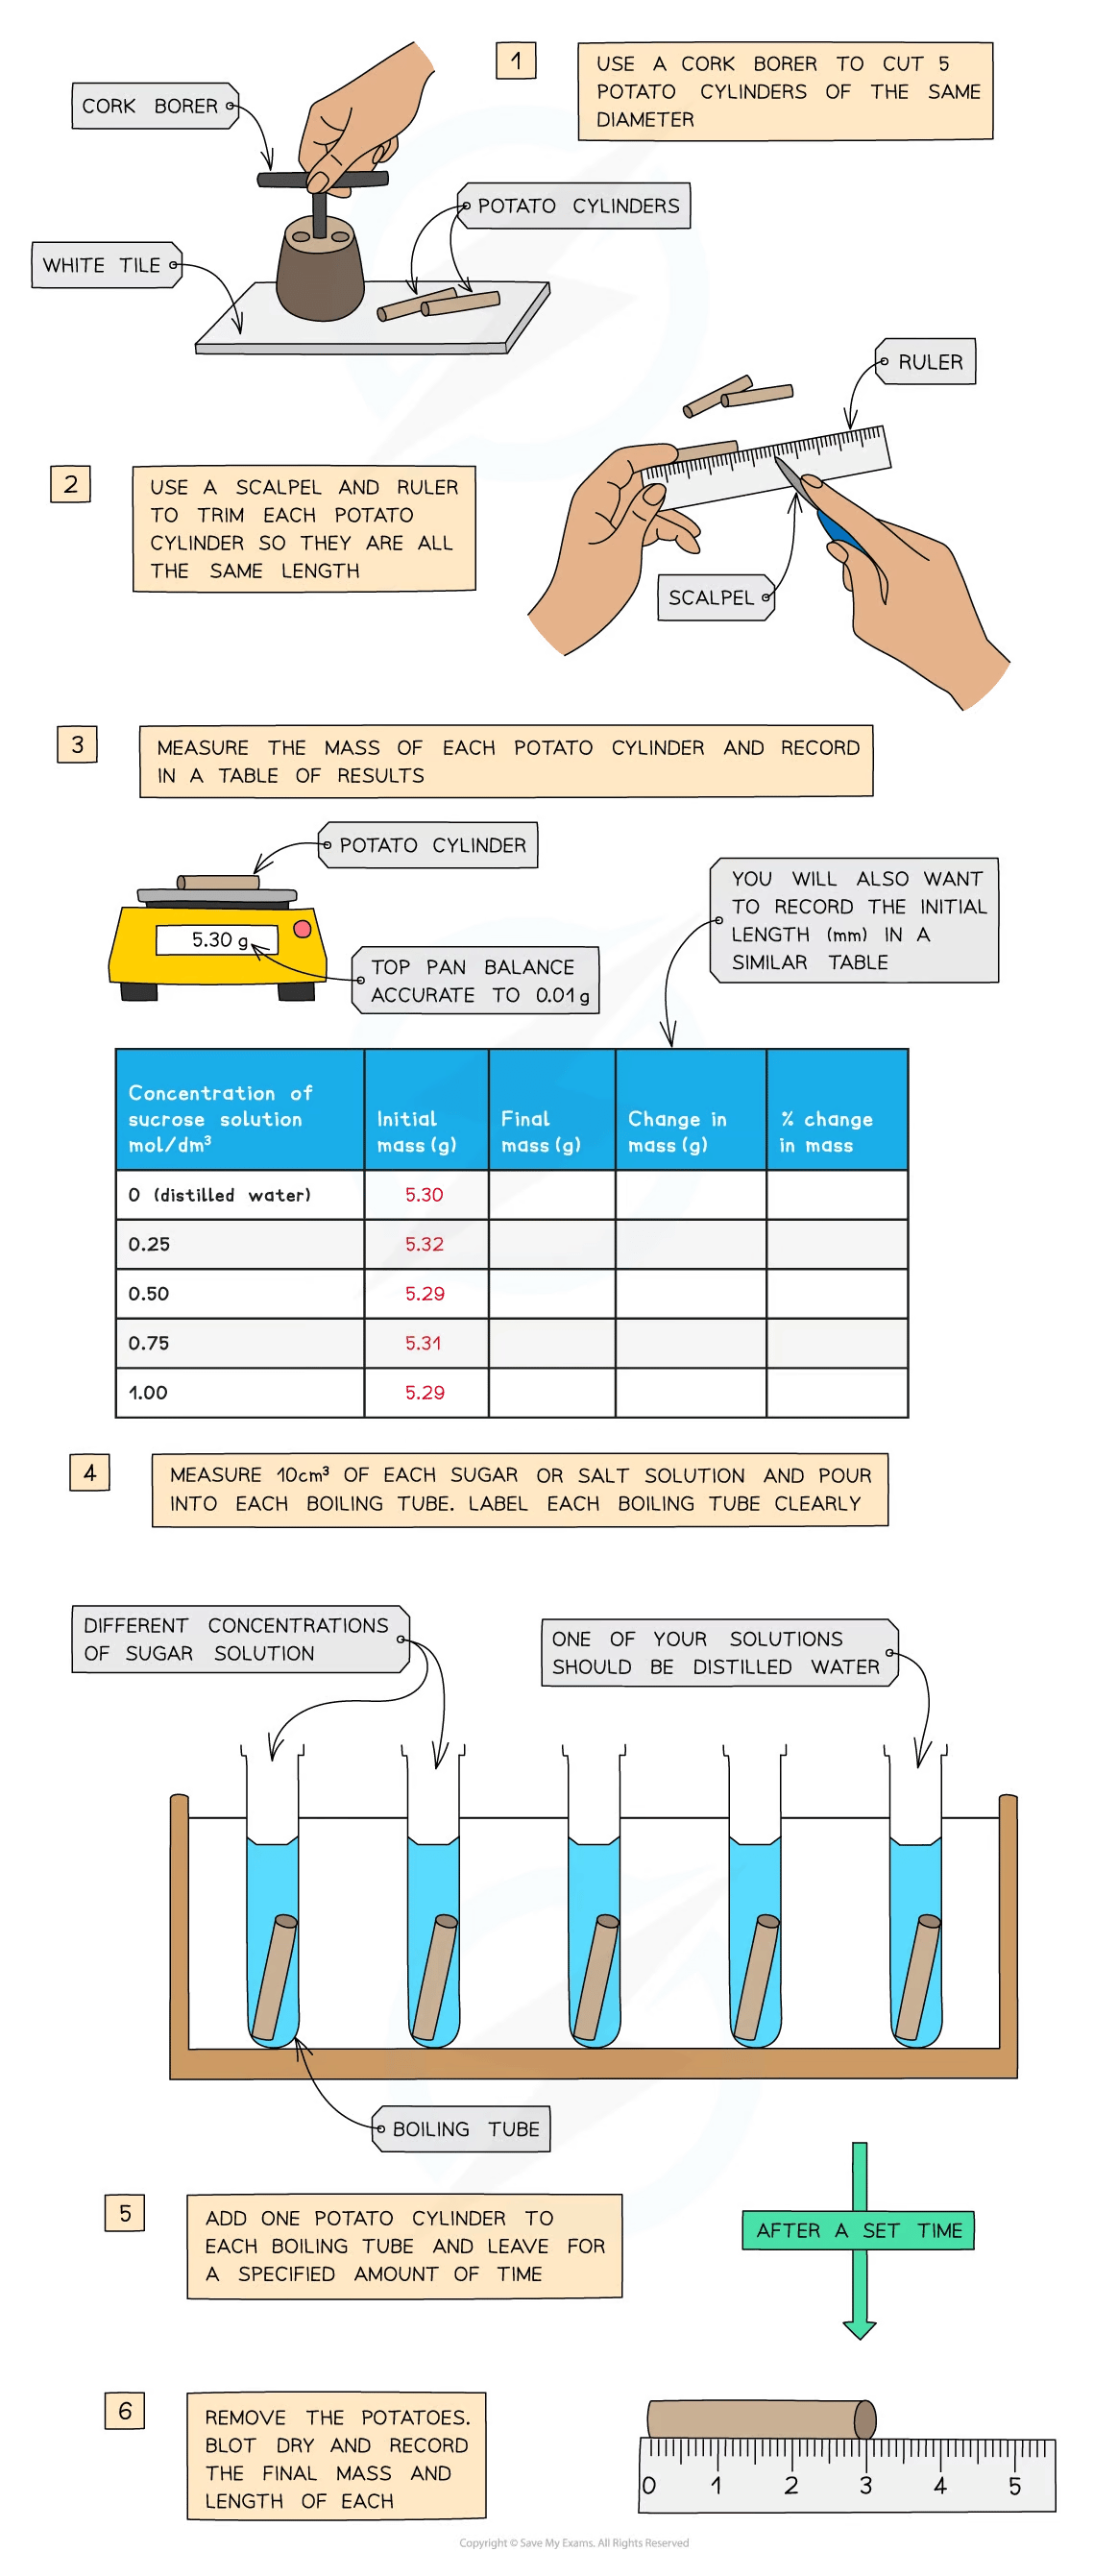
Independent variable:
Concentration of salt or sucrose solution in mol dm-3
Dependent variable:
Mass of each potato cylinder before and after it has been submerged in solution
Percentage change in mass will be calculated using these measurements
Percentage change in mass is used because the cylinders start with slightly different masses, so it lets them be compared fairly
Important control variables are:
type solute in solution
volume of solution
temperature
time for which cylinders are left in solution
effectiveness of blotting dry
Analysing osmosis required practical results
The initial and final potato mass measurements can be analysed to determine the sucrose concentration of the potato tissue itself
Worked Example
Use the results table to determine the approximate sucrose concentration of potato tissue.
Concentration of sucrose solution (mol / dm3) | Initial mass of potato cylinder (g) | Final mass of potato cylinder (g) | Change in mass (g) | Percentage change in mass (%) |
|---|---|---|---|---|
0.00 | 5.30 | 5.80 | +0.50 | 9.4 |
0.25 | 5.32 | 5.42 | +0.10 | |
0.50 | 5.29 | 5.24 | -0.05 | -1.0 |
0.75 | 5.31 | 5.11 | -0.20 | -3.8 |
1.00 | 5.29 | 5.02 | -0.27 | -5.1 |
Step 1: determine the missing percentage change in mass
percentage change = x 100
= x 100
= x 100
= 1.88 %
Step 2: plot a graph of percentage change in mass against sucrose concentration

Step 3: draw a conclusion
The point at which the line of best fit crosses the x axis is:
0.43 mol / dm3
This is the concentration at which there would be no change in mass of the potato cylinder, indicating that the sucrose concentration is the same as the potato cell contents
Reading the osmosis graph
Where results lie above 0 on the y-axis, this means the potato has increased in mass and taken water in from the surrounding solution, via osmosis
Where results lie below 0 on the y-axis, this means the potato has decreased in mass and water has been lost from the potato, via osmosis
Where the line crosses the x-axis, this is the concentration of sugar/salt inside the potato and no water has been lost or gained at this point
Examiner Tips and Tricks
This is an extremely common exam question – you should be able to calculate the percentage change in mass and length and be able to plot a graph of the results.
You may also be presented with a graph to analyse so make sure you understand what this type of graph is showing.

Unlock more, it's free!
Join the 100,000+ Students that ❤️ Save My Exams
the (exam) results speak for themselves:

Was this revision note helpful?
Build on this topic