Free Response Questions (College Board AP® Environmental Science): Exam Questions

30 mins3 questions
1a
1 point

The International Union for Conservation of Nature (IUCN) is composed of scientists that compile a list of the most threatened species that is a critical indicator of the health of the world’s biodiversity. The chart below shows the percent of species that are endangered in four different taxonomic groups.

Horizontal bar chart showing animals: amphibians 41%, mammals 27%, reptiles 21%, birds 12%, with amphibians being the highest proportion.

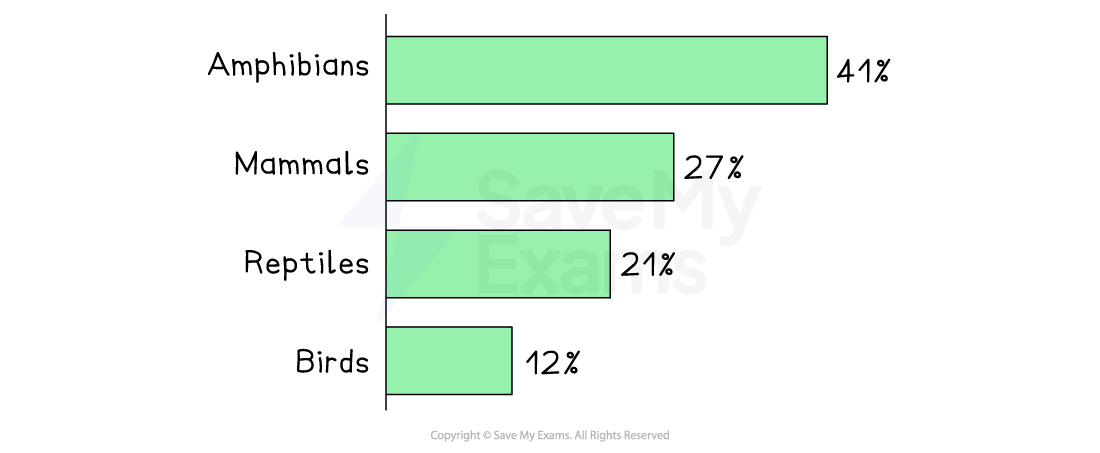
Identify the taxonomic group with the greatest number of species threatened with extinction.

1b
1 point

Most reptile species are r-selected species. Describe the characteristics of an r-selected species.

1c
1 point

Identify an ecological benefit provided by high biodiversity.

1d
1 point

Explain how a loss of genetic diversity could make a population more vulnerable to extinction.

1e
1 point

Describe how habitat fragmentation can lead to loss of species.

1f
1 point

A team of researchers is studying the impact of habitat fragmentation on an endangered reptile species. They want to determine how the size and isolation of habitat patches affect the population density of the reptiles.

Habitat Patch Size (sq km)

Isolation Distance (km)

Population Density (reptiles/sq km)

50

0

120

50

10

85

25

0

95

25

10

60

10

0

75

10

10

40

5

0

50

5

10

20

Identify a hypothesis for the experiment

1g
1 point

Identify an independent variable for the experiment.

1h
1 point

Justify a claim about a conclusion based on the results of the experiment.

1i
1 point

Destruction of habitat for mining mineral resources also poses a threat to reptile species. The waste from the mining process is stored in piles next to the mining site. 

Identify the term for the piles of mining waste.

1j
1 point

Explain how mining waste could threaten reptile biodiversity.

2a
1 point

Scientists at the National Oceanic and Atmospheric Association have been studying atmosphere and ocean water at the Mauna Loa Station in Hawaii since the late 1950’s. The graph below represents the results of decades of monitoring.

Graph of rising atmospheric and seawater CO₂ in the North Pacific from 1958–2024, with seawater pH gradually declining as CO₂ levels increase.

Identify the highest atmospheric CO2 concentration in 2024.

2b
1 point

Explain the trend in atmospheric CO2 since 1958. 

2c
1 point

Describe the relationship between ALOHA seawater CO2 and ALOHA seawater pH.

2d
1 point

A group of researchers conducted an experiment to determine the impact of pH on the weight and thickness of marine organism shells. They placed one each of identical marine snails in tanks with seawater at different pH levels (8.2, 7.8, 7.5, and 7.2) for six months. At the end of the experiment, they measured the shell weight and thickness of each snail for each pH level.

pH

Shell Weight (g)

Shell Thickness (mm)

8.2 (control)

12.4

2.8

7.8

10.8

2.5

7.5

9.2

2.1

7.2

7.5

1.6

Identify the independent variable for the experiment.

2e
1 point

Explain why pH 8.2 is the control for the experiment.

2f
1 point

Describe how the experiment could be modified to improve the validity of the results.

2g
1 point

Describe how the results of the experiment would change if CO2 was pumped into the tanks.

2h
1 point

Explain how a decrease in pH can affect shelled marine organisms.

2i
1 point

In addition to impacting ocean pH, carbon dioxide functions as a greenhouse gas. A local climate scientist claims that methane (CH4) , also a greenhouse gas, poses a greater threat to climate change than CO2.  

Identify an anthropogenic source of methane.

2j
1 point

Justify or refute the claim made by the climate scientist.

3a
1 point

The carbon cycle is the natural process through which carbon is exchanged between the Earth's atmosphere, oceans, soil, and living organisms.

Identify a process shown in the diagram that removes carbon from the atmosphere.

Diagram of the carbon cycle showing reservoirs and transfers between atmosphere, land, plants, animals, oceans, rocks and fossil fuels
3b
1 point

Identify one anthropogenic activity shown in the diagram that adds carbon to the atmosphere. 

3c
1 point

Explain why oil and gas are carbon sinks that store carbon for millions of years. 

3d
1 point

The ocean serves as a carbon sink, capturing and storing carbon in multiple forms. 

Describe how calcium carbonate accumulates and is stored in marine sediments.

3e
1 point

Describe the role of carbon dioxide CO₂ in regulating Earth's climate.

3f
1 point

Carbon is also stored in oceans as dissolved carbon dioxide gas.

Explain how an increase in CO2 affects ocean pH. 

3g
1 point

Explain how this change in pH effects shelled marine organisms like clams and mussels

3h
1 point

Identify one solution to reduce the impact of CO2 dissolving in ocean water.

3i
1 point

Describe an additional advantage of the strategy you described in (h) 

3j
1 point

Another approach to reducing the impacts of CO₂ involves enhancing the ocean’s ability to absorb and store carbon by introducing substances that help neutralize its chemistry.

Identify a substance that could be used to solve this problem.