Distance-Time Graphs (Cambridge (CIE) IGCSE Physics): Revision Note
Exam code: 0625 & 0972

Distance-time graphs
A distance-time graph is used to describe the motion of an object and calculate its speed
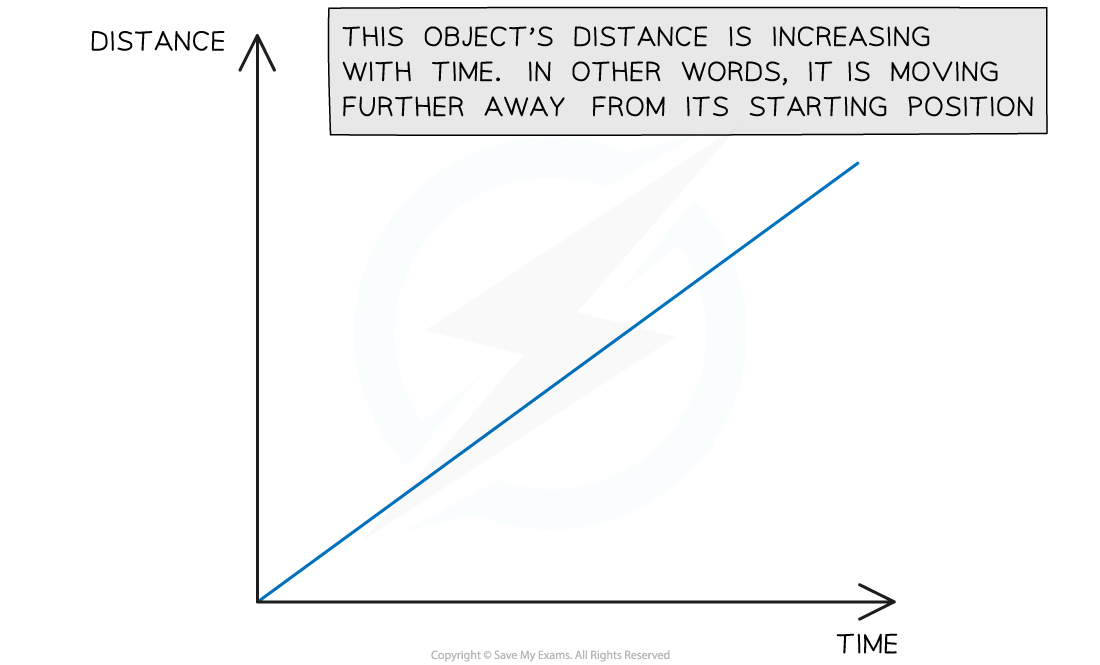
Constant speed on a distance-time graph
If an object is moving at a constant speed, the distance-time graph will be a straight line
If the constant speed is zero, the line will be horizontal
If the constant speed is non-zero, the line will have a gradient
If an object has a speed of zero, the object is stationary
The distance moved by the object over time is zero
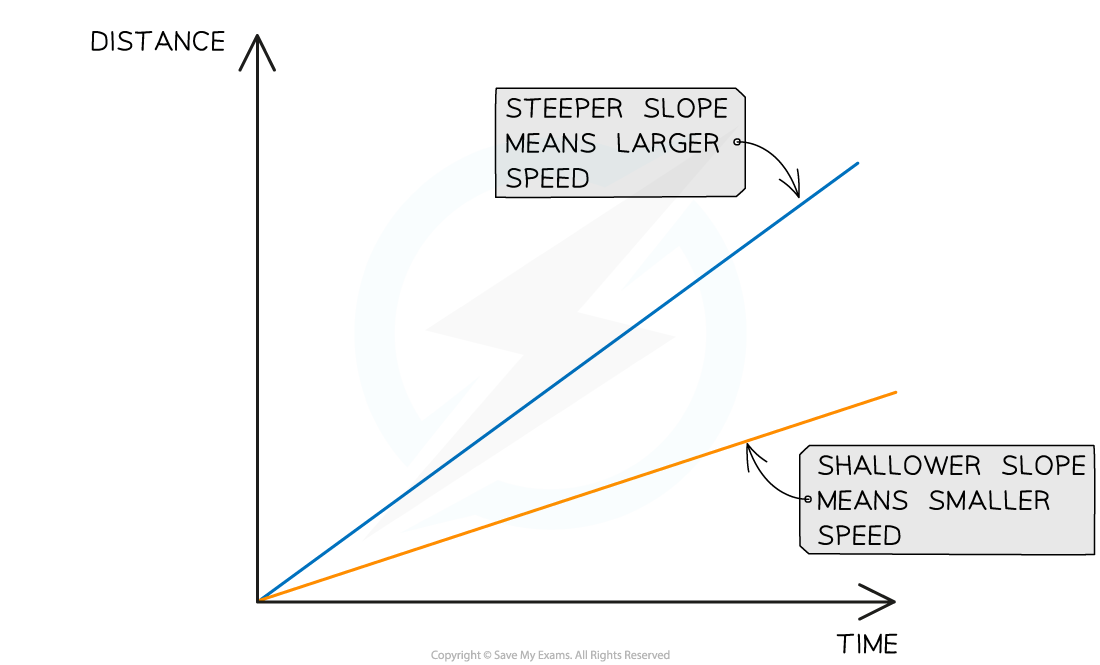
The gradient of a distance-time graph represents the speed of the object
A steeper slope, or a higher gradient, represents a greater speed
A shallower slope, or a lower gradient, represents a slower speed
Different speeds on a distance-time graph
Changing speed on a distance-time graph
Often, the speed of an object is not constant
If the speed of an object is changing, the object is accelerating
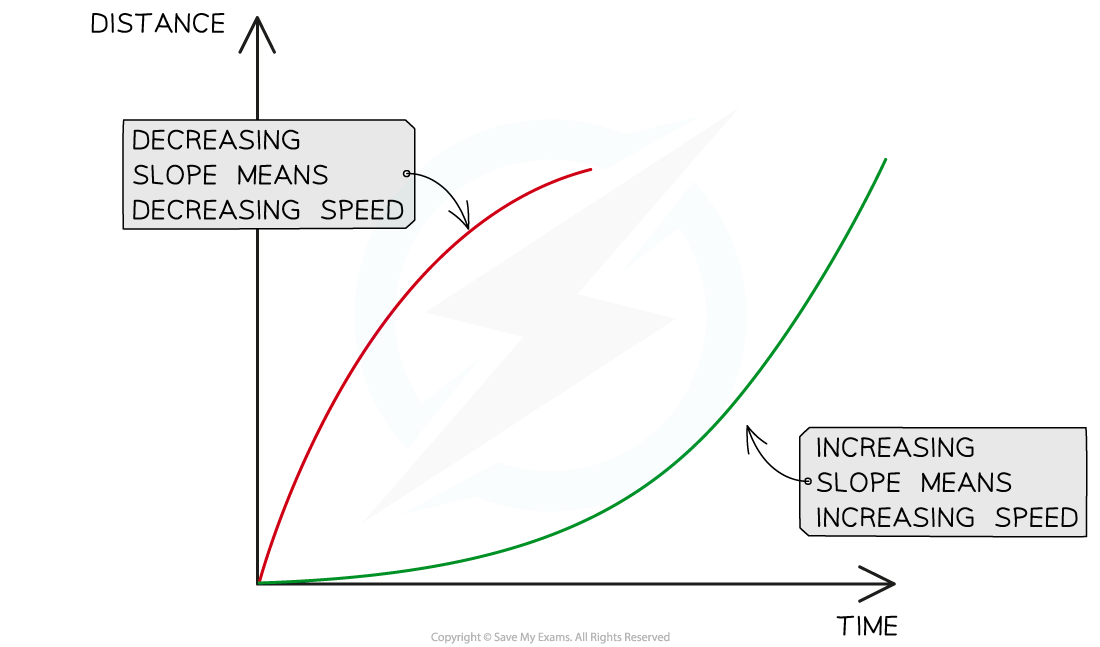
If an object is accelerating, the distance-time graph will be a curved line
A curve on a distance-time graph is a changing gradient
If the gradient increases over time, the speed is increasing over time
If the gradient decreases over time, the speed is decreasing over time
Speed of an object increasing and decreasing on a distance-time graph
Plotting a distance-time graph
Follow these steps to plot a distance-time graph from data:
Label the x-axis with time and the y-axis with distance
Choose sensible scales so that the graph occupies more than half of the graph grid
Use the data given to plot points on the graph
Join the points with straight lines if speed is constant, or curves if the speed is changing
Examiner Tips and Tricks
You could be asked to describe the motion of an object from data given in a question. You can read more about the use of graphs in exams in the article Graph skills for GCSE Physics
Using distance-time graphs
The speed of a moving object can be calculated from the gradient of the line on a distance-time graph:
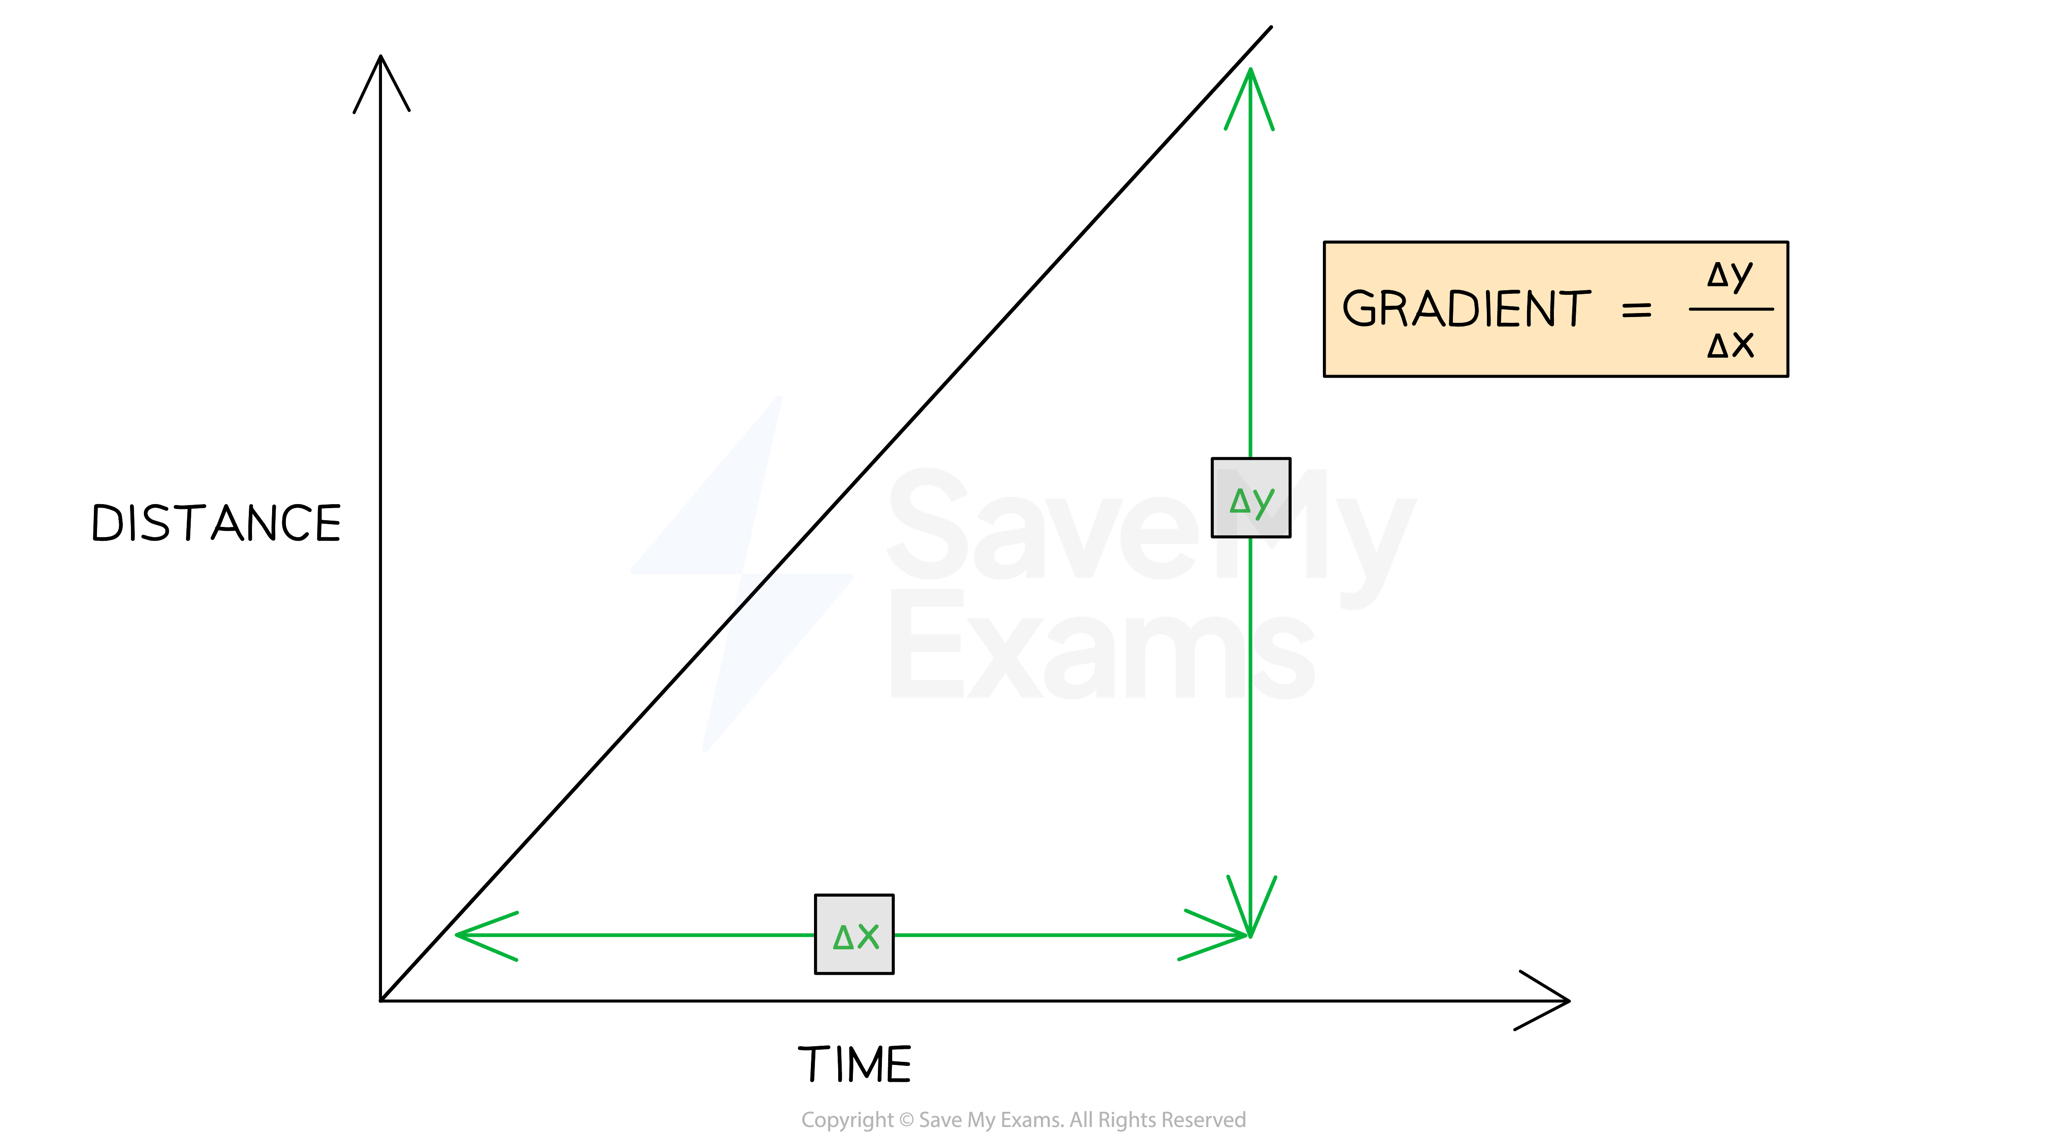
is the change in y (distance) values
is the change in x (time) values
Worked Example
A distance-time graph is drawn below for part of a train journey. The train is travelling at a constant speed.
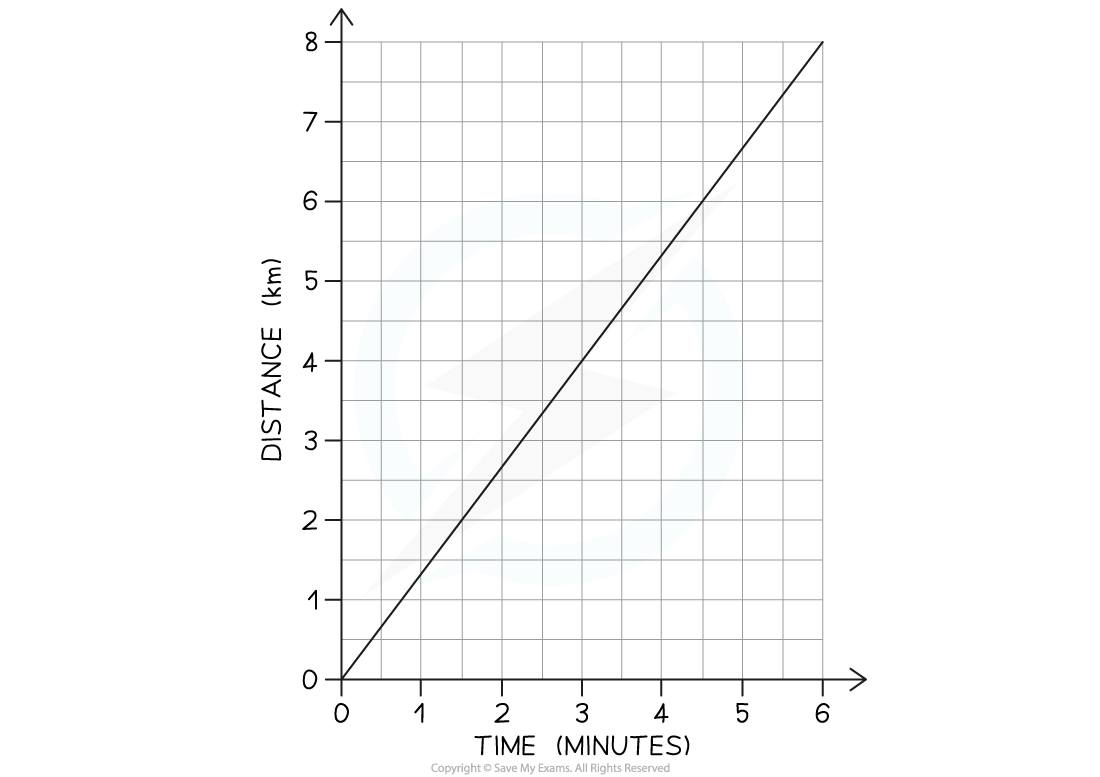
Calculate the speed of the train.
[4]
Answer:
Step 1: Draw a large gradient triangle on the graph
The image below shows a large gradient triangle drawn with dashed lines
and are labelled, using the units as stated on each axis [1 mark]
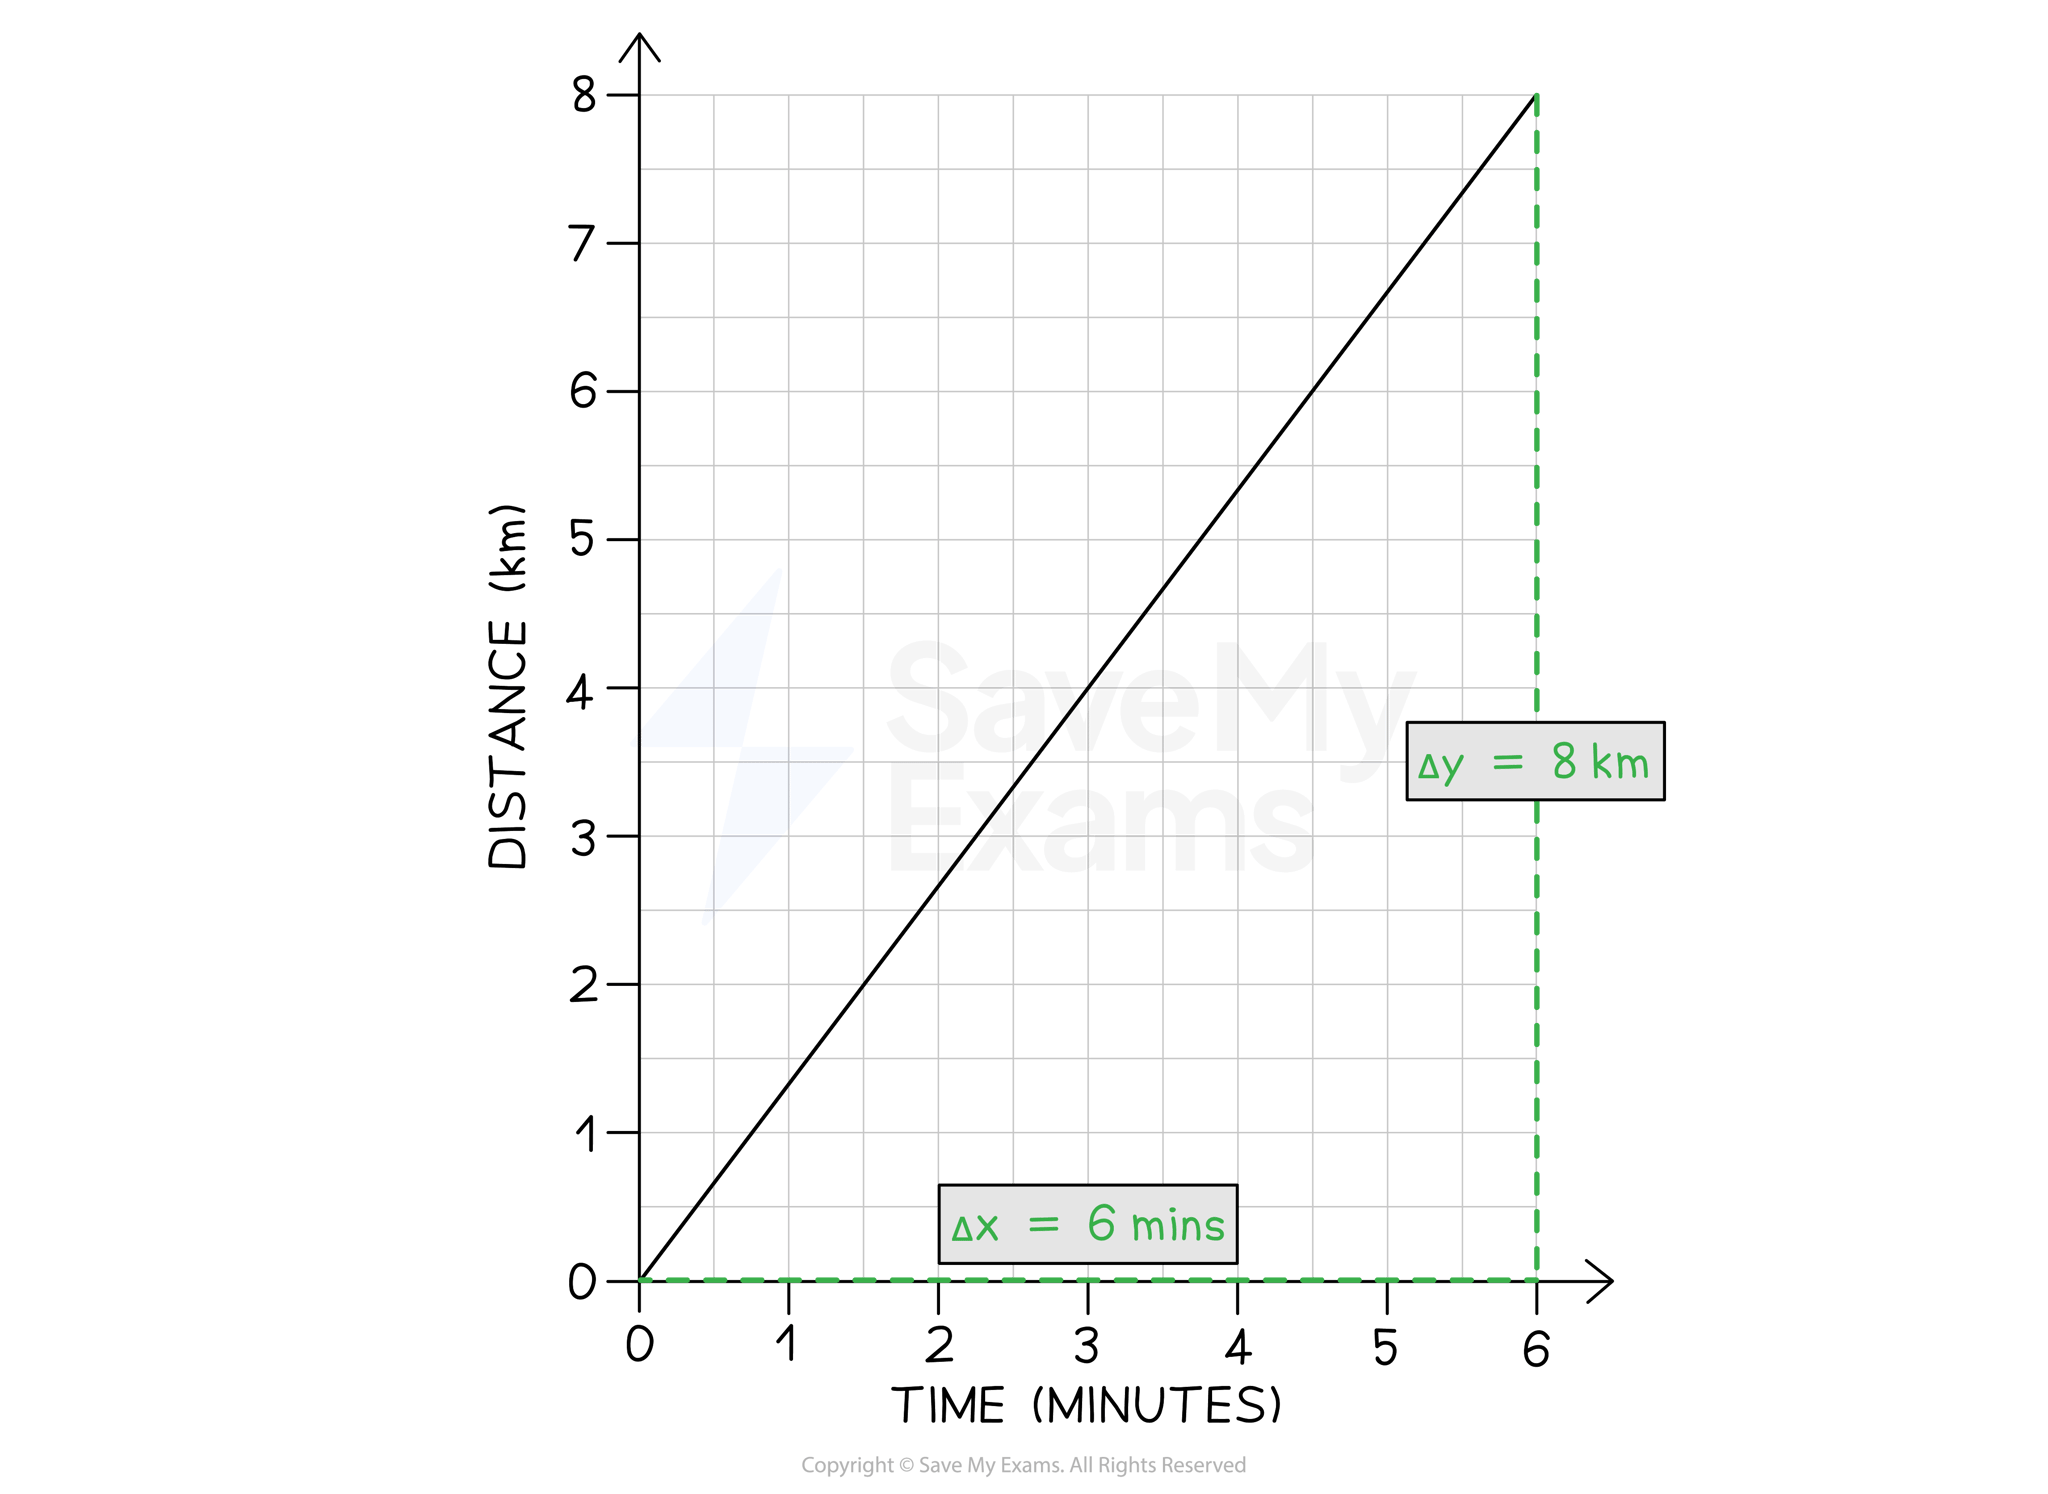
Step 2: Convert units for distance and time into standard units
The distance travelled,
AND
The time taken, [1 mark]
Step 3: State that speed is equal to the gradient of a distance-time graph
The gradient of a distance-time graph is equal to the speed of a moving object:
[1 mark]
Step 4: Substitute values to calculate the speed
[1 mark]
Worked Example
A student decides to take a stroll to the park. They find a bench in a quiet spot, take a seat, and read a book on black holes. After some time reading, the student realises they lost track of time and runs home.
A distance-time graph for the trip is drawn below.
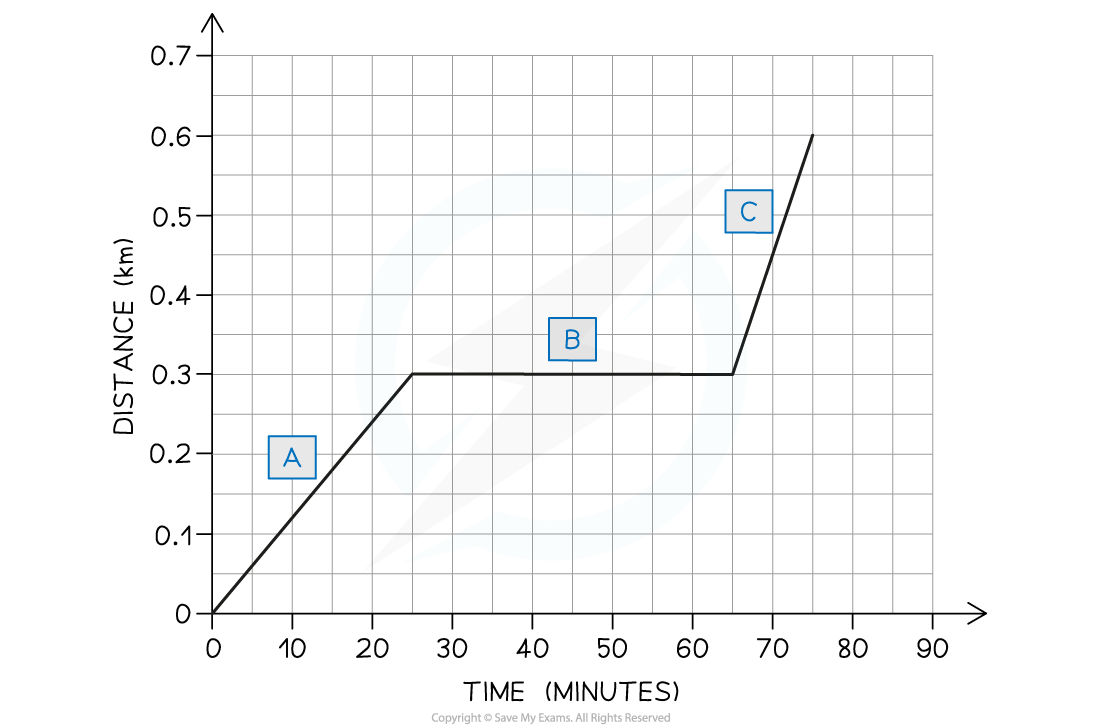
(a) How long does the student spend reading the book? [1]
(b) Which section of the graph represents the student running home? [1]
(c) What is the total distance travelled by the student? [2]
Answer:
Part (a)
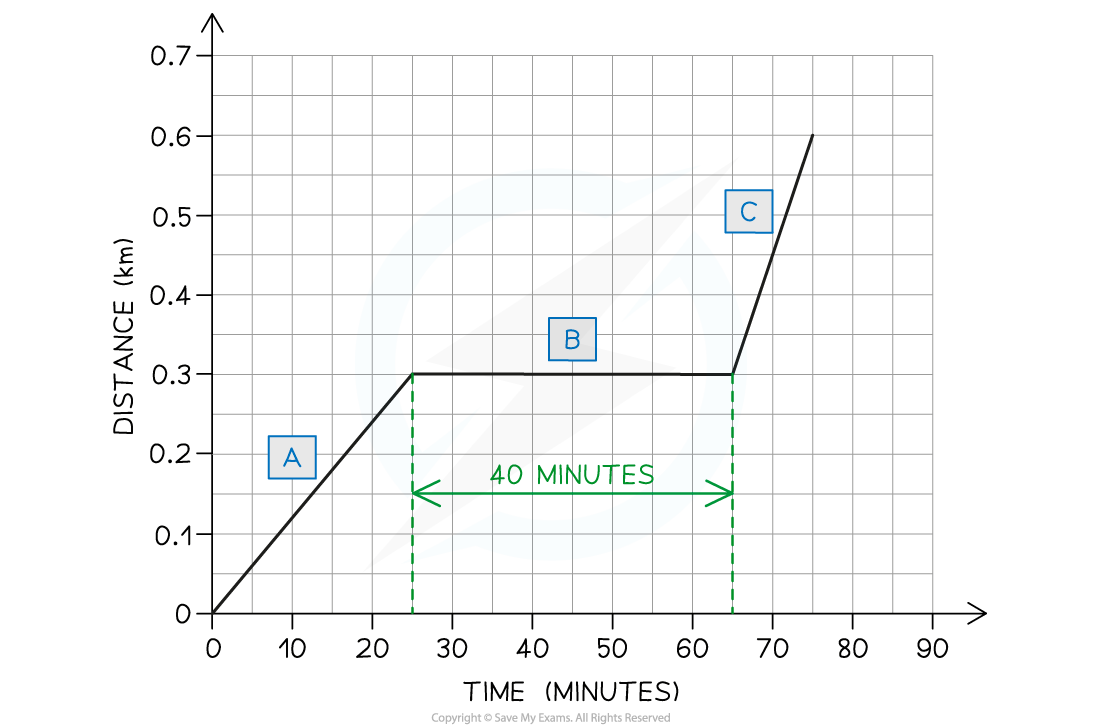
The student spends 40 minutes reading their book
The flat section of the line (section B) represents an object which is stationary, so section B represents the student sitting on the bench reading
This section lasts for 40 minutes [1 mark]
Part (b)
Section C represents the student running home
The slope of the line in section C is steeper than the slope in section A
This means the student was moving at a faster speed (running) in section C [1 mark]
Part (c)
The student initially travels a distance of 0.3 km in section A [1 mark]
The student will run another 0.3 km to return home in section C
Therefore, the total distance travelled by the student is 0.6 km [1 mark]
Examiner Tips and Tricks
Draw the largest gradient triangle possible within the straight section the question asks about. Examiners award credit for seeing the triangle drawn on the graph itself. Do not use the whole line if the graph has more than one section.
Remember to check the units on each axis. These may not always be in standard units; in our example, the unit of distance was km and the unit of time was minutes. Double-check which units to use in your answer.

Unlock more, it's free!
Join the 100,000+ Students that ❤️ Save My Exams
the (exam) results speak for themselves:

Was this revision note helpful?
Build on this topic