Describing Graphs & Trends (Cambridge (CIE) IGCSE Biology): Revision Note
Exam code: 0610 & 0970

How to describe the trend in a graph
When a question asks you to describe a graph or a set of results, say what the data show
Avoid explaining why the data look like this
Read as much of the data as you have been asked to consider; not more and not less
Some questions may ask you to describe an entire data set
You will lose marks if you miss out part of the pattern
Other questions may only require you to look at data points between, e.g. certain times or temperatures
You will waste time if you extend your description beyond these points
A complete description usually has three parts:
The overall trend, e.g. as the temperature increases, the rate of enzyme activity increases
Any change in the pattern, e.g. the line levels off, reaches a peak or starts to curve
Figures from the graph or table, with their units, to support what you say
Useful words for describing a pattern include:
"increases at a constant rate", for a straight line
"increases more quickly" or "increases more slowly", for a curve
"levels off" or "stays constant at…", for a line that becomes flat
"reaches a maximum of …, then decreases", for a peak
Examiner reports show that students lose marks by:
stating that two quantities are directly proportional just because one increases when the other increases
A directly proportional relationship is shown by a straight line through the origin
describing only part of the graph
Worked Example
A student measured the number of bubbles of oxygen released per minute by pond weed at different light intensities. Their results are shown in the graph below.
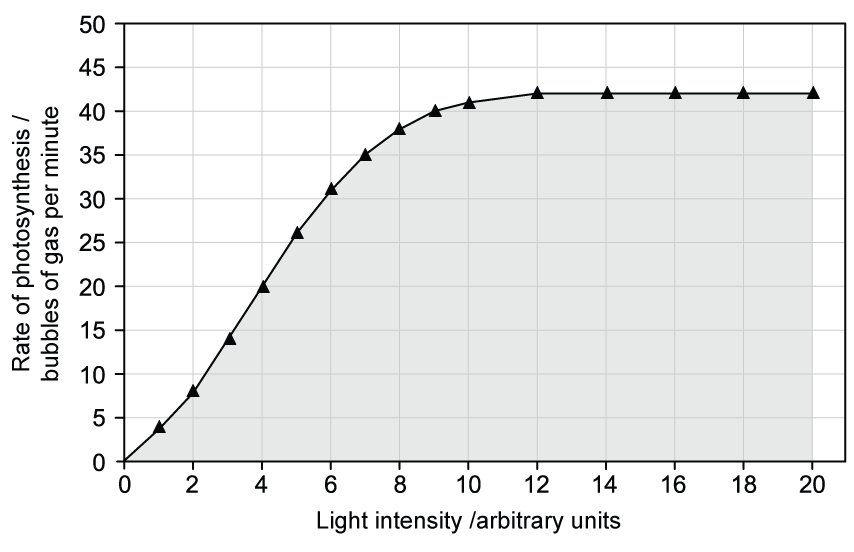
Describe the results.
[3]
One-mark answer:
As the light intensity increases, the number of bubbles increases [1 mark]
Full-mark answer:
As light intensity increases, the number of bubbles released per minute increases [1 mark]
It increases from (approximately) 4 bubbles per minute at 1 unit to (approximately) 42 bubbles per minute at 12 units [1 mark]
Above 12 units, the number of bubbles stays constant at (approximately) 42 bubbles per minute [1 mark]
Examiner Tips and Tricks
The one-mark answer gives the overall trend, but does not describe what happens above 40 units, and quotes no figures.
The full-mark answer gives the trend, supports it with figures and describes the change in the pattern at the end.
Reading values from a graph
When reading data points from graphs, be sure to:
check the scale on each axis
convert any values if necessary, e.g. minutes to seconds
determine what one small square is worth, as it is not always 1
read values to an accuracy of half a small square
use a ruler to draw lines from the axis to the graph line and across to the other axis, so you read the value accurately
Leave these lines on the graph so the examiner can see what you did
Examiner reports show that students lose marks by:
reading the wrong value from the graph
not checking the scale on each axis
forgetting to convert a value read from the graph into the unit needed, e.g. minutes into seconds
Examiner Tips and Tricks
Before reading any value, write down what one small square is worth on each axis. It takes a few seconds and stops the most common reading errors.
Quoting data from graphs & tables
Marks are often available for quoting figures from a graph or table
A quoted figure must include:
the value, read as accurately as the scale allows
the unit, taken from the Y axis label or the table heading for the dependent variable
the independent variable at which it applies, e.g. "at 30 °C" or "after 20 s"
When you describe an increase or a decrease, say how much a quantity changes, not just that it changes
E.g. "it increases from 12 mm to 48 mm", not "it increases a lot"
When you compare two sets of data, quote a pair of values from each set
Examiner Tips and Tricks
For a 3-mark "describe the results" question, check that you have given the trend, quoted figures with units and described any change in the pattern. If one of these is missing, you have probably not finished.

Unlock more, it's free!
Join the 100,000+ Students that ❤️ Save My Exams
the (exam) results speak for themselves:

Was this revision note helpful?