Stretches of Graphs (Edexcel IGCSE Maths A: Higher): Revision Note
Exam code: 4MA1

Stretches of graphs
What are stretches of graphs?
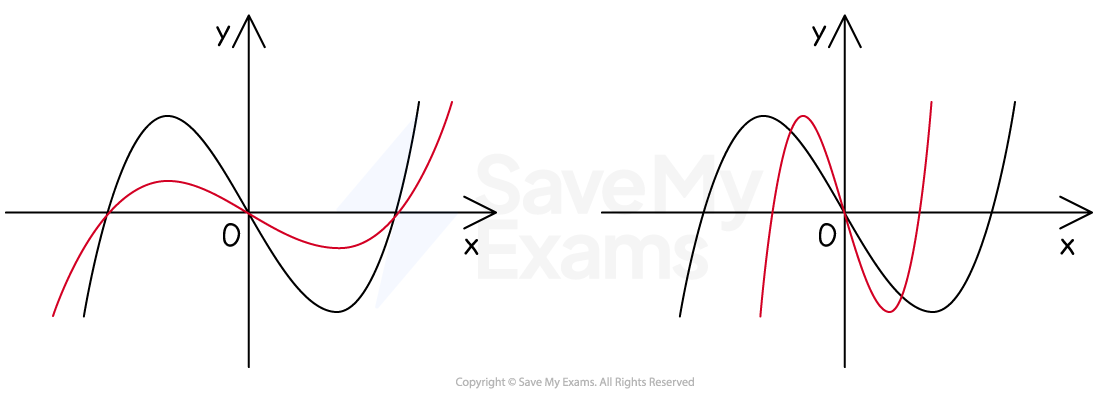
Stretches of graphs are a type of transformation that pushes points away from, or towards, the -axis or -axis
Graphs look like they have been stretched or squashed
either horizontally or vertically
How do I stretch graphs?
Let be the equation of the original graph
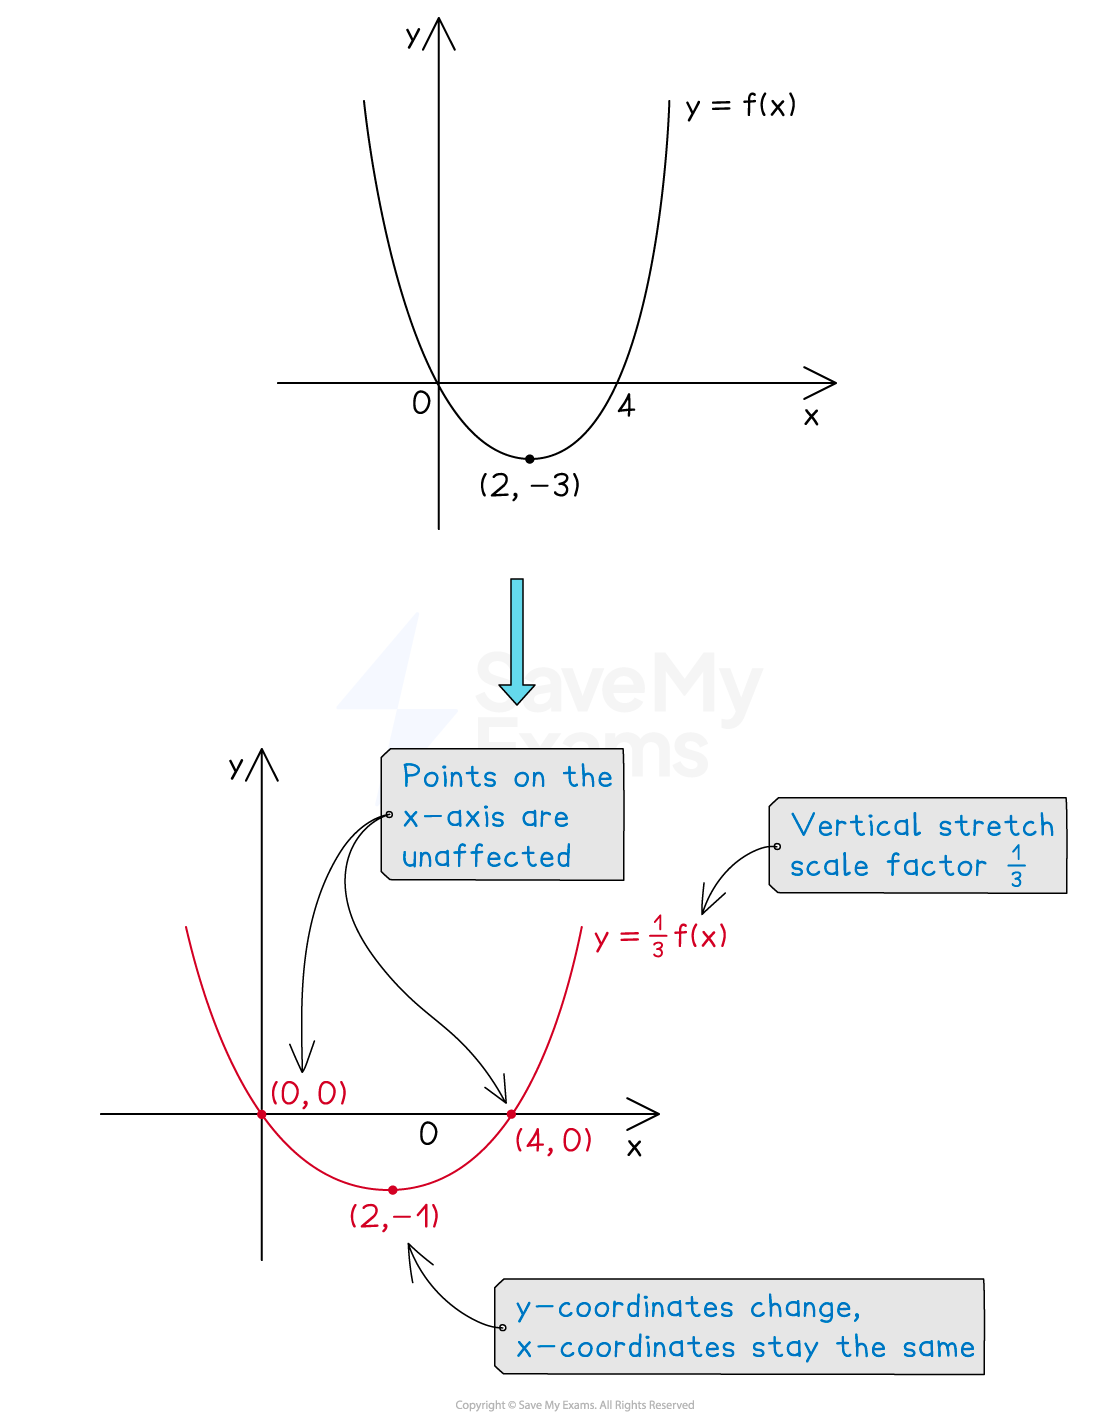
Vertical stretches: y=af(x)
is a vertical stretch (in the -direction) of scale factor
The -coordinates stay the same but the coordinates are multiplied by
Points appear to move parallel to the -axis
either stretching vertically away from the -axis if
or squashing vertically towards the -axis if
Points on the -axis stay where they are
Horizontal stretches: y=f(ax)
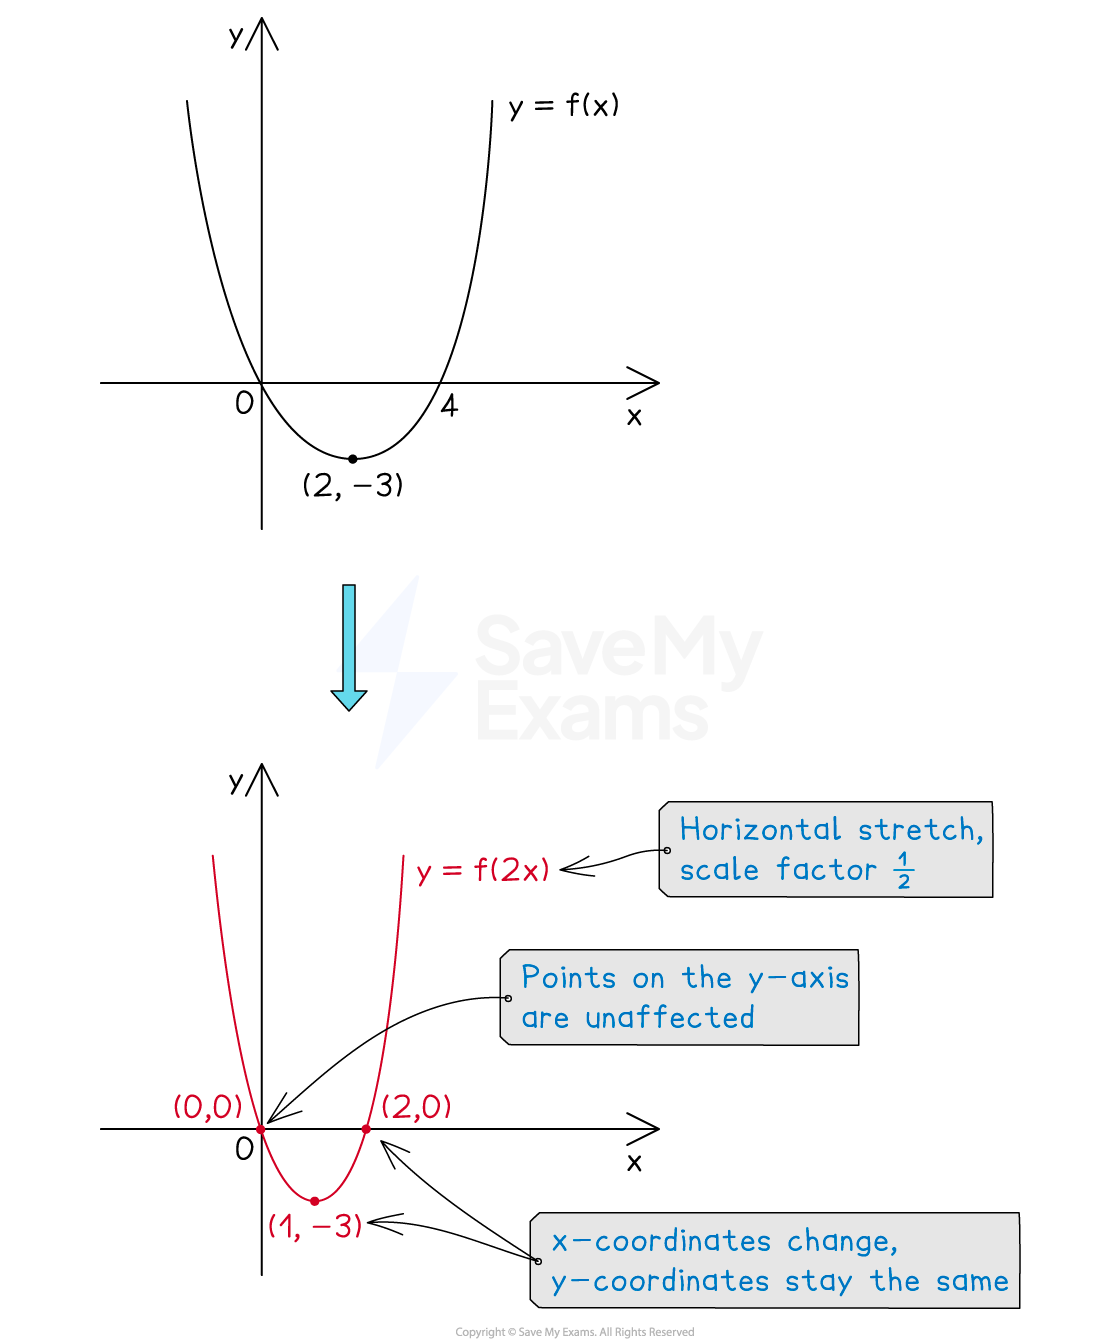
is a horizontal stretch (in the -direction) of scale factor (not )
The -coordinates stay the same but the coordinates are multiplied by (divided by )
Points appear to move parallel to the -axis
either squashing horizontally towards the -axis if
or stretching horizontally away from the -axis if
Points on the -axis stay where they are
This means is more like a horizontal squash of scale factor 2
though the correct way to say this is a horizontal stretch of scale factor
This also means that is a horizontal stretch of scale factor 2
What happens to asymptotes when a graph is stretched?
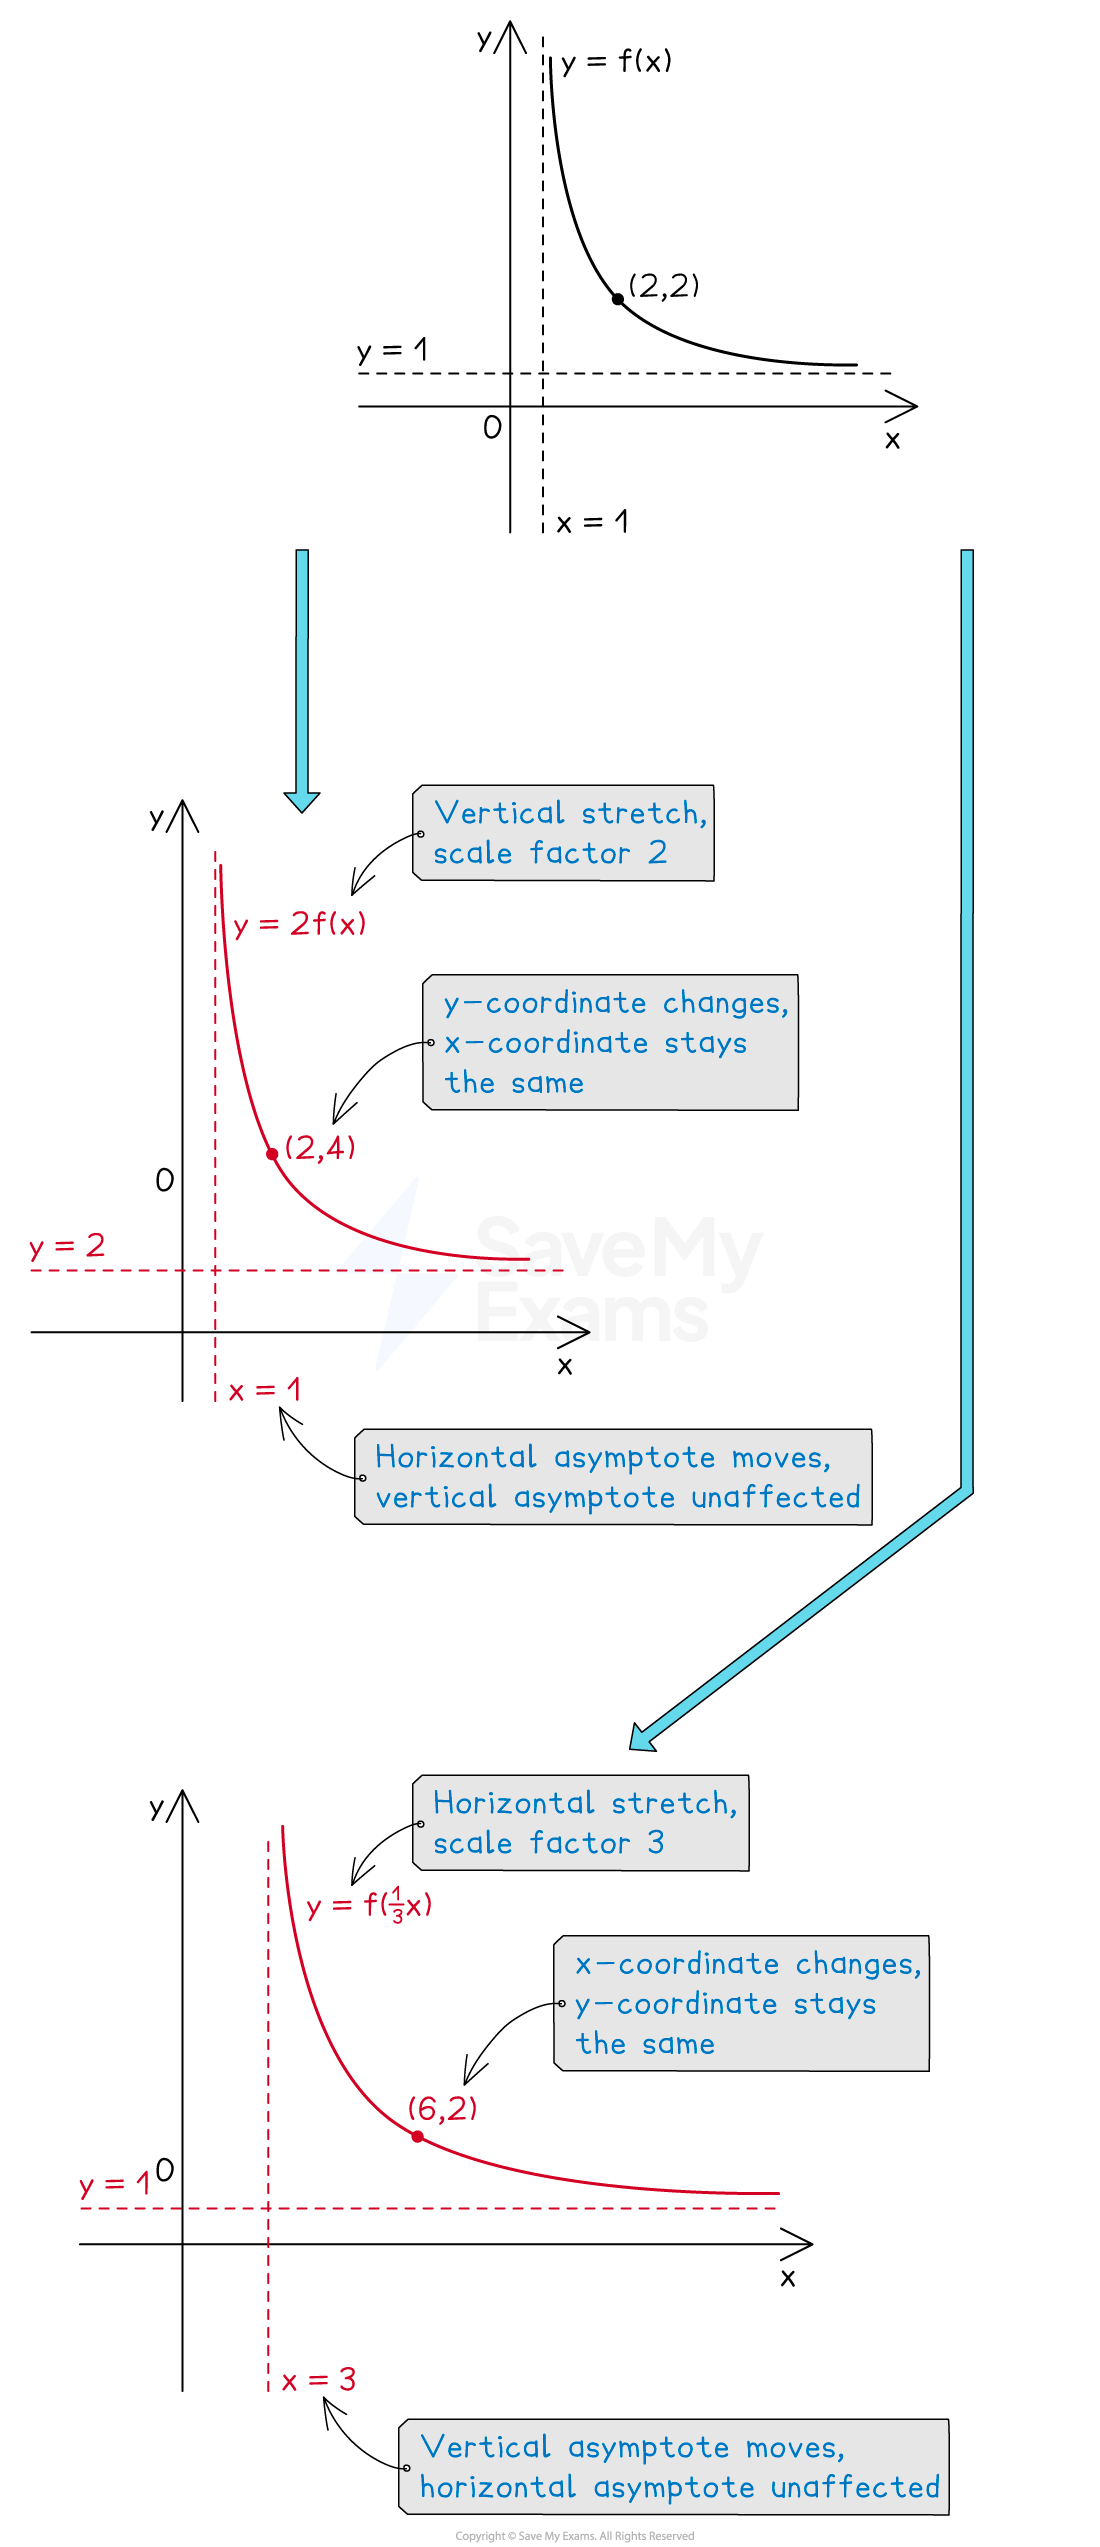
Any asymptotes of are also stretched
How does a stretch affect the equation of the graph?
When a graph is stretched, you can change its equation algebraically
There is no need to sketch the graph
Stretching vertically by a scale factor of 3 puts a 3 in front of the whole equation
For example, becomes
This simplifies to
Stretching horizontally by a scale factor of ("squashing horizontally" by a scale factor of 3) replaces any with in the equation
For example, becomes
This simplifies to
How do I apply a combined stretch?
The graph of is a combined stretch, both horizontally and vertically
It does not matter which order you apply these in
For example, a horizontal stretch of scale factor followed by a vertical stretch of scale factor
Worked Example
The diagram below shows the graph of .
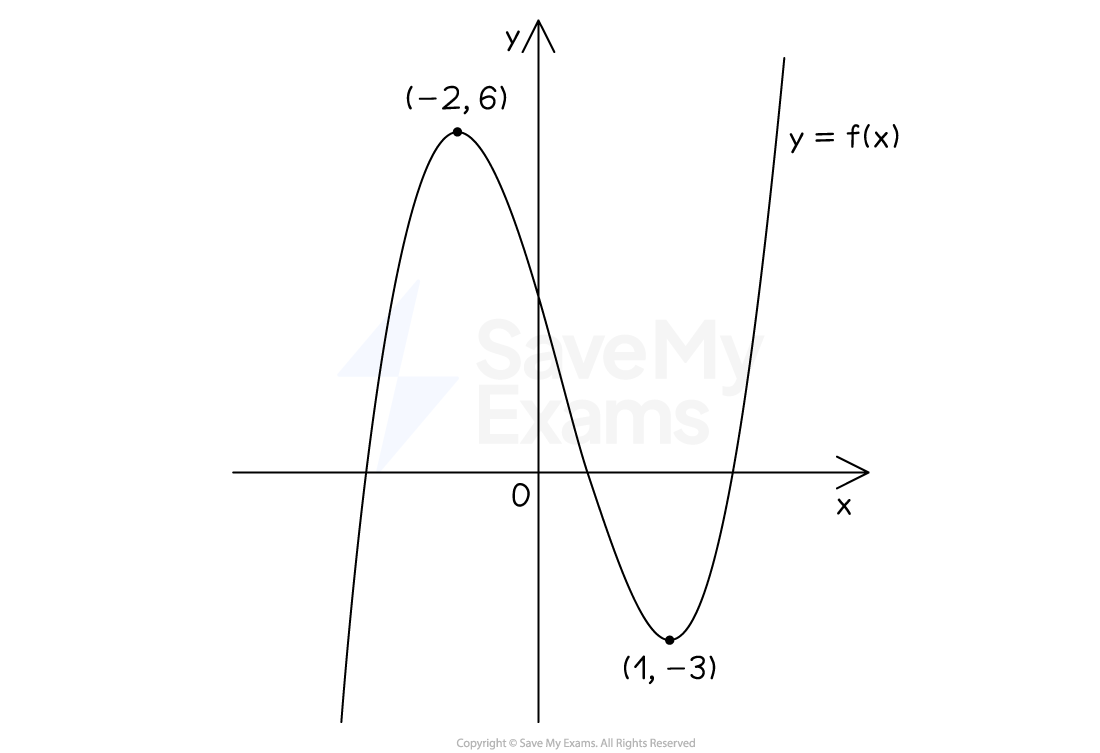
Sketch the graph of .
Answer:
represents a horizontal stretch of scale factor
And represents a vertical stretch of scale factor 2
Apply these in any order, e.g. start with the horizontal stretch, scale factor 3
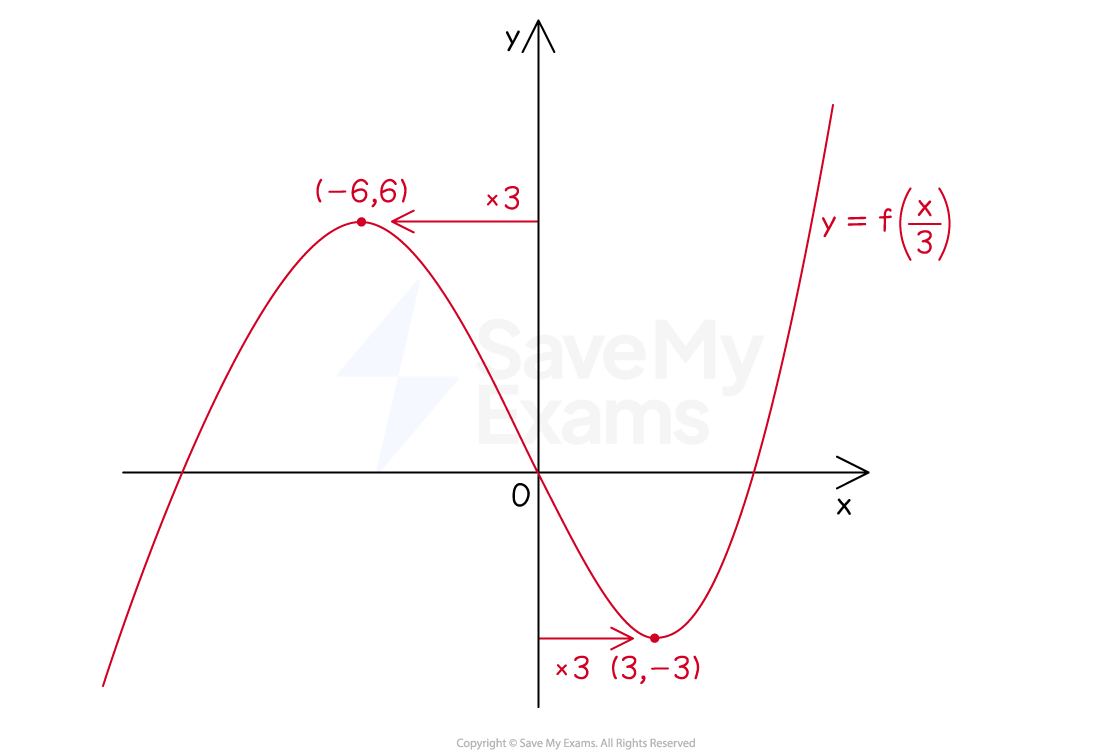
Now apply a vertical stretch of scale factor 2
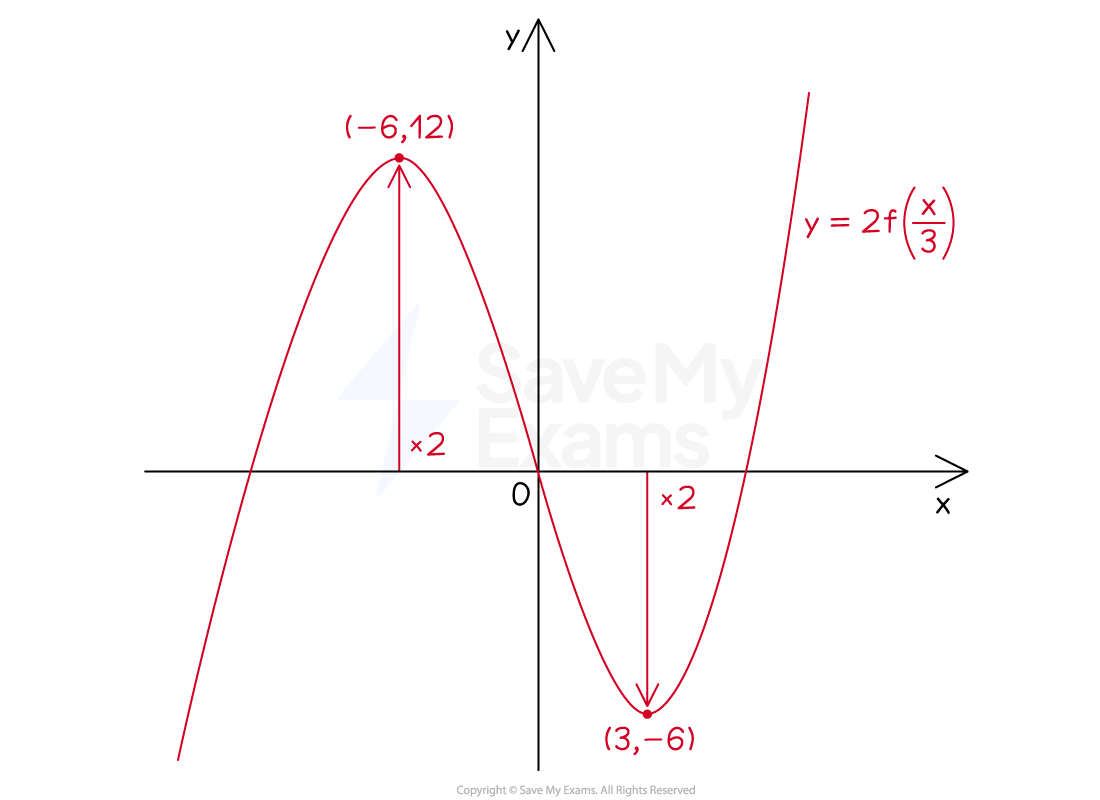
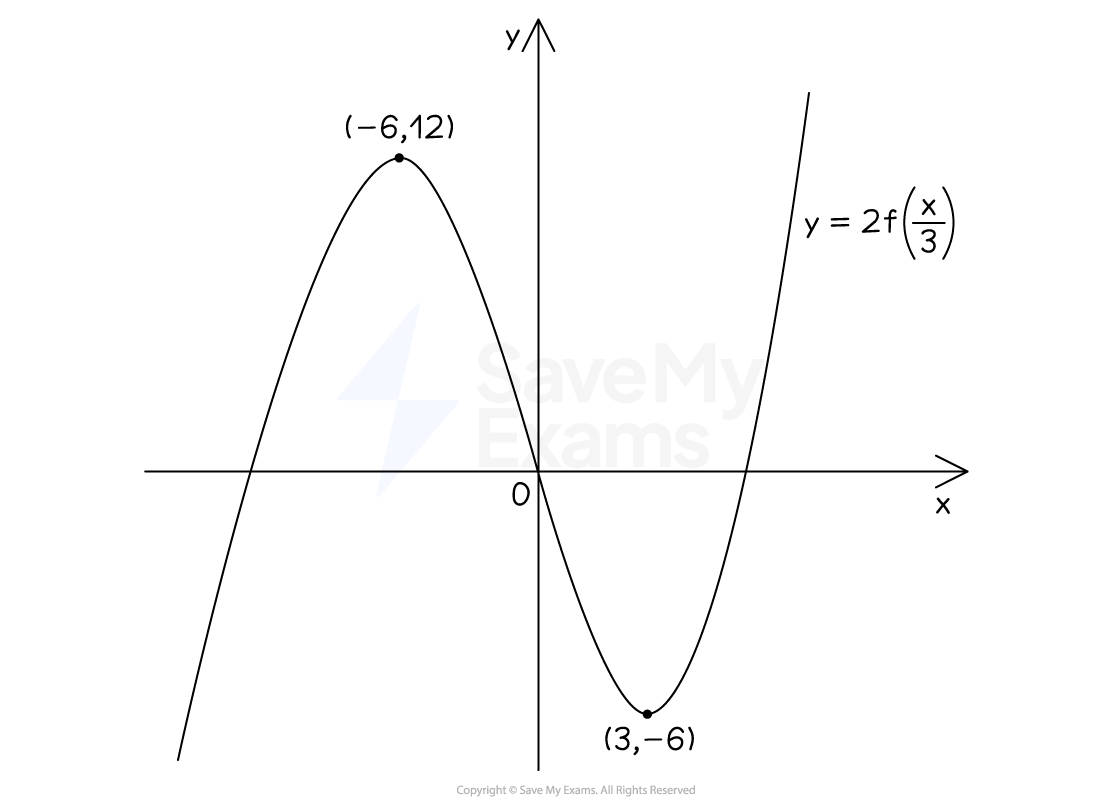
Show the coordinates of the new points clearly

Unlock more, it's free!
Join the 100,000+ Students that ❤️ Save My Exams
the (exam) results speak for themselves:

Was this revision note helpful?
Build on this topic
Questions students ask about Stretches of Graphs
Real questions from students revising this topic on Save My Exams
How do you know if a horizontal stretch f(ax) stretches or squashes a graph?
For y = f(ax) the scale factor is 1/a, not a — so a > 1 squashes the graph towards the y-axis, and 0 < a < 1 stretches it away from the y-axis.
- Every x-coordinate is multiplied by 1/a (divided by a); the y-coordinates stay the same
- Points on the y-axis do not move
- f(2x): a = 2, so the scale factor is ½ — a squash
- f(x/3): a = ⅓, so the scale factor is 3 — a stretch
Two different graphs on this page:
- On the parabola with minimum (2, −3) and roots at 0 and 4, y = f(2x) sends the minimum to (1, −3) and the root at x = 4 to x = 2, so that curve is half as wide
- On the separate cubic with maximum (−2, 6) and minimum (1, −3), y = f(x/3) sends those points to (−6, 6) and (3, −3), so that curve is three times as wide
A number inside the bracket does the opposite of what you expect. Even when it looks squashed, the correct wording is still “a horizontal stretch of scale factor ½”.
How does a vertical stretch af(x) affect the y-coordinates of a graph?
A vertical stretch y = af(x) multiplies every y-coordinate by the scale factor a, so a point at height y moves to height a × y.
- y = af(x) is a vertical stretch of scale factor a, so (x, y) becomes (x, a × y)
- The x-coordinates stay exactly the same
- Points on the x-axis stay put, because a × 0 = 0
- A negative y-coordinate gets multiplied too, so it moves further below the x-axis
Example using this page's graph: y = f(x) has a minimum at (2, −3) and crosses the x-axis at 0 and 4.
For y = 3f(x):
- Minimum: (2, 3 × (−3)) = (2, −9), so it drops by 6, not by 3
- The roots stay at (0, 0) and (4, 0)
For y = ⅓f(x), the version drawn on this page:
- Minimum: (2, ⅓ × (−3)) = (2, −1), squashed towards the x-axis
Moving the graph down by 3 would be a different transformation, y = f(x) − 3.
What is the equation of a graph if its width is doubled?
Doubling the width is a horizontal stretch of scale factor 2, so the new graph is y = f(x/2), also written y = f(½x).
- For y = f(ax) the scale factor is 1/a
- You want a scale factor of 2, so 1/a = 2 and a = ½
- Every x-coordinate is doubled; the y-coordinates stay the same
- Do not write f(2x) — that halves the width
Example using this page's graph: y = f(x) has a minimum at (2, −3) and roots at x = 0 and x = 4. For y = f(x/2), the minimum is (4, −3) and the roots are x = 0 and x = 8.
With an equation: replace every x with (x/2).
- y = x² + 2x becomes y = (x/2)² + 2(x/2) = ¼x² + x
- Check: the original roots are x = 0 and x = −2; the new roots are x = 0 and x = −4, so the width really has doubled