Measuring Human Development (DP IB Global Politics: HL): Revision Note

What is human development?
Human development refers to the expansion of people's freedoms and opportunities, beyond simply measuring economic output
A range of indices have been developed to measure different aspects of human development, including health, education, living standards, inequality and wellbeing
The most widely used is the Human Development Index (HDI), produced by the United Nations Development Programme (UNDP)
Other key measures include the Human Poverty Index (HPI), the Multidimensional Poverty Index (MPI), the Gini Index and the Happy Planet Index
Each measure has strengths and limitations
No single index fully captures the complexity of human development
Human Development Index (HDI)
The Human Development Index is a measure of a state's development based on life expectancy, education and income levels
It is used by the UN Development Programme and other actors because it offers a composite index of human development
In considering factors beyond economic growth, it indicates people’s capability to lead:
long healthy lives measured by life expectancy at birth
lives enriched with opportunities to learn measured by years of schooling
decent standard of living measured by gross national income (GNI)
How HDI is determined
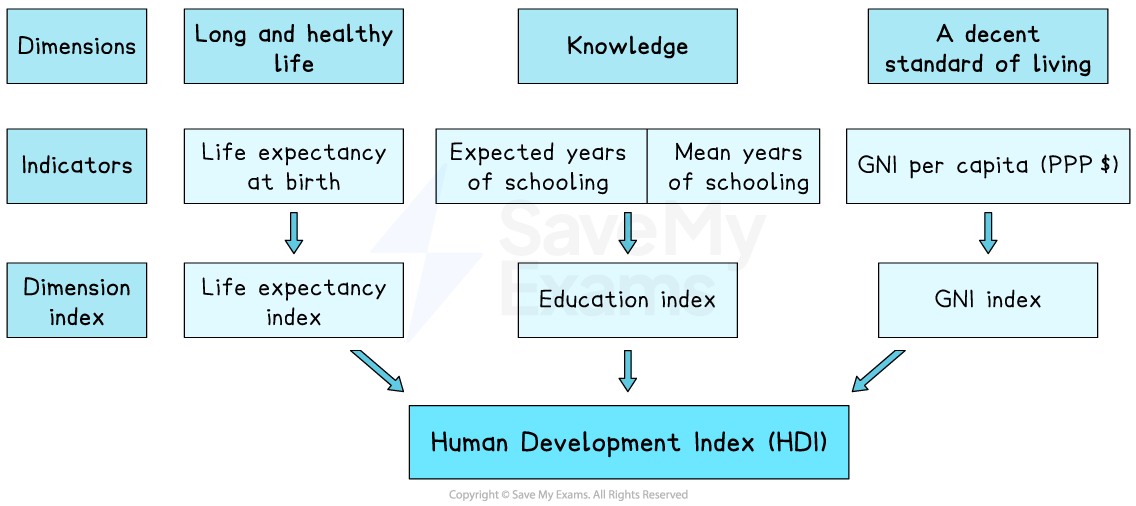
1. Long and healthy life
Measured using life expectancy at birth
This is turned into a life expectancy index
It shows how healthy a population is
2. Knowledge (education)
Measured using:
Expected years of schooling
Mean years of schooling
These are combined into an education index
It shows access to and quality of education
3. A decent standard of living
Measured using GNI per capita (PPP $)
This becomes the GNI index
It shows average income and living standards
2025 HDI rankings
Highest HDI rankings | Lowest HDI rankings |
|---|---|
|
|
Amartya Sen’s Capability Approach
Sen supports the idea that true development goes beyond economic growth by enabling people to have the freedom to reach their full potential
His ideas support the use of more complex measurements such as the HDI
Human Poverty Index (HPI) and Multidimensional Poverty Index (MPI)
The Human Poverty Index (HPI) was introduced by the United Nations Development Program in 1997
It was later replaced by the Multidimensional Poverty Index (MPI) in 2010
HPI measured deprivation at the national level
This meant it could obscure differences between individuals within a state
The MPI was developed to address this by measuring poverty at the level of individual people and households
MPI indicators
Dimension | Indicators |
|---|---|
Health |
|
Education |
|
Living Standards |
|
States are ranked from 0 to 1 in terms of the proportion of people they have living in multidimensional poverty
The higher the score, the more poverty is present
In 2025 The UN Development Programme (UNDP) estimated
1.1 billion people live in multidimensional poverty in 109 states globally
740 million of the 1.1 billion live in middle-income countries
Therefore, people living in multidimensional poverty are largely found in states that appear to be developing economically.
The purpose of the MPI is to identify who is poor and what their greatest needs are
This information can then be used by states, IGOs and NGOs to more specifically identify areas of focus
Gini Index and Happy Planet Index
Gini measures the distribution of wealth in a state
This is significant because a high GDP does not always mean all people share in this wealth
The Happy Planet Index takes opinion poll and environmental sustainability data into account to determine social development
Gini vs. Happy Planet
Gini | Happy Planet |
|---|---|
|
|
Case Study
Measuring development – the case of Colombia

Colombia presents a clear example of how different development indicators can give contrasting results
It has high income inequality, but also a strong Happy Planet Index (HPI) score
Income inequality (GINI coefficient)
Colombia has a high GINI coefficient, showing large gaps between rich and poor
Wealth is unevenly distributed, with many people experiencing poverty and limited opportunities
This suggests low levels of economic equality and uneven development
Happy Planet Index (HPI)
Colombia scores high on the Happy Planet Index
This reflects:
relatively high life satisfaction
strong community relationships
a lower environmental impact compared to more industrialised states
It suggests that many people report good quality of life despite lower incomes
What this shows about development
Colombia highlights that development is complex and multi-dimensional
Economic measures (like GINI or GNI) may suggest poor development
Social and environmental measures (like HPI) may suggest positive outcomes
No single indicator can fully capture human well-being

Unlock more, it's free!
Join the 100,000+ Students that ❤️ Save My Exams
the (exam) results speak for themselves:

Was this revision note helpful?
