Operations Objectives (AQA A Level Business): Exam Questions

Exam code: 7132

Syllabus Edition

First teaching 2026

First exams 2028

2 hours15 questions
1
6 marks

Source B: Portmeirion Group plc

Portmeirion Group plc makes and sells homeware and home fragrance. It is a public limited company based in Stoke-on-Trent, and it owns six heritage brands: Spode, Portmeirion, Royal Worcester, Nambé, Pimpernel and Wax Lyrical. It has over 650 employees worldwide; the majority are based in Stoke-on-Trent.

The last five years have been hard. Revenue reached £110.8 million in 2022 and then fell two years in a row, to £91.2 million in 2024, before holding at £91.1 million in 2025. Profit fell much further than revenue. Headline profit before tax was £8.0 million in 2022 and £1.0 million in 2024. The headline operating margin went from 7.8% in 2022 to 4.7% in 2023. Earnings for each share fell from 46.59p in 2022 to 8.04p in 2024, and the dividend fell from 15.50p to 1.50p. By the end of 2025 the group had net debt of £17.5 million, and although operations still generated cash, they generated only £0.5 million of it, against £2.1 million the year before.

The group sells in three main markets: the United Kingdom, North America and South Korea. North America is the largest of the three.

Portmeirion Group owns a factory in Stoke-on-Trent, but approximately 26% of its branded tableware is actually made there. The rest is bought in from suppliers, much of it in Asia. The company has a stated strategy called Made in Stoke-on-Trent and says it intends to increase the share it makes itself.

Something outside the business has pushed that plan along. When the United States introduced tariffs, orders that Portmeirion Group had sourced from Asia for the American market were cancelled, and the company decided to speed up parts of the Made in Stoke-on-Trent plan in response.

Source: Portmeirion Group plc annual results and interim statements, 2024 to 2026

Appendix G: Making tableware in Stoke-on-Trent compared with buying it from a supplier

  • Share of branded tableware made in the Stoke-on-Trent factory = 26%

  • Time to change a design or add a new product, made in Stoke-on-Trent = 4 weeks

  • Time to change a design or add a new product, bought from an overseas supplier = 20 weeks

  • Smallest order an overseas supplier will accept = 6 000 pieces

  • Smallest order the Stoke-on-Trent factory will run = 400 pieces

  • Average order to delivery time, Stoke-on-Trent = 3 weeks

  • Average order to delivery time, overseas supplier = 14 weeks

Source: Analyst

Analyse one way in which making more of its tableware in its own factory might affect the flexibility of Portmeirion Group plc's operations.

2
6 marks

Source B: Tata Steel UK

Tata Steel UK is part of the Indian multinational Tata Steel. Its largest site in Britain is Port Talbot in south Wales, which for decades made steel from raw materials in two blast furnaces.

On 25 April 2024 the company confirmed that it would close those blast furnaces and spend £1.25 billion on an electric arc furnace on the same site instead. Blast furnace number 5 closed at the end of June 2024 and blast furnace number 4 closed on 30 September 2024, ending the making of primary steel at Port Talbot. The change put up to 2 800 jobs at risk and around 2 500 roles have since gone.

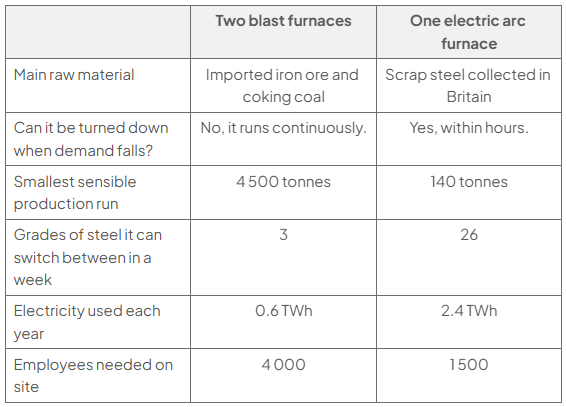
The two kinds of furnace work in completely different ways. A blast furnace turns imported iron ore and coking coal into new iron, runs continuously and cannot easily be turned down. An electric arc furnace melts scrap steel using electricity, can be started and stopped far more easily, emits far less carbon dioxide and needs far fewer people. It also depends on being able to buy enough scrap steel and on having a large enough electricity supply.

Steel was expected to be made at Port Talbot again in 2027 or 2028, but delays to the electricity grid connection mean the electric arc furnace is now not expected to be running until late 2028 or early 2029. In the meantime Port Talbot imports steel from other Tata Steel sites and rolls it there.

Port Talbot was chosen as a steel town for reasons that no longer all apply. It has a deep-water port built for importing iron ore, and rolling mills that are still in use. It does not sit close to where most of Britain's scrap steel is collected.

Source: Tata Steel UK announcements, 2024 to 2026

Appendix F: A blast furnace compared with an electric arc furnace

Comparison table of two blast furnaces and one electric arc furnace: minimum runs are 4,500 versus 140 tonnes, weekly grades 3 versus 26, and only the arc furnace can turn down within hours.

Source: Analyst

Analyse one way in which moving to an electric arc furnace might affect the flexibility of Tata Steel UK's operations.

3
6 marks

Source B: Lush

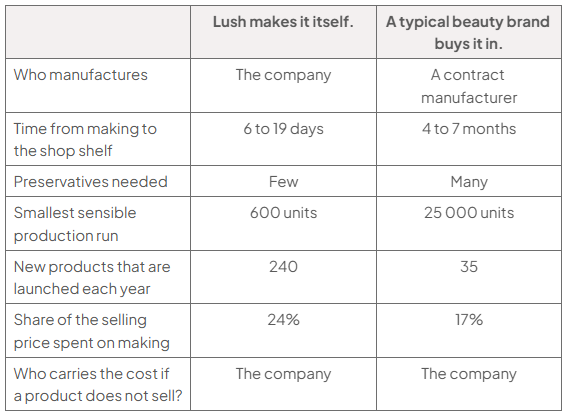
Lush makes and sells fresh handmade cosmetics: bath bombs, soaps and shampoo bars, often sold loose and unwrapped. It is unusual among cosmetics companies because it makes almost everything it sells. Most beauty brands design a product and pay someone else to manufacture it. Lush manufactures and retails, and it says the freshness of what it makes is the reason people buy it.

In the year to 30 June 2025 turnover reached £736.2 million, up £63.5 million or 9.4%. Like-for-like turnover grew 8%, with retail shops up 7% and digital up 13%. The loss before tax narrowed sharply, from £52.1 million the year before to £6.7 million, and earnings before interest, tax, depreciation and amortisation returned to a profit of £28.4 million. A surge in the price of cocoa, which Lush uses in large quantities, held the result back.

At the end of June 2025 the group had 869 permanent shops, 665 of them owned outright, selling in 50 countries. It manufactured in six countries. During the year it spent about £6.5 million restructuring, bringing manufacturing in Europe and Canada together into fewer sites.

That restructuring is the question the business keeps returning to. Making everything in a small number of large factories is cheaper for each product made. Making it close to the shops that sell it keeps it fresh, which is what Lush tells customers it is selling. The two pull against each other, and both have an environmental consequence, which matters to a company that has built its brand partly on that.

Source: Lush audited accounts for the year ended 30 June 2025

Appendix G: Making it compared with buying it in

Comparison table: Lush makes products itself versus a typical beauty brand buying them in. Making takes 6–19 days, allows 240 new products yearly and 600-unit runs; buying takes 4–7 months, 35 products and 25,000-unit runs.

Source: Analyst

Analyse one way in which making its own products might affect Lush's ability to launch new products quickly.

4
6 marks

Source B: Glanmor Dairy Ltd

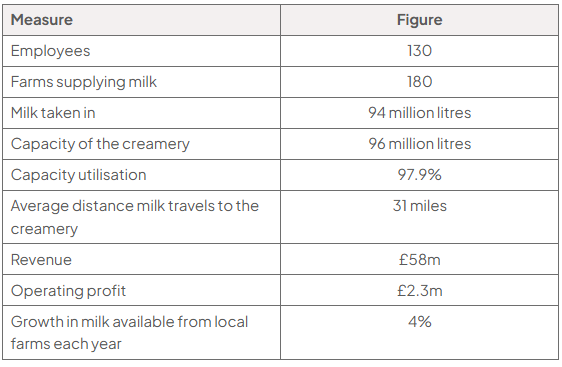
Glanmor Dairy Ltd processes milk into cheese, butter and cream at a single creamery in Carmarthenshire. It employs 130 people, takes in 94 million litres of milk a year from 180 farms within about thirty miles, and in the year to March 2025 had revenue of £58 million and an operating profit of £2.3 million.

Milk is an unusual raw material. It arrives every day whether the creamery wants it or not, because cows do not stop. It cannot be stored for long before processing. And it is heavy and mostly water, so moving it is expensive: a tanker costs much the same to run whether the milk inside is worth a lot or a little.

The creamery is close to full capacity. It can process 96 million litres a year and took 94 million last year, and the farms around it are producing more each year. Glanmor must either make its existing site bigger or build a second one.

If it builds a second creamery, where it goes matters. A site deep in the milk-producing country would sit close to the farms but a long way from the motorway network and from the supermarket depots that take the finished cheese. A site near the motorway would be the opposite: cheap to send the finished product out from, expensive to bring the raw milk into.

The managing director, Rhian Pugh, has asked for both questions to be answered: bigger here, or a second site, and if a second site, where.

Source: Glanmor Dairy Ltd

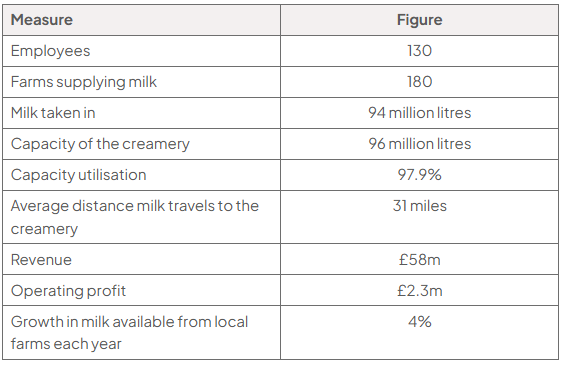
Appendix E: Glanmor Dairy Ltd selected data, year to March 2025

Table of Glanmor Dairy Ltd selected data: 130 employees; 180 farms supplying milk; 94 million litres of milk taken in; capacity of the creamery 96 million litres; capacity utilisation 97.9%; average distance milk travels to the creamery 31 miles; revenue £58m; operating profit £2.3m; growth in milk available from local farms 4% each year.

Source: Glanmor Dairy Ltd

Analyse one way in which running the creamery at 97.9% of capacity might affect Glanmor Dairy Ltd's ability to serve its customers.

5
6 marks

Source B: Kielder Timber Products Ltd

Kielder Timber Products Ltd runs a sawmill in Northumberland, fourteen kilometres from the nearest gate into the forest it buys most of its logs from. It cuts fencing, pallet wood and construction timber, employs 150 people and had revenue of £24.6 million in the year to March 2025, with an operating profit of £1.9 million.

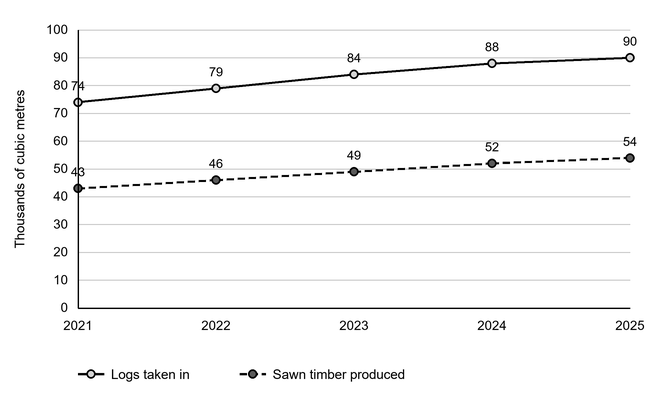
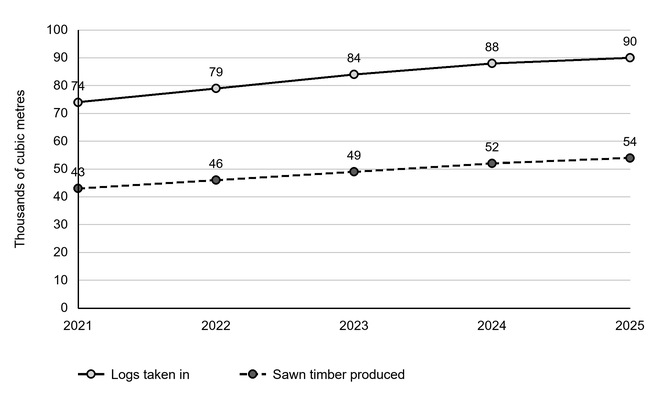
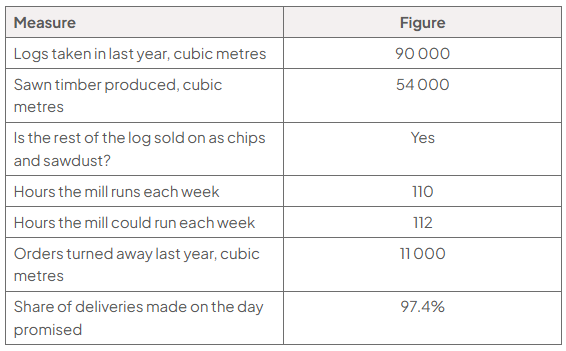
The mill is full. It takes in 90 000 cubic metres of logs a year and runs for 110 hours out of a possible 112 every week. Whatever does not come out as sawn timber is sold on as chips and sawdust to a board mill and a biomass plant, so very little of the log is wasted, but the amount that leaves as timber is the number the directors watch.

Demand is the problem rather than the solution. Housebuilding and fencing orders have grown every year since 2021, and last year Kielder turned away 11 000 cubic metres of orders it had no way of cutting. A second mill would roughly double what the company can produce, and would lower the cost of every cubic metre, because logs bought in larger quantities cost less and the fixed costs would be spread over twice the output.

Where to put it is the difficult part. One site sits beside the existing mill, a short haul from the forest and run by the team that is already there, but it is expensive to build and the planning application is being contested. The other is a former colliery site sixty-five kilometres south, cheaper to build, grant-aided, already consented and much closer to customers, but every log would travel five times as far to reach it.

Source: Kielder Timber Products Ltd

Appendix F: How the existing mill performs

Thousands of cubic metres

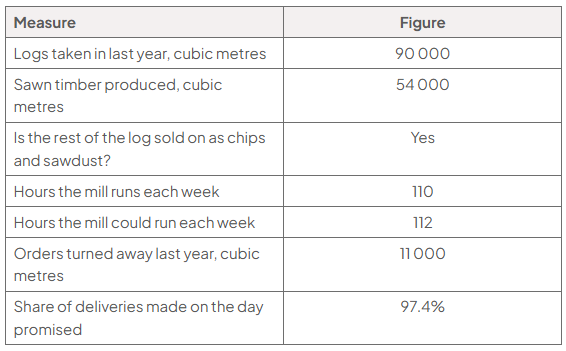
Line chart of logs taken in and sawn timber produced, both rising from 2021 to 2025. The y-axis shows thousands of cubic metres from 0 to 100: logs 74 to 90; sawn timber 43 to 54.
Table of Kielder Timber Products Ltd’s operating figures: 90,000 cubic metres of logs taken in, 54,000 produced as sawn timber, 110 of 112 weekly hours run, 11,000 cubic metres of orders turned away, 97.4% deliveries on time, and the remainder sold as chips and sawdust.

Source: Analyst

Analyse one way in which running the mill for 110 of a possible 112 hours a week might affect Kielder Timber Products Ltd's ability to meet its operations objectives.

6
6 marks

Source B: Hallerton Cold Stores Ltd

Hallerton Cold Stores Ltd keeps frozen food for other people. It runs one store near Hull with 18 000 pallet spaces, holds it at about minus 24 degrees Celsius every hour of every day, and moves 1 900 pallets in and out daily. It employs 110 people, had revenue of £14.2 million in the year to March 2025 against operating costs of £12.4 million, and made an operating profit of £1.8 million.

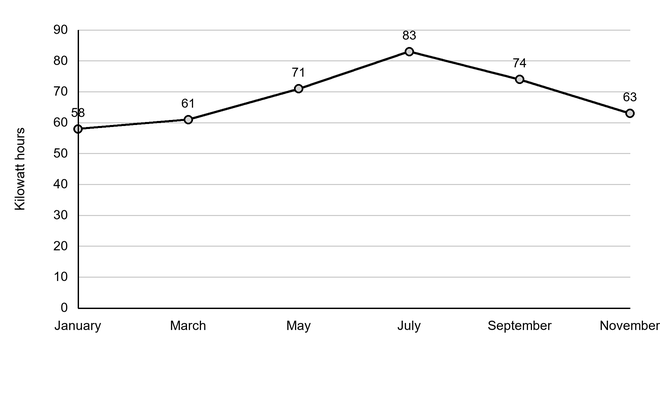
What makes the business unlike a warehouse is electricity. Keeping 18 000 pallet spaces that cold cost £4 464 000 last year, which is by a wide margin the largest thing the company spends money on, more than it spends on wages. The bill also moves with the weather: a pallet space uses about 83 kilowatt hours in July and 58 in January.

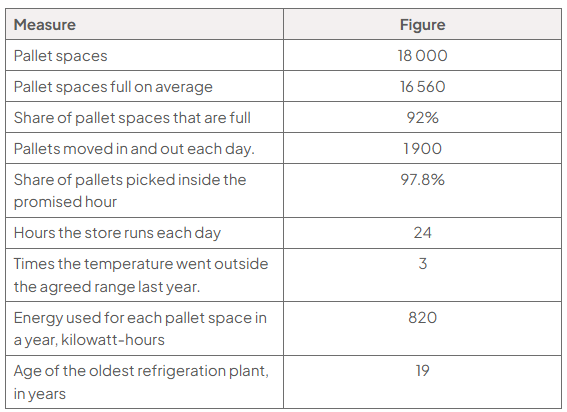
The store is nearly full. It runs at 92% of its pallet spaces on average, picks 97.8% of pallets inside the hour it promises, and has been outside its agreed temperature range three times in a year. The oldest refrigeration plant is nineteen years old.

Customers want more space than Hallerton has, so a second store is agreed in principle. Two things are not. One is where to put it: beside the existing store, where the grid connection exists and the night shift could be shared, or in the East Midlands, far closer to the three customers who provide over half the revenue. The other is what to build: the same again, or something that uses a third less electricity for every pallet space and costs several million pounds more.

Source: Hallerton Cold Stores Ltd

Appendix F: What the store is judged on

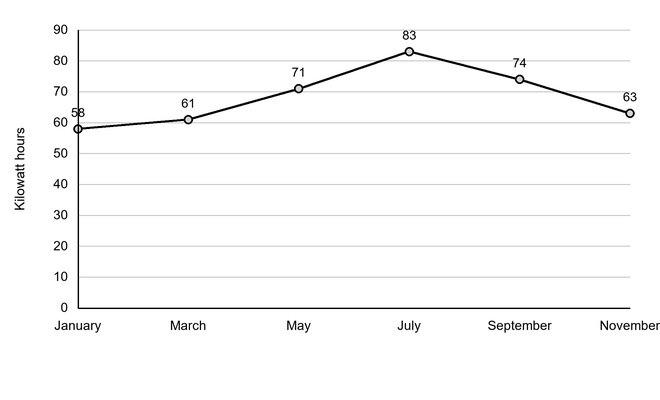
Energy used for each pallet space, kilowatt hours

Line chart of energy used per pallet space, in kilowatt hours, by month: January 58, March 61, May 71, July 83, September 74 and November 63; usage peaks in July.
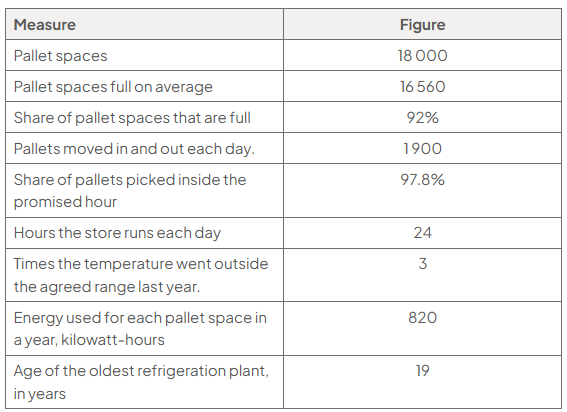
Table of store measures: 16 560 pallet spaces full on average; 1 900 pallets moved daily; 97.8% picked within an hour; 24-hour operation; three temperature breaches; 820 kilowatt-hours per space yearly; oldest plant 19 years.

Source: Analyst

Analyse one way in which a pallet space using 83 kilowatt hours in July and 58 in January might affect Hallerton Cold Stores Ltd's operations objectives.

7
6 marks

Source A: Ellerby & Sons Plumbing Ltd

Ellerby & Sons Plumbing Ltd installs and repairs boilers and bathrooms around Doncaster. Mick Ellerby started it twenty-two years ago and still goes out on jobs himself. There are seven people in all: Mick and four other qualified engineers, one apprentice and one administrator who answers the phone and books the work. Revenue in the year to March 2025 was £685 000 and operating profit was £78 000.

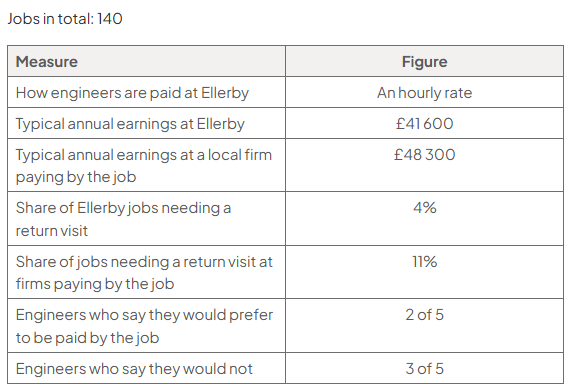
Between them the engineers complete about 140 jobs a week, and almost three quarters of the work comes from customers who have used the firm before. They are paid an hourly rate, which is unusual locally: most of the firms Ellerby competes with pay by the job.

That difference shows up in two places. An engineer at one of those firms typically earns £48 300 a year against £41 600 at Ellerby, and completes more jobs a week. It also shows up in the work: at Ellerby about 4% of jobs need a return visit, and at the firms paying by the job it is nearer 11%.

Two engineers have left in the past two years and both went to firms paying by the job. Mick has no training budget, has never written an appraisal, and teaches the apprentice himself in the van between calls. Of the eight hours in an engineer's day, about six and a half are charged to a customer; the rest goes on travelling, stocking the van and paperwork.

Mick is sixty-one and wants the firm to work without him in it every day.

Source: Ellerby & Sons Plumbing Ltd

Appendix B: What each engineer does in a week, and what they are paid

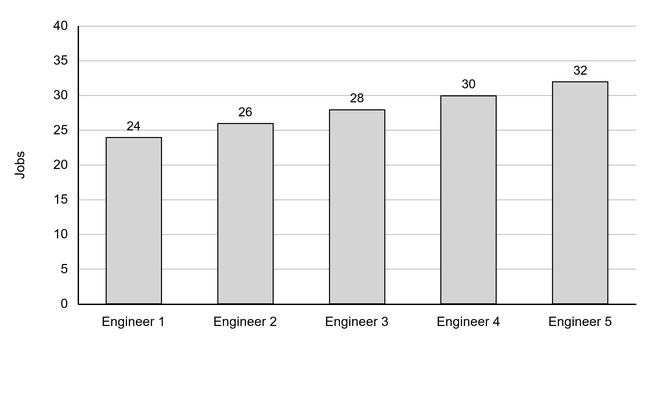
Bar chart of jobs completed per engineer in a typical week, rising from 24 for Engineer 1 to 32 for Engineer 5: Engineer 2 completes 26, Engineer 3 28 and Engineer 4 30. The y-axis ranges from 0 to 40 jobs.
Table for 140 jobs: engineers are paid hourly; annual earnings are £41 600 at Ellerby versus £48 300 at job-paid firms. Return visits are 4% versus 11%; 2 of 5 prefer job pay and 3 of 5 do not.

Source: Analyst

Analyse one way in which 4% of its jobs needing a return visit might affect the operations objectives Ellerby & Sons Plumbing Ltd sets.

1
9 marks

Source B: Portmeirion Group plc

Portmeirion Group plc makes and sells homeware and home fragrance. It is a public limited company listed on AIM, based in Stoke-on-Trent, and it owns six heritage brands: Spode, Portmeirion, Royal Worcester, Nambé, Pimpernel and Wax Lyrical. It has over 650 employees worldwide and the majority of them are in Stoke-on-Trent.

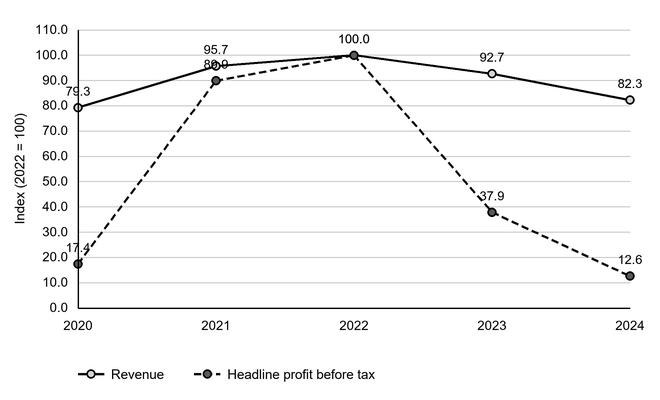
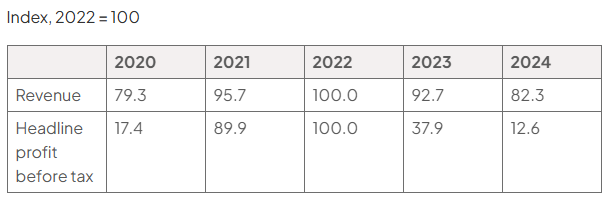
The last five years have been hard. Revenue reached £110.8 million in 2022 and then fell two years in a row, to £91.2 million in 2024, before holding at £91.1 million in 2025. Profit fell much further than revenue. Headline profit before tax was £8.0 million in 2022 and £1.0 million in 2024. The headline operating margin went from 7.8% in 2022 to 4.7% in 2023. Earnings for each share fell from 46.59p in 2022 to 8.04p in 2024, and the dividend from 15.50p to 1.50p. By the end of 2025 the group had net debt of £17.5 million, and although operations still generated cash, they generated only £0.5 million of it, against £2.1 million the year before.

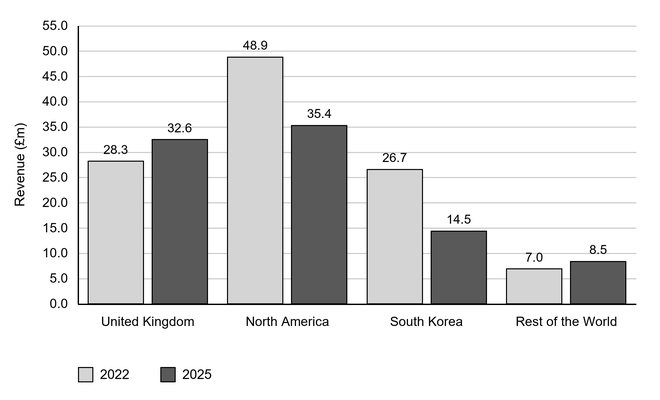
The group sells in three main markets: the United Kingdom, North America and South Korea. North America is the largest of the three.

Portmeirion Group owns a factory in Stoke-on-Trent, but approximately 26% of its branded tableware is actually made there. The rest is bought in from suppliers, much of it in Asia. The company has a stated strategy called Made in Stoke-on-Trent and says it intends to increase the share it makes itself.

Something outside the business has pushed that plan along. When the United States introduced tariffs, orders that Portmeirion Group had sourced from Asia for the American market were cancelled, and the company decided to speed up parts of the Made in Stoke-on-Trent plan in response.

Source: Portmeirion Group plc annual results and interim statements, 2024 to 2026

Appendix E: Portmeirion Group plc revenue and headline profit before tax, indexed to 2022

Line graph of Portmeirion Group’s revenue and headline profit before tax, indexed to 2022 = 100, from 2020 to 2024. Revenue fluctuates moderately, while profit rises to 100 then falls sharply to 12.6.
Table of Portmeirion Group’s revenue and headline profit before tax, indexed to 2022 = 100, for 2020 to 2024. Revenue: 79.3, 95.7, 100.0, 92.7, 82.3; profit: 17.4, 89.9, 100.0, 37.9, 12.6.

Source: Portmeirion Group plc

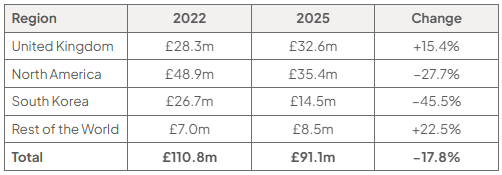
Appendix F: Portmeirion Group plc revenue by region

Grouped bar chart of Portmeirion Group revenue by region in £ millions, in 2022 and 2025: United Kingdom 28.3 and 32.6; North America 48.9 and 35.4; South Korea 26.7 and 14.5; Rest of the World 7.0 and 8.5. The vertical axis runs from 0 to 55.
Table of Portmeirion Group revenue by region in 2022 and 2025, with the change: United Kingdom £28.3m and £32.6m, up 15.4%; North America £48.9m and £35.4m, down 27.7%; South Korea £26.7m and £14.5m, down 45.5%; Rest of the World £7.0m and £8.5m, up 22.5%; total £110.8m and £91.1m, down 17.8%.

Source: Portmeirion Group plc

Assess whether cost should be Portmeirion Group plc's most important operations objective.

2
9 marks

Source B: Tata Steel UK

Tata Steel UK is part of the Indian multinational Tata Steel. Its largest site in Britain is Port Talbot in south Wales, which for decades made steel from raw materials in two blast furnaces.

On 25 April 2024 the company confirmed that it would close those blast furnaces and spend £1.25 billion on an electric arc furnace on the same site instead. Blast furnace number 5 closed at the end of June 2024 and blast furnace number 4 closed on 30 September 2024, ending the making of primary steel at Port Talbot. The change put up to 2 800 jobs at risk and around 2 500 roles have since gone.

The two kinds of furnace work in completely different ways. A blast furnace turns imported iron ore and coking coal into new iron, runs continuously and cannot easily be turned down. An electric arc furnace melts scrap steel using electricity, can be started and stopped far more easily, emits far less carbon dioxide and needs far fewer people. It also depends on being able to buy enough scrap steel and on having a large enough electricity supply.

Steel was expected to be made at Port Talbot again in 2027 or 2028, but delays to the electricity grid connection mean the electric arc furnace is now not expected to be running until late 2028 or early 2029. In the meantime Port Talbot imports steel from other Tata Steel sites and rolls it there.

Port Talbot was chosen as a steel town for reasons that no longer all apply. It has a deep-water port built for importing iron ore, and rolling mills that are still in use. It does not sit close to where most of Britain's scrap steel is collected.

Source: Tata Steel UK announcements, 2024 to 2026

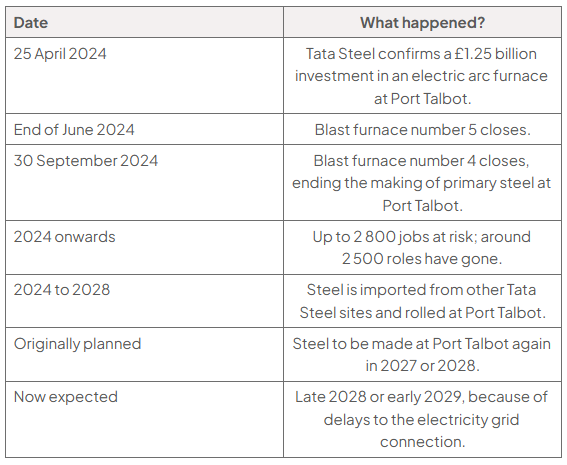
Appendix E: What changed at Port Talbot

Timeline of what changed at Port Talbot: 25 April 2024, Tata Steel confirms a £1.25 billion investment in an electric arc furnace at Port Talbot; end of June 2024, blast furnace number 5 closes; 30 September 2024, blast furnace number 4 closes, ending the making of primary steel at Port Talbot; 2024 onwards, up to 2 800 jobs at risk and around 2 500 roles have gone; 2024 to 2028, steel is imported from other Tata Steel sites and rolled at Port Talbot; originally planned, steel to be made at Port Talbot again in 2027 or 2028; now expected, late 2028 or early 2029, because of delays to the electricity grid connection.

Source: Tata Steel UK

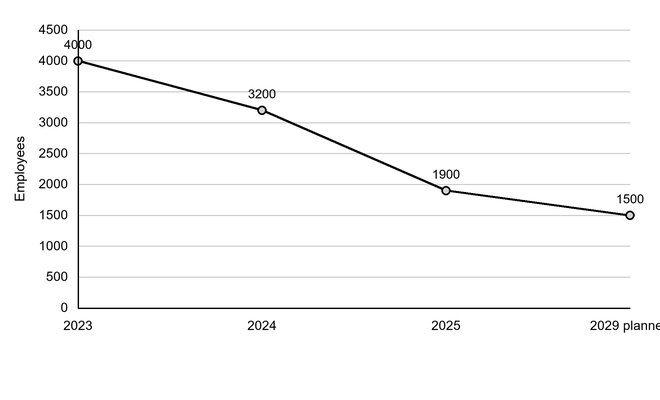
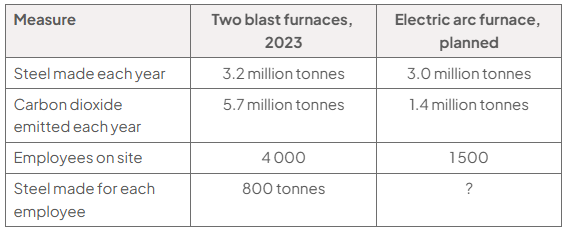
Appendix H: Port Talbot output, emissions and employees

Employees on site

Line graph of Tata Steel UK employees on site, falling from 4 000 in 2023 to 3 200 in 2024, 1 900 in 2025 and a planned 1 500 in 2029; vertical axis ranges from 0 to 4 500 employees.
Comparison table of two blast furnaces in 2023 and a planned electric arc furnace: steel made 3.2 versus 3.0 million tonnes; carbon dioxide 5.7 versus 1.4 million tonnes; employees 4 000 versus 1 500; steel per employee 800 tonnes versus not provided.

Source: Analyst

Assess whether reducing its environmental impact should be Tata Steel UK's most important operations objective.

3
9 marks

Source B: Glanmor Dairy Ltd

Glanmor Dairy Ltd processes milk into cheese, butter and cream at a single creamery in Carmarthenshire. It employs 130 people, takes in 94 million litres of milk a year from 180 farms within about thirty miles, and in the year to March 2025 had revenue of £58 million and an operating profit of £2.3 million.

Milk is an unusual raw material. It arrives every day whether the creamery wants it or not, because cows do not stop. It cannot be stored for long before processing. And it is heavy and mostly water, so moving it is expensive: a tanker costs much the same to run whether the milk inside is worth a lot or a little.

The creamery is close to full. It can process 96 million litres a year and took 94 million last year, and the farms around it are producing more each year. Glanmor must either make its existing site bigger or build a second one.

If it builds a second creamery, where it goes matters. A site deep in the milk-producing country would sit close to the farms but a long way from the motorway network and from the supermarket depots that take the finished cheese. A site near the motorway would be the opposite: cheap to send the finished product out from, expensive to bring the raw milk into.

The managing director, Rhian Pugh, has asked for both questions to be answered: bigger here, or a second site, and if a second site, where.

Source: Glanmor Dairy Ltd

Appendix E: Glanmor Dairy Ltd selected data, year to March 2025

Table of Glanmor Dairy Ltd selected data: 130 employees, 180 supplying farms, 94 million litres taken in, 96 million-litre capacity, 97.9% utilisation, 31-mile average distance, £58m revenue, £2.3m operating profit and 4% annual growth.

Source: Glanmor Dairy Ltd

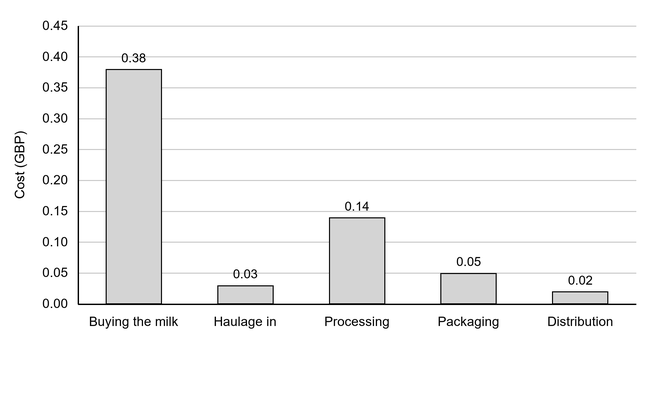
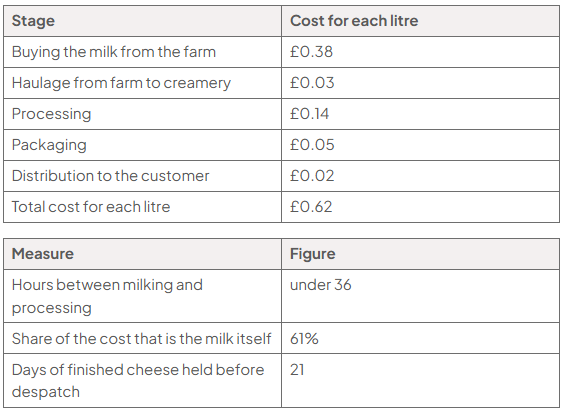
Appendix G: What happens to a litre of milk

Bar chart of Glanmor Dairy’s cost per litre: buying milk is highest at £0.38, followed by processing £0.14, packaging £0.05, haulage £0.03 and distribution £0.02; vertical axis £0–£0.45.
Table of cost per litre and operational measures: buying milk £0.38, haulage £0.03, processing £0.14, packaging £0.05 and distribution £0.02; total £0.62. Milk is 61% of cost; processing takes under 36 hours and cheese is held 21 days before dispatch.

Source: Analyst

Assess whether cost should be Glanmor Dairy Ltd's most important operations objective.

4
9 marks

Source B: Kielder Timber Products Ltd

Kielder Timber Products Ltd runs a sawmill in Northumberland, fourteen kilometres from the nearest gate into the forest it buys most of its logs from. It cuts fencing, pallet wood and construction timber, employs 150 people and had revenue of £24.6 million in the year to March 2025, with an operating profit of £1.9 million.

The mill is full. It takes in 90 000 cubic metres of logs a year and runs for 110 hours out of a possible 112 every week. Whatever does not come out as sawn timber is sold on as chips and sawdust to a board mill and a biomass plant, so very little of the log is wasted, but the amount that leaves as timber is the number the directors watch.

Demand is the problem rather than the solution. Housebuilding and fencing orders have grown every year since 2021, and last year Kielder turned away 11 000 cubic metres of orders it had no way of cutting. A second mill would roughly double what the company can produce, and would lower the cost of every cubic metre, because logs bought in larger quantities cost less and the fixed costs would be spread over twice the output.

Where to put it is the difficult part. One site sits beside the existing mill, a short haul from the forest and run by the team that is already there, but it is expensive to build and the planning application is being contested. The other is a former colliery site sixty-five kilometres south, cheaper to build, grant-aided, already consented and much closer to customers, but every log would travel five times as far to reach it.

Source: Kielder Timber Products Ltd

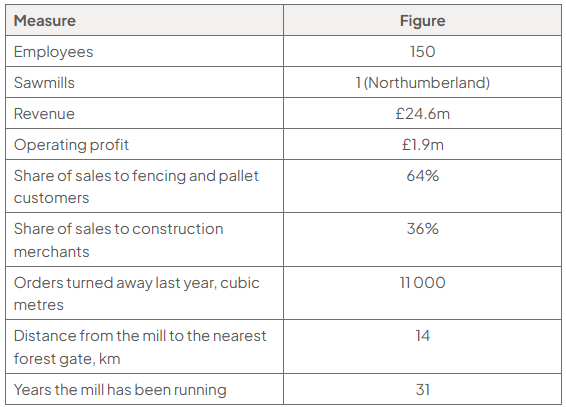
Appendix E: Kielder Timber Products Ltd selected data, year to March 2025

Selected data table: 150 employees; one sawmill in Northumberland; revenue £24.6m; operating profit £1.9m; sales 64% fencing and pallet, 36% construction; 11,000 cubic metres of orders refused; forest 14 km away; 31 years operating.

Source: Kielder Timber Products Ltd

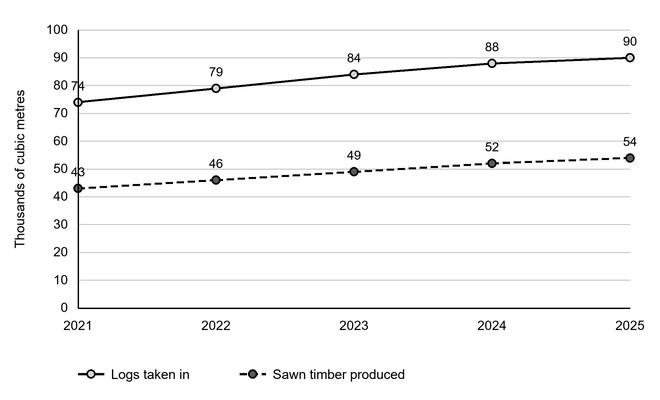
Appendix F: How the existing mill performs

Thousands of cubic metres

Line graph of logs taken in and sawn timber produced, 2021–2025. The vertical axis shows thousands of cubic metres, from 0 to 100: logs rise 74, 79, 84, 88, 90; sawn timber 43, 46, 49, 52, 54.
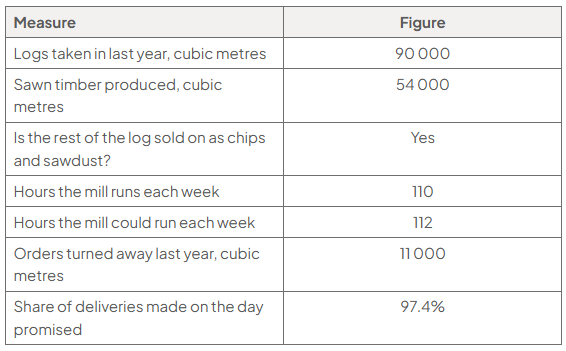
Table of existing mill data: 90,000 cubic metres of logs taken in and 54,000 cubic metres of sawn timber produced; rest sold as chips and sawdust; 110 of 112 weekly hours used; 11,000 cubic metres of orders refused; 97.4% delivered on time.

Source: Analyst

Assess how well the existing mill is meeting Kielder Timber Products Ltd's operations objectives.

Calculate the capacity utilisation of the existing mill, based on its weekly hours, to support your answer.

5
9 marks

Source A: Ryeworth Bakeries Ltd

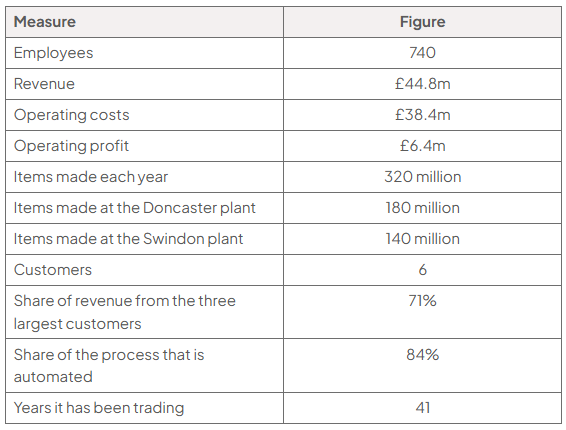
Ryeworth Bakeries Ltd bakes bread and morning goods for supermarkets from two plants, one in Doncaster and one in Swindon. It employs 740 people, makes about 320 million items a year, and in the year to March 2025 had revenue of £44.8 million against operating costs of £38.4 million, leaving an operating profit of £6.4 million. Six customers buy from it and the three largest provide 71% of revenue.

Size buys its inputs cheaply. Ryeworth takes 20 000 tonnes of flour a year and pays £318 a tonne; a baker buying 2 000 tonnes pays £347. On 20 000 tonnes that difference is worth more than half a million pounds a year.

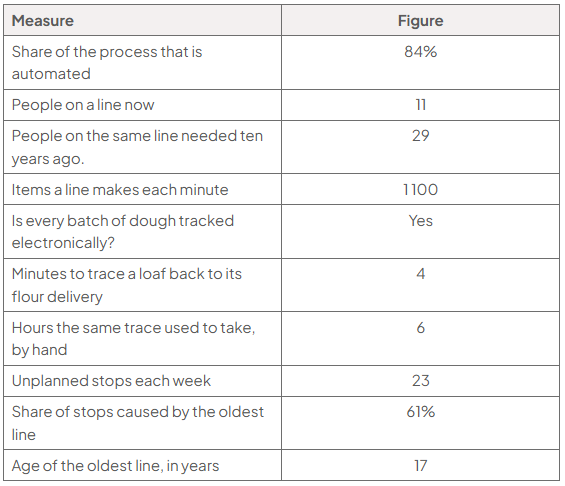
Size has also bought it machinery that a smaller baker could not justify. Eighty-four per cent of the process is automated, a line that needed twenty-nine people ten years ago now needs eleven, and every batch of dough is tracked electronically, so a loaf can be traced back to the flour delivery it came from in four minutes rather than the six hours it used to take by hand.

What size has not bought is tidiness. There are now five levels between the managing director and a baker, and fourteen items are made at both plants to different recipes, because each plant developed its own. The oldest line is seventeen years old and causes 61% of the twenty-three unplanned stops the company has each week.

A supermarket has asked for 130 million more items a year. The board has to decide where to make them.

Source: Ryeworth Bakeries Ltd

Appendix A: Ryeworth Bakeries Ltd selected data, year to March 2025

Appendix A table: employees 740; revenue £44.8m; operating costs £38.4m; profit £6.4m; 320m items yearly, 180m Doncaster and 140m Swindon; six customers; top three provide 71% of revenue; 84% automated; trading 41 years.

Source: Ryeworth Bakeries Ltd

Appendix C: How the plants run

Table of operations data: 84% automated; 11 people per line versus 29 ten years ago; 1,100 items per minute; batches electronically tracked, traceable in 4 minutes versus 6 hours by hand; 23 stops weekly, 61% caused by the 17-year-old line.

Source: Analyst

Assess how well Ryeworth Bakeries Ltd is meeting its operations objectives.

1
15 marks

Source B: Lush

Lush makes and sells fresh handmade cosmetics: bath bombs, soaps and shampoo bars, often sold loose and unwrapped. It is unusual among cosmetics companies because it makes almost everything it sells. Most beauty brands design a product and pay someone else to manufacture it. Lush manufactures and retails, and it says the freshness of what it makes is the reason people buy it.

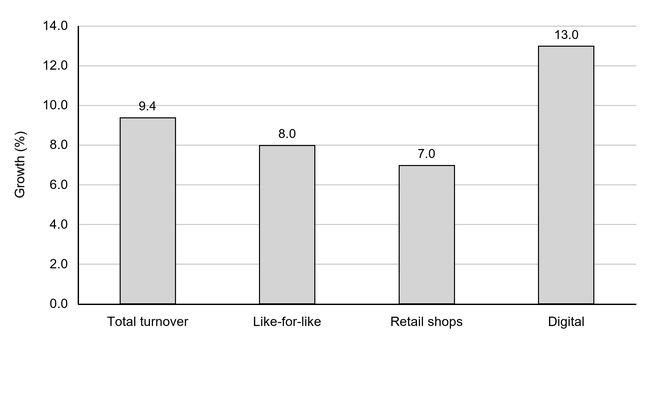
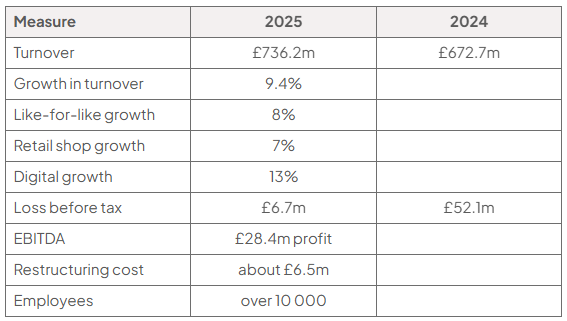
In the year to 30 June 2025 turnover reached £736.2 million, up £63.5 million or 9.4%. Like-for-like turnover grew 8%, with retail shops up 7% and digital up 13%. The loss before tax narrowed sharply, from £52.1 million the year before to £6.7 million, and earnings before interest, tax, depreciation and amortisation returned to a profit of £28.4 million. A surge in the price of cocoa, which Lush uses in large quantities, held the result back.

At the end of June 2025 the group had 869 permanent shops, 665 of them owned outright, selling in 50 countries. It manufactured in six countries. During the year it spent about £6.5 million restructuring, bringing manufacturing in Europe and Canada together into fewer sites.

That restructuring is the question the business keeps returning to. Making everything in a small number of large factories is cheaper for each product made. Making it close to the shops that sell it keeps it fresh, which is what Lush tells customers it is selling. The two pull against each other, and both have an environmental consequence, which matters to a company that has built its brand partly on that.

Source: Lush audited accounts for the year ended 30 June 2025

Appendix E: Selected data for Lush, year to 30 June 2025

Bar chart of Lush’s 2025 growth, with percentage growth on the vertical axis from 0 to 14: total turnover 9.4%, like-for-like 8.0%, retail shops 7.0%, and digital 13.0%.
Table comparing Lush’s 2025 and 2024 performance: turnover £736.2m versus £672.7m, and loss before tax £6.7m versus £52.1m. 2025 also lists growth, £28.4m EBITDA profit, £6.5m restructuring cost and over 10,000 employees.

Source: Lush

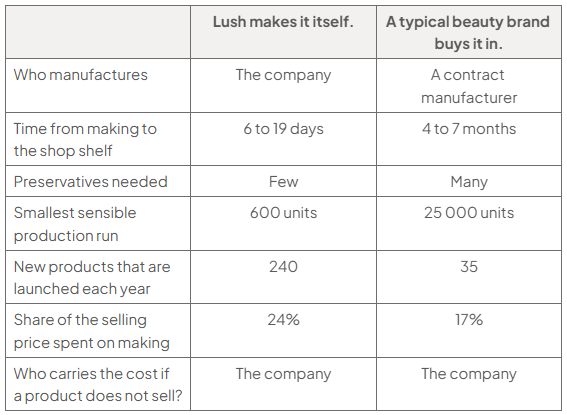
Appendix G: Making it compared with buying it in

Table comparing Lush making products itself with a typical beauty brand buying them in: company/contract manufacturer; shelf time 6–19 days/4–7 months; few/many preservatives; minimum runs 600/25,000 units; launches 240/35 yearly; making share 24%/17%; unsold cost company for both.

Source: Analyst

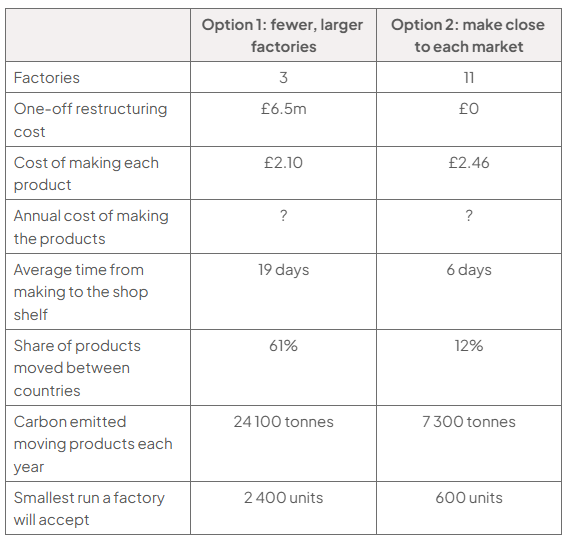
Appendix H: Two ways of organising Lush's manufacturing

Products made each year = 118 million

Table comparing Lush manufacturing options: 3 versus 11 factories; £6.5m versus £0 restructuring; £2.10 versus £2.46 per product; annual cost to calculate; 19 versus 6 days; 61% versus 12% moved between countries; 24,100 versus 7,300 tonnes carbon; minimum runs 2,400 versus 600 units.

Source: Analyst

Lush is considering two ways of organising its manufacturing:

Option 1: fewer, larger factories

Option 2: make close to each market

Evaluate both options and recommend which one Lush should choose.

Calculate the annual cost of making the products under Option 1 to support your answer.

2
15 marks

Source B: Kielder Timber Products Ltd

Kielder Timber Products Ltd runs a sawmill in Northumberland, fourteen kilometres from the nearest gate into the forest it buys most of its logs from. It cuts fencing, pallet wood and construction timber, employs 150 people and had revenue of £24.6 million in the year to March 2025, with an operating profit of £1.9 million.

The mill is full. It takes in 90 000 cubic metres of logs a year and runs for 110 hours out of a possible 112 every week. Whatever does not come out as sawn timber is sold on as chips and sawdust to a board mill and a biomass plant, so very little of the log is wasted, but the amount that leaves as timber is the number the directors watch.

Demand is the problem rather than the solution. Housebuilding and fencing orders have grown every year since 2021, and last year Kielder turned away 11 000 cubic metres of orders it had no way of cutting. A second mill would roughly double what the company can produce, and would lower the cost of every cubic metre, because logs bought in larger quantities cost less and the fixed costs would be spread over twice the output.

Where to put it is the difficult part. One site sits beside the existing mill, a short haul from the forest and run by the team that is already there, but it is expensive to build and the planning application is being contested. The other is a former colliery site sixty-five kilometres south, cheaper to build, grant-aided, already consented and much closer to customers, but every log would travel five times as far to reach it.

Source: Kielder Timber Products Ltd

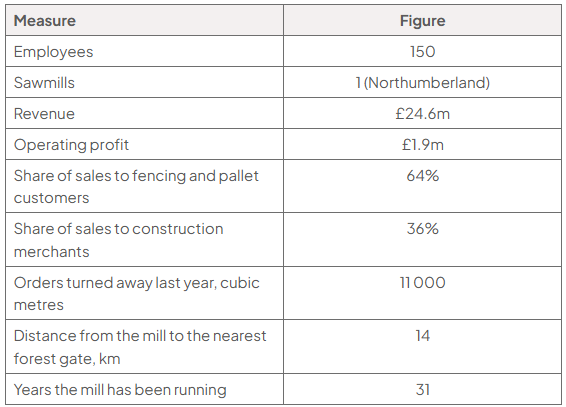
Appendix E: Kielder Timber Products Ltd selected data, year to March 2025

Table of selected data: 150 employees; one Northumberland sawmill; revenue £24.6m; operating profit £1.9m; sales: fencing and pallet customers 64%, construction merchants 36%; 11,000 orders turned away; forest gate 14 km away; 31 years operating.

Source: Kielder Timber Products Ltd

Appendix F: How the existing mill performs

Thousands of cubic metres

Line graph of logs taken in and sawn timber produced from 2021 to 2025, in thousands of cubic metres. Logs rise from 74 to 90, while sawn timber increases from 43 to 54. Y-axis: 0–100.
Table of mill performance: 90,000 cubic metres of logs taken in and 54,000 cubic metres of sawn timber produced; the rest is sold as chips and sawdust. Runs 110 of 112 weekly hours; 11,000 cubic metres of orders turned away; 97.4% deliveries on time.

Source: Analyst

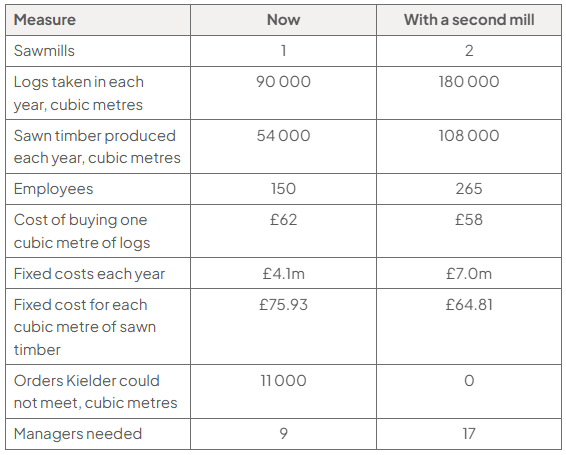
Appendix G: What a second mill would change

Table comparing current operations with a second mill: 1/2 sawmills; 90,000/180,000 cubic metres logs and 54,000/108,000 sawn timber yearly; 150/265 employees; log cost £62/£58; fixed costs £4.1m/£7m; timber cost £75.93/£64.81 per cubic metre; unmet orders 11,000/0; managers 9/17.

Source: Analyst

Evaluate two ways in which Kielder Timber Products Ltd could meet the 11 000 cubic metres of orders it turned away last year without building a second mill, and recommend which one it should choose.

3
15 marks

Source B: Hallerton Cold Stores Ltd

Hallerton Cold Stores Ltd keeps frozen food for other people. It runs one store near Hull with 18 000 pallet spaces, holds it at about minus 24 degrees Celsius every hour of every day, and moves 1 900 pallets in and out daily. It employs 110 people, had revenue of £14.2 million in the year to March 2025 against operating costs of £12.4 million, and made an operating profit of £1.8 million.

What makes the business unlike a warehouse is electricity. Keeping 18 000 pallet spaces that cold cost £4 464 000 last year, which is by a wide margin the largest thing the company spends money on, more than it spends on wages. The bill also moves with the weather: a pallet space uses about 83 kilowatt hours in July and 58 in January.

The store is nearly full. It runs at 92% of its pallet spaces on average, picks 97.8% of pallets inside the hour it promises, and has been outside its agreed temperature range three times in a year. The oldest refrigeration plant is nineteen years old.

Customers want more space than Hallerton has, so a second store is agreed in principle. Two things are not. One is where to put it: beside the existing store, where the grid connection exists and the night shift could be shared, or in the East Midlands, far closer to the three customers who provide over half the revenue. The other is what to build: the same again, or something that uses a third less electricity for every pallet space and costs several million pounds more.

Source: Hallerton Cold Stores Ltd

Appendix F: What the store is judged on

Energy used for each pallet space, kilowatt hours

Line chart of monthly energy used per pallet space, rising from 58 kilowatt hours in January to 83 in July before falling to 63 in November; months on the x-axis and 0–90 kilowatt hours on the y-axis.
Table of existing-store measures: 18,000 spaces; 16,560 full on average (92%); 1,900 pallets moved daily; 97.8% picked within an hour; 24-hour operation; three temperature breaches; 820 kilowatt-hours per space yearly; plant aged 19 years.

Source: Analyst

Appendix H: Two ways of building and running the second store

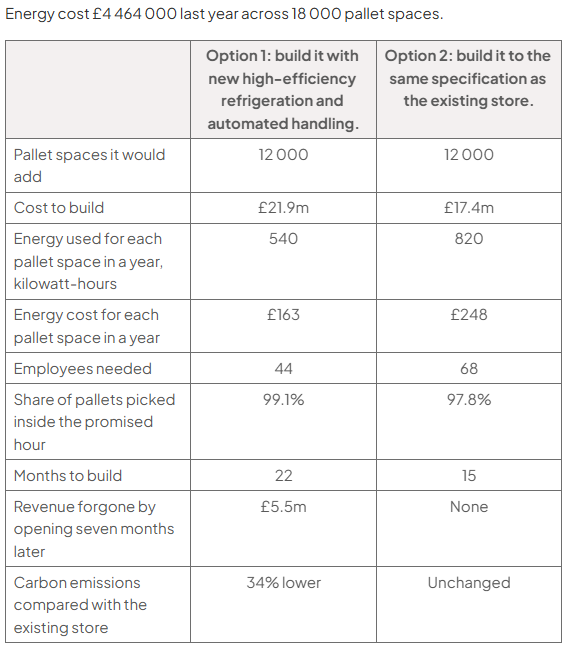
Comparison table: both options add 12,000 spaces. Option 1 costs £21.9m, uses 540 kilowatt-hours and £163 per space, needs 44 employees, takes 22 months, and has 34% lower emissions; Option 2 costs £17.4m, uses 820 and £248, needs 68, takes 15 months, with unchanged emissions.

Source: Analyst

Hallerton Cold Stores Ltd is considering two ways of building and running its second store:

Option 1: build it with new high-efficiency refrigeration and automated handling

Option 2: build it to the same specification as the existing store

Evaluate both options and recommend which one Hallerton Cold Stores Ltd should choose.

Calculate the energy cost for each pallet space at the existing store to support your answer.