Markets & Marketing Data (AQA A Level Business): Exam Questions

Exam code: 7132

Syllabus Edition

First teaching 2026

First exams 2028

3 hours18 questions
1
6 marks

Source B: Mishcon de Reya LLP

Mishcon de Reya LLP is a law firm. It advises businesses and wealthy individuals on disputes, property, corporate deals and private matters, and it is led by managing partner James Libson. It has offices in London, Cambridge and Oxford, and overseas in Hong Kong, Singapore and the United Arab Emirates. About 1 250 people work there, including more than 650 lawyers.

It is not a company. It is a limited liability partnership, which means it is owned by its members, the partners, rather than by shareholders. Members put capital into the firm when they join and take a share of the profit rather than a salary. Nobody outside the partnership owns any part of it.

The year to 31 March 2025 was the firm's best. Revenue rose 9% to £330 million and profit rose 14% to £110 million, the first time it has passed £100 million. The firm says it has tripled in size over the past decade. Its work during the year included advising Wayve on what it describes as Europe's largest artificial intelligence investment and defending O2 in a collusion claim.

Growing has meant admitting people. Sixteen new partners joined during the year and a further 27 people were promoted to partner from inside the firm, alongside 13 promotions to legal director. There are now more than 200 partners. As in any partnership, some members retire or leave each year, so membership grows by less than the number admitted.

That is the tension the firm is sitting with. In a partnership the profit is divided between the members, so every partner admitted is another share of the same pool. The firm now has to decide where its next stage of growth should come from: more partners in the United Kingdom, where it already has three offices and knows the market, or a bigger presence in Hong Kong, Singapore and the United Arab Emirates, where the offices exist but are small. Appendix F sets out the two options.

Source: information sourced from Mishcon de Reya LLP, results for 2024/25

Appendix E: Mishcon de Reya LLP profit and members, analyst estimates

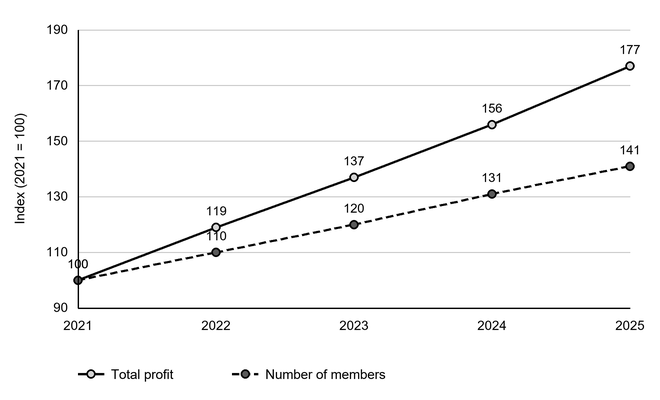
Line chart of indexed total profit and number of members, with 2021 = 100. From 2021 to 2025, profit rises from 100 to 177, while members rise from 100 to 141.
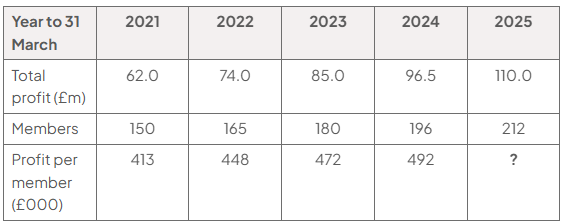
Table for years to 31 March 2021 to 2025: total profit (£m) 62.0, 74.0, 85.0, 96.5, 110.0; members 150, 165, 180, 196, 212; profit per member (£000) 413, 448, 472, 492, ?.

Source: Analyst

Appendix E presents Mishcon de Reya LLP's profit and its number of members as index numbers, with 2021 set at 100.

Analyse one way in which presenting the two figures as index numbers might help the partners understand how the firm has grown.

2
6 marks

Source B: Cranswick plc

Cranswick plc, listed on the London Stock Exchange, supplies fresh pork, poultry, cooked meats, pastry, sandwiches and pet food to supermarkets, to foodservice customers such as restaurant chains, and to export markets.

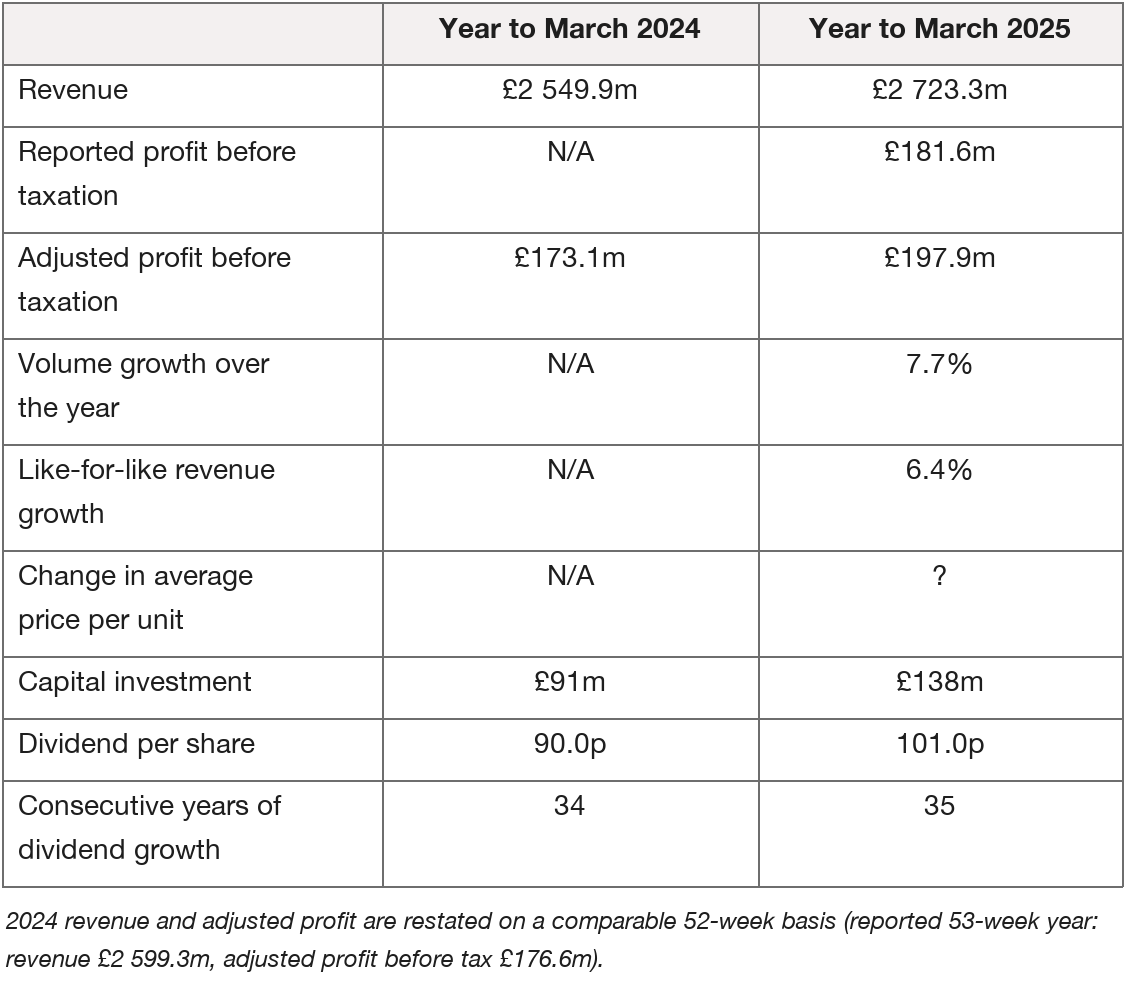
The year to March 2025 was a strong one. The previous financial year was 53 weeks long, so the company compares the two years on a 52-week basis. On that basis, revenue rose 6.8% to £2 723.3 million and adjusted profit before tax rose 14.3% to £197.9 million. Reported profit before tax was £181.6 million. Like-for-like revenue, which strips out the effect of businesses bought or sold, rose 6.4%.

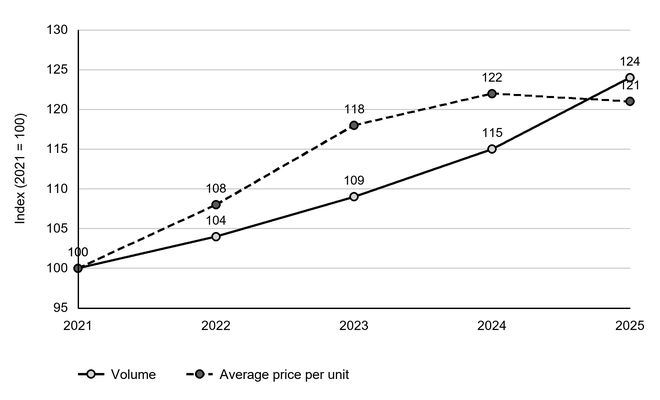
The volume figure is the interesting one. Cranswick sold 7.7% more food than the year before, which is more than its revenue grew. Appendix E shows what has been happening to volumes and to the average price of a unit over five years: prices rose steeply through the inflation of 2022 and 2023, and have now started to come back down while volumes keep climbing.

The company has been spending. Capital investment reached a record £138 million, up from £91 million, going into extra capacity and into making its existing factories more efficient. Its largest customers are a small number of supermarkets, each of which buys in enormous quantities and negotiates hard.

Cranswick has raised its dividend every year for 35 years, and raised it again this year by 12.2% to 101.0p a share.

Source: information sourced from Cranswick plc preliminary results for the year ended March 2025

Appendix D: Cranswick plc selected results

Table comparing Cranswick’s 2024 and 2025 results: revenue £2,549.9m to £2,723.3m, adjusted profit £173.1m to £197.9m, investment £91m to £138m, and dividends 90.0p to 101.0p.

Source: Cranswick plc

Appendix E: Cranswick plc volume and average price per unit, analyst estimates

Line chart of Cranswick’s volume and average price per unit index (2021 = 100), 2021–2025: volume rises 100, 104, 109, 115, 124; price rises 100, 108, 118, 122, then falls to 121.

Source: Analyst

Cranswick plc sold 7.7% more food than the year before, while its revenue rose 6.8%.

Analyse one way in which comparing these two figures might help Cranswick plc understand its market.

3
6 marks

Source A: Nationwide Building Society

Nationwide is the world's largest building society and the second largest mortgage lender in the United Kingdom. It is a mutual, which means it has no shareholders. It is owned by its members, who are the people who bank, save or hold a mortgage with it, and in principle every member is an owner. Nobody outside the membership has a claim on its profit.

That changes what profit is for. A listed bank divides its profit between dividends to shareholders and money kept in the business. Nationwide has no shareholders to pay, so it keeps almost all of its profit in the business to build its financial strength, and gives value to members in two other ways. The first is pricing, through better savings rates and lower mortgage rates. In the year to 31 March 2025 it put this at £1 795 million of member financial benefit, which is its estimate of how much better off its members were than they would have been with a typical high street bank. The second is direct payments: £1 000 million paid to eligible members through the Fairer Share Payment and a one-off reward called The Big Nationwide Thank You. Both reach members before profit is calculated, so neither is paid out of profit.

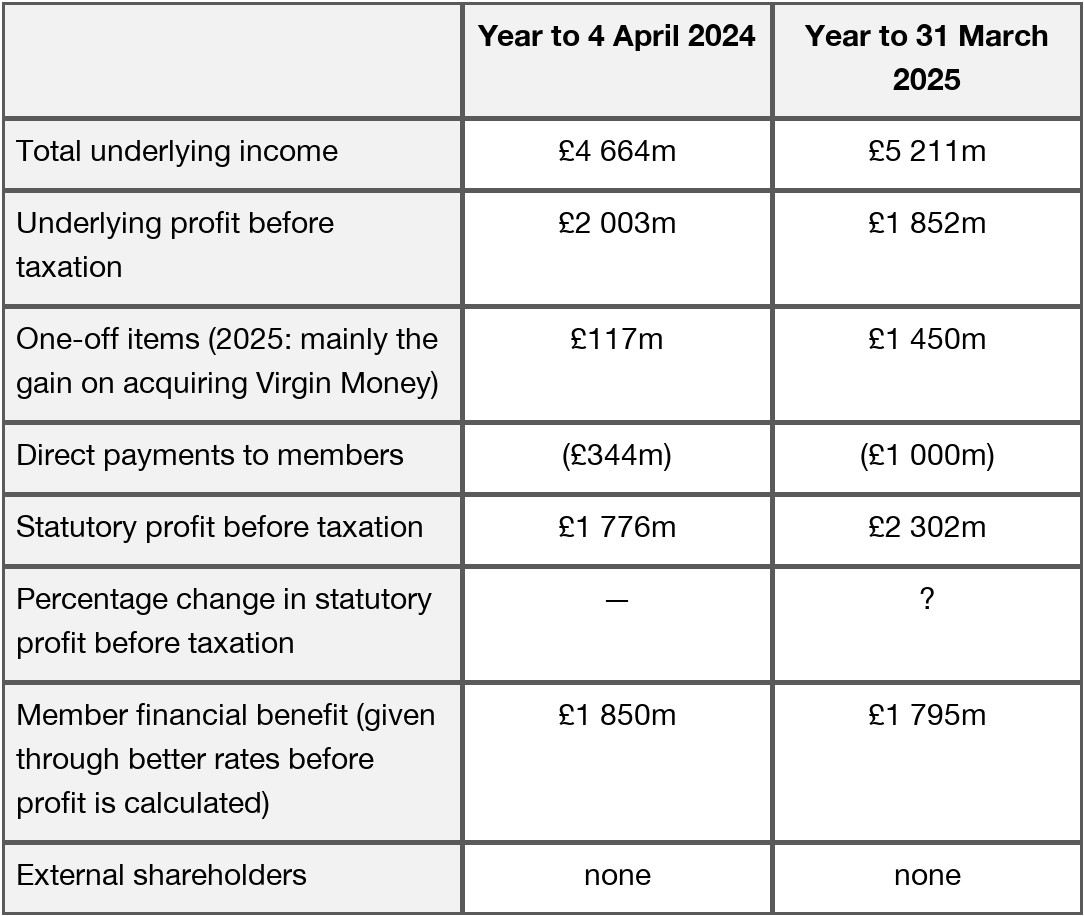
The year was a large one. On 1 October 2024 Nationwide completed the acquisition of Virgin Money, a bank with its own customers, brand and business lending arm. Statutory profit before tax rose to £2 302 million from £1 776 million, even after the direct payments to members. The rise was mainly due to a one-off accounting gain of £2.3 billion on buying Virgin Money, which arose because the assets acquired were valued at more than the £2.8 billion price. Underlying profit before tax, which leaves out one-off items and the direct payments, fell to £1 852 million from £2 003 million, which the society put down to its decision to pay members better rates. Total underlying income reached £5.2 billion, and Pay.UK switching data for the nine months to December 2024 showed more current account switchers moving to Nationwide than to any other brand.

Buying a bank is an unusual thing for a mutual to do. Virgin Money's customers did not choose a mutual, and integrating it will take years and a great deal of money. Every pound spent on that integration is a pound not returned to members this year, which is the tension the society is now living with.

Source: information sourced from Nationwide Building Society preliminary results for the year ended 31 March 2025

Appendix A: Nationwide Building Society selected results

Table comparing Nationwide results for 2024 and 2025: underlying income £4,664m/£5,211m; underlying profit £2,003m/£1,852m; one-off items £117m/£1,450m; member payments £344m/£1,000m; statutory profit £1,776m/£2,302m; member benefit £1,850m/£1,795m; no external shareholders.

Source: Nationwide Building Society

Pay.UK switching data showed more current account switchers moving to Nationwide Building Society than to any other brand.

Analyse one way in which this ranking might help Nationwide Building Society judge how well it is competing.

4
6 marks

Source A: Bunzl plc

Bunzl plc is a distribution and services group. It does not make much: it buys products from manufacturers, holds them, and delivers them to businesses that need them regularly but do not want to manage the supply themselves. Its customers are in cleaning and hygiene, safety, healthcare, foodservice and grocery, and they are spread across more than 30 countries.

A hospital does not want to negotiate with forty suppliers for gloves, wipes and aprons. Bunzl sells it one relationship. That is the business.

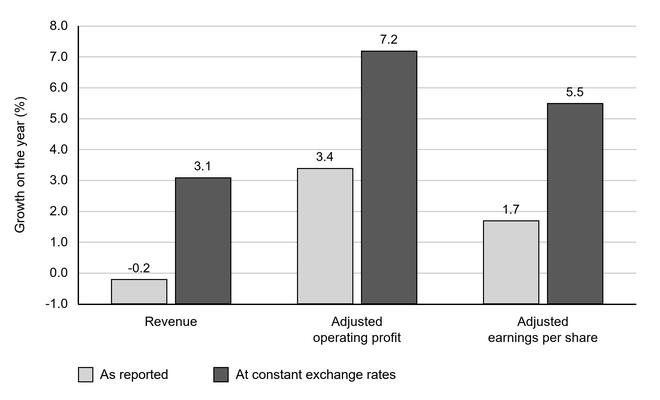
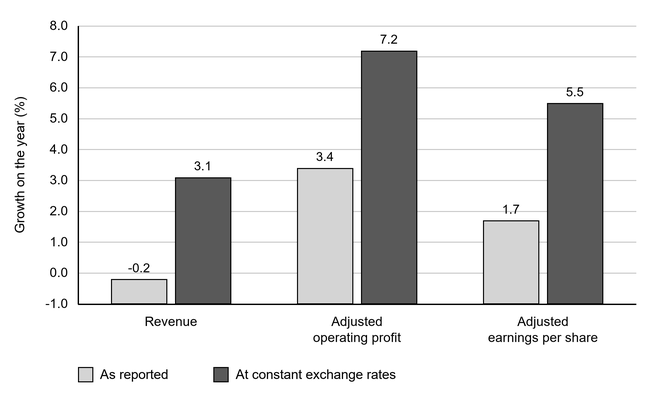
The year to 31 December 2024 produced an odd set of numbers. Revenue was £11 776.4 million against £11 797.1 million, which is a fall of 0.2%. But at constant exchange rates, which strips out the effect of the pound moving against other currencies, revenue rose 3.1%. Adjusted operating profit rose 3.4% as reported and 7.2% at constant rates. Appendix B shows the two measures side by side.

The margin improved, from 8.0% to 8.3%. Bunzl puts that down partly to selling more of its own brand products, which it sources itself rather than buying from a manufacturer whose name is on the box, and partly to the businesses it has bought.

Buying businesses is how Bunzl grows. During 2024 it completed 15 acquisitions, 13 of them announced, and committed a record £883 million to them. Those businesses are expected to add £744 million of revenue and £72 million of adjusted operating profit in a full year.

Adjusted earnings per share reached 194.3p and the dividend rose 8.2% to 73.9p. Cash conversion was 93%.

Source: information sourced from Bunzl plc annual results for the year ended 31 December 2024

Appendix A: Bunzl plc selected results

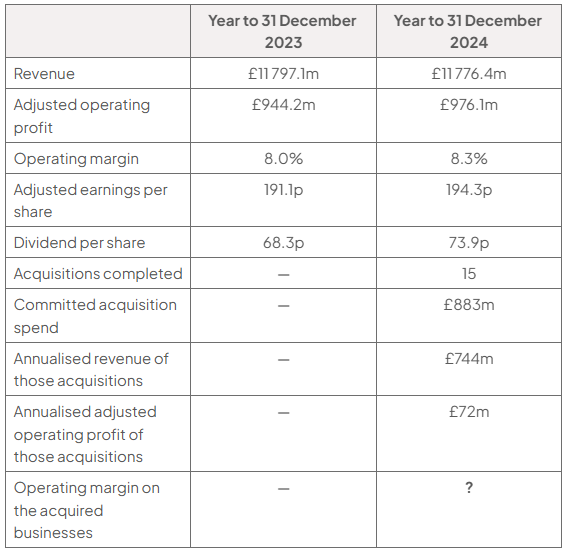
Selected-results table comparing Bunzl in 2023 and 2024: adjusted operating profit £944.2m to £976.1m, margin 8.0% to 8.3%, EPS 191.1p to 194.3p, and dividend 68.3p to 73.9p.

Source: Bunzl plc

Appendix B: Bunzl plc growth, as reported and at constant exchange rates

Bar chart of Bunzl’s 2024 growth, where constant exchange rates exceed reported figures: revenue −0.2% versus 3.1%, adjusted operating profit 3.4% versus 7.2%, and adjusted EPS 1.7% versus 5.5%.
  • Constant exchange rates restate the prior year using this year's exchange rates so that currency movements do not affect the comparison.

Source: Bunzl plc

Bunzl plc's revenue fell 0.2% as reported and rose 3.1% at constant exchange rates.

Analyse one way in which these two figures might affect how Bunzl plc's managers judge its sales growth in 2024.

5
6 marks

Source A: Meadowbank Pet Foods Ltd

Meadowbank Pet Foods Ltd makes dry dog food at a single factory in Shropshire. It is a private limited company owned by Ros Calderwood, who started it after eleven years as a vet, and it employs 34 people.

It does not sell in supermarkets and has never wanted to. Its food reaches customers through independent pet shops, veterinary practices and its own website, where about a third of customers buy on a repeating subscription. A 12 kilogram bag costs £48. Supermarket own label sells at around £22 for the same weight, and the mid-range brands sit between the two.

What the company sells is an explanation. Every bag lists the percentage of each ingredient, names the farm the meat came from and carries a batch number that a customer can look up. Ros Calderwood's view is that people who read the label are the only customers worth having, because they are the ones who do not switch when a rival runs a promotion.

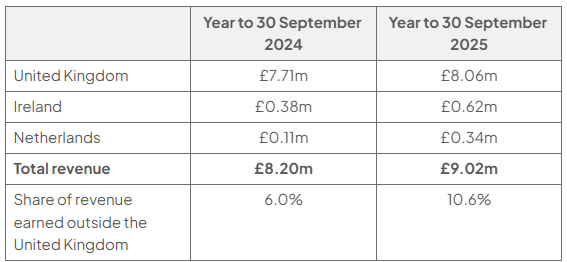
Last year Meadowbank Pet Foods Ltd took £9.02 million, up from £8.20 million. Almost all of it is still British: £8.06 million against £7.71 million the year before. The two export markets are small and growing quickly. Ireland went from £0.38 million to £0.62 million and the Netherlands from £0.11 million to £0.34 million, both sold through independent pet shops in the same way as at home.

Ros Calderwood has £400 000 to spend and two ways to spend it. She has been offered a distributor in Germany, which is the largest pet food market in Europe and one Meadowbank Pet Foods Ltd has never sold into. Or she can spend the money at home, where growth has slowed to 4.5% and where nine tenths of the revenue already is.

Before deciding anything she ran a test. For three months the price of the 12 kilogram bag went up from £48 to £52, and she watched what happened to the number of bags sold.

Appendix A: Meadowbank Pet Foods Ltd, revenue by market

Revenue by market (£m), years to 30 September 2024 and 2025: UK 7.71 to 8.06; Ireland 0.38 to 0.62; Netherlands 0.11 to 0.34; total 8.20 to 9.02. Outside-UK share: 6.0% to 10.6%.

Source: Analyst

Meadowbank Pet Foods Ltd's revenue grew from £8.20 million to £9.02 million last year. Its revenue in Ireland grew from £0.38 million to £0.62 million over the same period.

Analyse one way in which looking at growth in each market separately might affect the decisions Ros Calderwood makes about where to sell.

6
6 marks

Source A: Pelham Audio Ltd

Pelham Audio Ltd designs and builds studio headphones and microphones in Cambridge. It is a private limited company founded by Nadia Sokolova and it employs 41 people, fourteen of them engineers.

For twenty years its customers were recording studios: a few thousand of them worldwide, buying expensive equipment and keeping it for a decade. That is still where the reputation comes from. It is no longer where most of the units go. Podcasters, musicians recording at home and people making video for a living now buy more Pelham Audio Ltd equipment than studios do, at less than a fifth of the price per item.

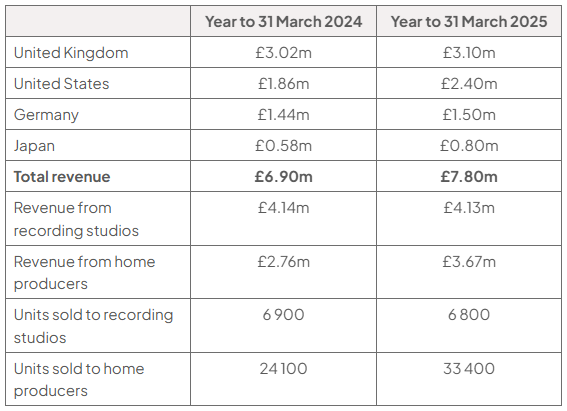
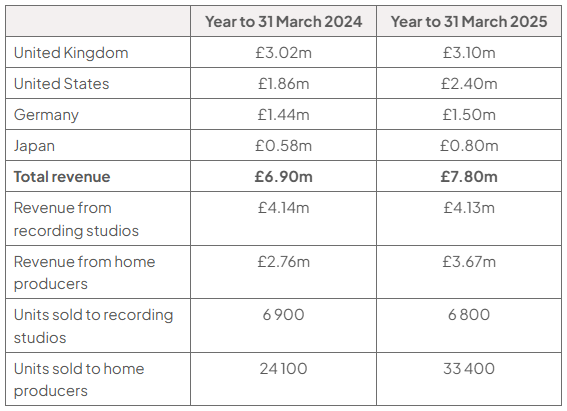
Last year revenue was £7.8 million. The United Kingdom accounted for £3.1 million, the United States £2.4 million, Germany £1.5 million and Japan £0.8 million. Everything is sold either through specialist dealers or directly from the company's own website.

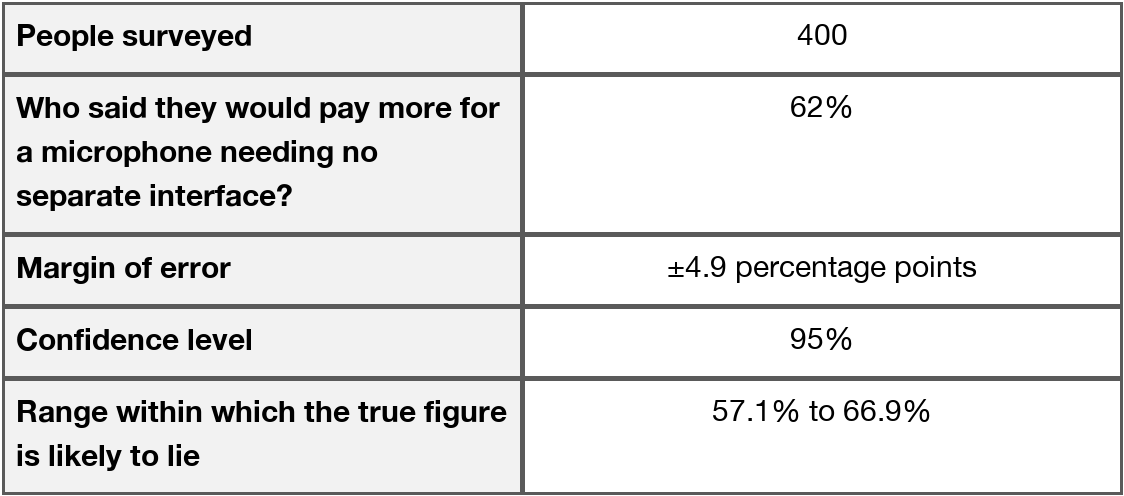
Nadia Sokolova has spent money on finding things out. The company now knows what each dealer sells, what its website visitors look at before they buy, and what its customers say when asked. In February it commissioned a survey of 400 home producers, which found that 62% would pay more for a microphone that plugs straight into a computer without a separate audio interface. The research company reported the result with a margin of error of 4.9 percentage points at the 95% confidence level.

The data has produced two questions rather than one answer. The first is which country to put money behind next. The second is larger: whether Pelham Audio Ltd is a company that makes equipment for studios and happens to sell some to home producers, or the other way round.

Appendix A: Pelham Audio Ltd, revenue by market and by customer

Table comparing years to 31 March 2024 and 2025: 2024 revenue was UK £3.02m, US £1.86m, Germany £1.44m, Japan £0.58m and total £6.90m; studio revenue £4.14m and 6,900 units, home-producer revenue £2.76m and 24,100 units.

Source: Analyst

Appendix A shows that Pelham Audio Ltd sold 6 800 units to recording studios last year and 33 400 units to home producers.

Analyse one way in which looking at units sold as well as revenue might affect what Nadia Sokolova understands about her customers.

7
6 marks

Source A: Marchmont Paper Co. Ltd

Marchmont Paper Co. Ltd makes notebooks, planners and page-a-day diaries in a converted mill in Hebden Bridge. It is a private limited company owned by Ines Marchmont and Tom Prideaux, and it employs 28 people. The paper is milled in Cumbria, the covers are cloth-bound by hand, and a planner sells for around £24.

Revenue last year was £3.8 million. Of that, £2.7 million came from the United Kingdom, £664 000 from Japan, £397 800 from France and £38 200 from everywhere else. Inside the UK figure, £1.4 million was taken on Marchmont Paper Co. Ltd's own website and £1.3 million through about 400 independent stationers and one department store chain.

Ines Marchmont buys a market report each year. It values the UK market for premium paper stationery at £210 million and covers sales made through stationery shops only. Marchmont Paper Co. Ltd's shop sales of £1.3 million give it a share of 0.62% on that basis. Just over half of what the company actually sells in the UK is not in the report at all.

The marketing objective for this year, written into a plan every January and reviewed the following January, is to grow revenue by 25%.

Japan is where the plan has been working and not working at the same time. Until 2024 Marchmont Paper Co. Ltd sold direct to about 90 Japanese shops. In 2025 it moved to a single distributor, which buys in bulk and sells on. The number of items sold rose sharply. What came back did not.

Marchmont Paper Co. Ltd knows very little about who buys its planners. The website asks one question at checkout, "what will you use this for?", and roughly a fifth of customers answer it. Nobody has ever spoken to a customer who bought from a shop.

The market report Marchmont Paper Co. Ltd buys covers sales made through stationery shops only. Just over half of Marchmont Paper Co. Ltd's own UK sales are made on its website.

Analyse one way in which this might affect the conclusions Marchmont Paper Co. Ltd draws about its share of the market.

1
9 marks

Source A: Kids Planet Day Nurseries Ltd

Kids Planet Day Nurseries Limited runs day nurseries for children below school age. Clare Roberts set the business up in Cheshire in 2008 and has been a director since the August of that year. Its registered activity is pre-primary education and its head office is still in Lymm, near Warrington.

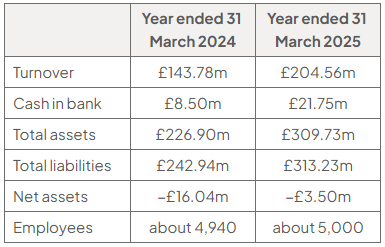
The company has grown mainly by buying other nurseries rather than by building new ones. It is now the parent of a group of 152 companies, most of them businesses it has taken over, and it holds 69 properties, 28 of which it owns outright and 41 of which it leases. It employs around 5 000 people. There is a single shareholder.

Growth has been fast. Turnover rose by 42.3% in the year to 31 March 2025, reaching £204.56 million, and cash at the bank more than doubled. But buying nurseries has been paid for largely by borrowing. The group's total liabilities are now slightly larger than its total assets, which means its net assets are negative. That figure is moving in the right direction: net assets improved from minus £16.04 million to minus £3.50 million over the year.

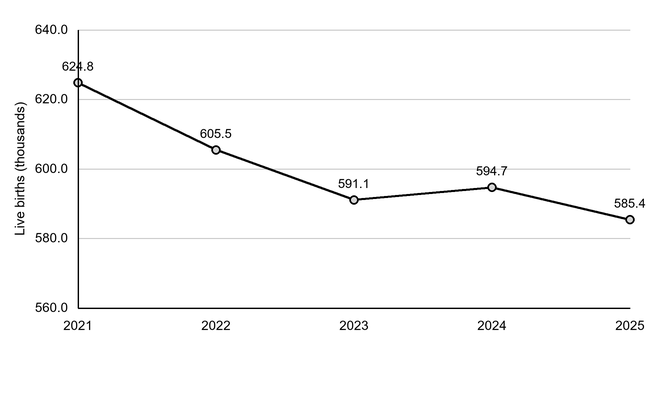
The number of children available to fill nursery places is not fixed. Live births in England and Wales have fallen in three of the past four years, from 624 828 in 2021 to 585 396 in 2025. Appendix B shows the trend. The government also pays for a set number of childcare hours for many families, so a nursery's income comes partly from parents and partly from the state.

The directors must now decide whether to carry on buying nurseries.

Source: information sourced from Companies House and the Office for National Statistics, 2026

Appendix A: Kids Planet Day Nurseries Ltd selected financial data

Table comparing selected data for years ended 31 March 2024 and 2025: turnover £143.78m/£204.56m; cash £8.50m/£21.75m; assets £226.90m/£309.73m; liabilities £242.94m/£313.23m; net assets −£16.04m/−£3.50m; employees about 4,940/5,000.

Source: Companies House

Appendix B: Live births in England and Wales

Line chart of live births in England and Wales, in thousands, falling overall from 624.8 in 2021 to 585.4 in 2025, with a small rise from 591.1 in 2023 to 594.7 in 2024.

Source: Office for National Statistics

Assess whether the fall in the number of live births is likely to reduce Kids Planet Day Nurseries Ltd's revenue.

Calculate the percentage change in live births between 2021 and 2025 to support your answer.

Give your answer to one decimal place.

2
9 marks

Source A: Kids Planet Day Nurseries Ltd

Kids Planet Day Nurseries Limited runs day nurseries for children below school age. Clare Roberts set the business up in Cheshire in 2008 and has been a director since the August of that year. Its registered activity is pre-primary education and its head office is still in Lymm, near Warrington.

The company has grown mainly by buying other nurseries rather than by building new ones. It is now the parent of a group of 152 companies, most of them businesses it has taken over, and it holds 69 properties, 28 of which it owns outright and 41 of which it leases. It employs around 5 000 people. There is a single shareholder.

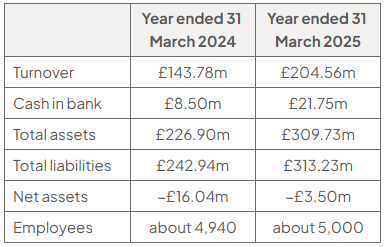
Growth has been fast. Turnover rose by 42.3% in the year to 31 March 2025, reaching £204.56 million, and cash at the bank more than doubled. But buying nurseries has been paid for largely by borrowing. The group's total liabilities are now slightly larger than its total assets, which means its net assets are negative. That figure is moving in the right direction: net assets improved from minus £16.04 million to minus £3.50 million over the year.

The number of children available to fill nursery places is not fixed. Live births in England and Wales have fallen in three of the past four years, from 624 828 in 2021 to 585 396 in 2025. Appendix B shows the trend. The government also pays for a set number of childcare hours for many families, so a nursery's income comes partly from parents and partly from the state.

The directors must now decide whether to carry on buying nurseries.

Source: information sourced from Companies House and the Office for National Statistics, 2026

Appendix A: Kids Planet Day Nurseries Ltd selected financial data

Table comparing 2024 and 2025 (years ended 31 March), with money in £m: turnover 143.78/204.56; cash 8.50/21.75; assets 226.90/309.73; liabilities 242.94/313.23; net assets −16.04/−3.50; employees about 4,940/5,000.

Source: Companies House

Appendix C: Kids Planet Day Nurseries Ltd scale

  • Companies in the group = 152

  • Properties held = 69 (28 owned outright, 41 leased)

  • Employees = about 5 000

  • Year the business was set up = 2008

Source: Companies House

Assess whether being part of a group of 152 companies is likely to make Kids Planet Day Nurseries Ltd more competitive than nurseries that run only one or two sites.

3
9 marks

Source A: The Gym Group plc

The Gym Group plc runs low cost gyms. It opened its first in 2008 and is now a public limited company with shares traded on the London Stock Exchange. It describes itself as a leading low cost gym operator and its offer as high value, low cost. Members pay by the month, there is no long contract to sign, and the gyms are open 24 hours a day.

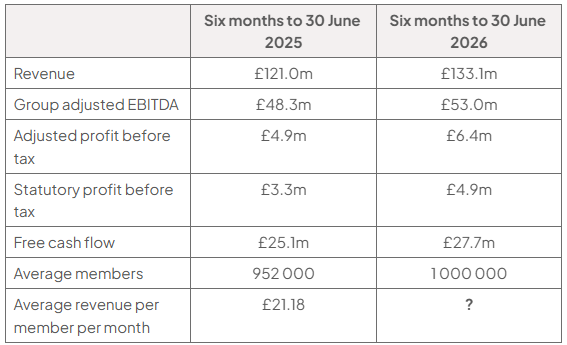
The company calls its approach a labour light business model. Gyms are largely self-service, so a site can run with a small team, and the savings go into the price rather than into staff on the front desk. In the six months to 30 June 2026 The Gym Group had an average of one million members, up 5% on the same period a year earlier, and average revenue per member per month rose 5%.

Growth comes from two places. The company opens new gyms, and it improves the ones it already has. Four new sites opened in the first half of 2026, with eleven more being built, and it expects to open at least 20 during the year as part of a plan to open around 75 over three years, paid for out of its own cash. It also refurbishes older gyms to a newer design. Three were refurbished in the first half of 2026 and eighteen more were planned for the second half. Gyms refurbished during 2025 went on to win 10% more members than before.

The business is not short of demand, but it is carrying a lot of debt. At the end of 2025 its total liabilities were £474.2 million against total assets of £615.9 million, and it held only £3 million in cash. The company says its aim is a 30% return on the money invested in its mature gyms, and it is buying back some of its own shares.

Source: The Gym Group plc interim results, 9 September 2026, and Companies House

Appendix A: The Gym Group plc results for the six months ended 30 June 2026

Table comparing six months to 30 June 2025 and 2026: revenue rose from £121.0 million to £133.1 million, average members from 952,000 to 1,000,000, and average revenue per member was £21.18 and unknown.

Source: The Gym Group plc

Assess which contributed more to The Gym Group plc's revenue growth in the six months to 30 June 2026: the number of members, or the amount each member paid.

Calculate the percentage change in The Gym Group plc's revenue between the six months ended 30 June 2025 and the six months ended 30 June 2026 to support your answer.

Give your answer to one decimal place.

4
9 marks

Source B: Home Instead Ltd

Home Instead Limited arranges care for older people in their own homes: help with washing and dressing, meals, medication, shopping and company. It has been trading in the United Kingdom since 2005 from an office near Warrington, and it is owned by an American company.

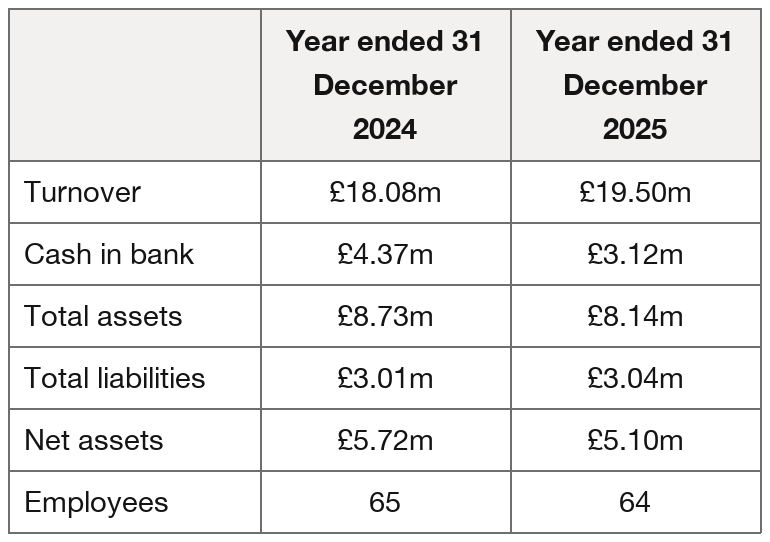
Home Instead does not provide the care itself. It is a franchisor. Local business owners buy the right to run a Home Instead office in a particular area, and in return they use the name, the training and the systems, and pay a fee on everything they sell. Those franchisees recruit and employ the carers. This is why the company's accounts look so unusual for a care business: turnover of £19.5 million but only 64 employees, because almost everybody who does the work is employed by somebody else.

The market is growing. The Office for National Statistics projects that the number of people in the UK at state pension age will rise from 12.0 million in mid-2022 to 13.7 million by mid-2032, an increase of 13.8%, while the population as a whole grows by 7.3%. Older people are becoming a larger share of the country, and most of them would prefer to stay in their own homes.

The company's own finances moved in two directions during 2025. Turnover rose 7.9% to £19.5 million. But cash at the bank fell by 28.8% to £3.12 million and net assets fell by 10.8% to £5.10 million.

Home Instead now has a choice about how to grow. It could recruit more franchisees to cover the areas it does not reach. Or it could buy back some territories and run them itself, employing the carers directly.

Source: information sourced from Companies House and the Office for National Statistics, 2026

Appendix D: Home Instead Ltd selected financial data

Table comparing Home Instead Ltd’s selected financial data for years ended 31 December 2024 and 2025: turnover £18.08m/£19.50m; cash £4.37m/£3.12m; assets £8.73m/£8.14m; liabilities £3.01m/£3.04m; net assets £5.72m/£5.10m; employees 65/64.

Source: Companies House

Assess whether the growing number of older people is likely to make the home care market harder for Home Instead Ltd to compete in.

5
9 marks

Source A: Bunzl plc

Bunzl plc is a distribution and services group. It does not make much: it buys products from manufacturers, holds them, and delivers them to businesses that need them regularly but do not want to manage the supply themselves. Its customers are in cleaning and hygiene, safety, healthcare, foodservice and grocery, and they are spread across more than 30 countries.

A hospital does not want to negotiate with forty suppliers for gloves, wipes and aprons. Bunzl sells it one relationship. That is the business.

The year to 31 December 2024 produced an odd set of numbers. Revenue was £11 776.4 million against £11 797.1 million, which is a fall of 0.2%. But at constant exchange rates, which strips out the effect of the pound moving against other currencies, revenue rose 3.1%. Adjusted operating profit rose 3.4% as reported and 7.2% at constant rates. Appendix B shows the two measures side by side.

The margin improved, from 8.0% to 8.3%. Bunzl puts that down partly to selling more of its own brand products, which it sources itself rather than buying from a manufacturer whose name is on the box, and partly to the businesses it has bought.

Buying businesses is how Bunzl grows. During 2024 it completed 15 acquisitions, 13 of them announced, and committed a record £883 million to them. Those businesses are expected to add £744 million of revenue and £72 million of adjusted operating profit in a full year.

Adjusted earnings per share reached 194.3p and the dividend rose 8.2% to 73.9p. Cash conversion was 93%.

Source: information sourced from Bunzl plc annual results for the year ended 31 December 2024

Appendix C: Own brand and branded products, analyst estimates

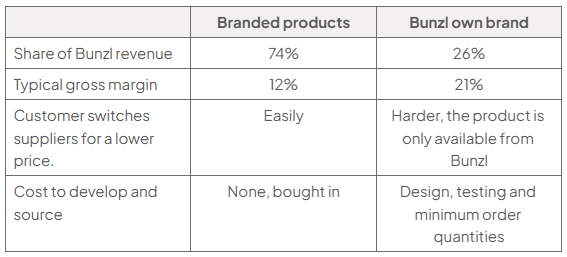
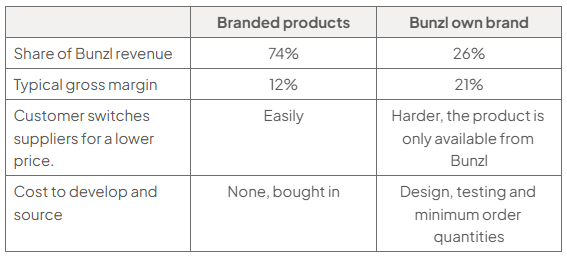
Table comparing branded products with Bunzl own brand: revenue share, 74% versus 26%; gross margin, 12% versus 21%; supplier switching, easy versus harder as only Bunzl supplies it; costs, none versus design, testing and minimum orders.

Source: Analyst

Assess whether Bunzl plc's customers are likely to accept their own brand products in place of the brands they know.

6
9 marks

Source A: Softcat plc

Softcat plc sells technology to other organisations. If a company needs 400 laptops, a new firewall, a cloud contract and someone to set it all up, it can deal with a dozen manufacturers or it can deal with Softcat. It is a public limited company listed in London, and it sells to about 10 200 customers: businesses of every size and a large amount of public sector work.

Softcat does not describe its own size the way most companies do, and the reason is worth understanding. When it sells a laptop it buys the laptop and sells it on, so the whole price counts as its revenue. When it sells a software licence it is acting more as an agent for the software company, and accounting rules require it to count only the commission it keeps, not the price the customer paid. Two sales of exactly the same value to the customer therefore appear in Softcat's accounts at completely different sizes.

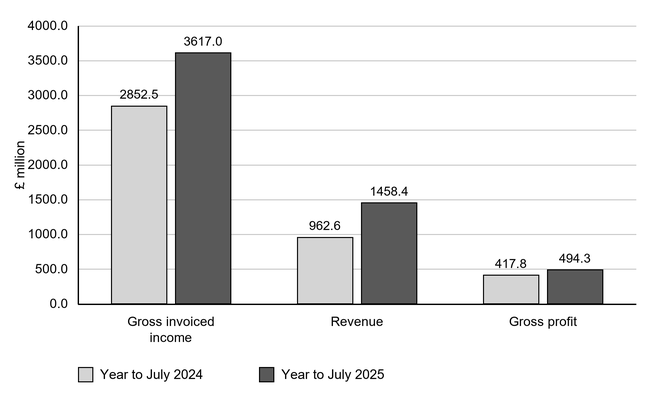
That is why it publishes a third figure. Gross invoiced income is the total value of everything it invoiced, whichever way the accounting treats it, and Softcat regards gross profit as its main measure of scale.

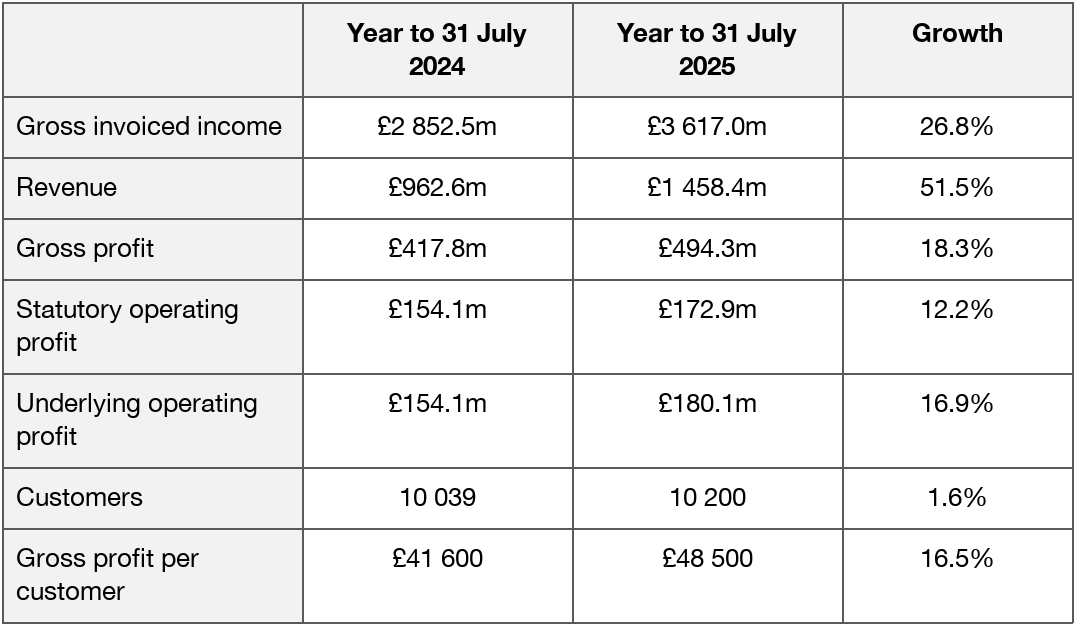
In the year to 31 July 2025 all three grew, and none of them agreed with the others. Gross invoiced income rose 26.8% to £3 617.0 million. Revenue rose 51.5% to £1 458.4 million. Gross profit rose 18.3% to £494.3 million. Statutory operating profit rose 12.2% to £172.9 million and underlying operating profit rose 16.9% to £180.1 million. Appendix B shows the three top-line measures together.

Behind all of it, the customer numbers barely moved. Softcat served 10 200 customers, 1.6% more than the year before, and gross profit per customer rose 16.5% to £48 500. It also completed its first acquisition.

Source: information sourced from Softcat plc preliminary results for the year ended 31 July 2025

Appendix A: Softcat plc selected results

Table comparing Softcat results for years to 31 July 2024 and 2025: 2024 gross invoiced income £2,852.5m, revenue £962.6m, gross profit £417.8m, operating profits £154.1m, 10,039 customers and £41,600 gross profit per customer.

Source: Softcat plc

Appendix B: Three measures of Softcat plc's size

Grouped bar chart of Softcat’s size measures in years to July 2024 and 2025: gross invoiced income £2,852.5m to £3,617.0m, revenue £962.6m to £1,458.4m, and gross profit £417.8m to £494.3m.

Source: Softcat plc

Assess whether Softcat plc is likely to keep growing if the number of customers it serves stays flat.

Calculate Softcat plc's gross profit margin in the year to 31 July 2025 to support your answer.

Give your answer to one decimal place.

7
9 marks

Source B: Dunelm Group plc

Dunelm Group plc sells homewares and furniture: curtains, bedding, cookware, lighting, storage, sofas. It is a public limited company and it sells through large out-of-town stores and through its website and app.

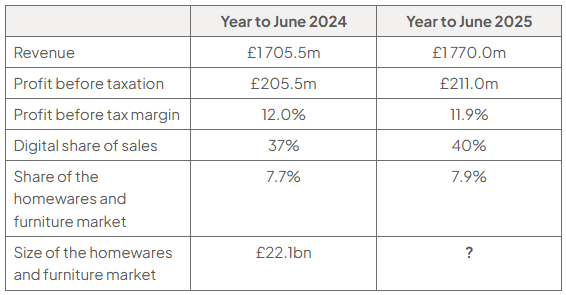
In the year to 28 June 2025 revenue rose 3.8% to £1.77 billion and profit before tax rose 2.7% to £211 million, with the margin slipping slightly to 11.9%. Its share of the combined homewares and furniture market rose from 7.7% to 7.9%, and the number of active customers, meaning people who have bought something within the last year, rose slightly.

The change underneath those figures is where the customer shops. Digital sales are now 40% of everything Dunelm sells, up from 37% the year before. Appendix E shows how that share has moved over five years.

The complication is that digital and stores are not two separate businesses with two separate customers. The same person browses online and buys in store, or measures an item in store and orders at home, or buys online and returns to a store. A sofa is rarely bought without being sat on. A set of tea towels rarely needs a visit. Dunelm has to work out what a customer actually wants from each part of the business, when that customer does not think of them as separate at all.

It now has to decide where the next investment goes. Appendix F sets out the options.

Source: information sourced from Dunelm Group plc preliminary results for the year ended 28 June 2025

Appendix D: Dunelm Group plc selected results

Table of Dunelm selected results for years to June 2024 and 2025: revenue £1,705.5m/£1,770.0m; profit before tax £205.5m/£211.0m; margin 12.0%/11.9%; digital sales 37%/40%; market share 7.7%/7.9%; market size £22.1bn/?.

Source: Dunelm Group plc

Assess whether the number of active customers is a useful measure for Dunelm Group plc to follow.

8
9 marks

Source B: Dunelm Group plc

Dunelm Group plc sells homewares and furniture: curtains, bedding, cookware, lighting, storage, sofas. It is a public limited company and it sells through large out-of-town stores and through its website and app.

In the year to 28 June 2025 revenue rose 3.8% to £1.77 billion and profit before tax rose 2.7% to £211 million, with the margin slipping slightly to 11.9%. Its share of the combined homewares and furniture market rose from 7.7% to 7.9%, and the number of active customers, meaning people who have bought something within the last year, rose slightly.

The change underneath those figures is where the customer shops. Digital sales are now 40% of everything Dunelm sells, up from 37% the year before. Appendix E shows how that share has moved over five years.

The complication is that digital and stores are not two separate businesses with two separate customers. The same person browses online and buys in store, or measures an item in store and orders at home, or buys online and returns to a store. A sofa is rarely bought without being sat on. A set of tea towels rarely needs a visit. Dunelm has to work out what a customer actually wants from each part of the business, when that customer does not think of them as separate at all.

It now has to decide where the next investment goes. Appendix F sets out the options.

Source: information sourced from Dunelm Group plc preliminary results for the year ended 28 June 2025

Appendix D: Dunelm Group plc selected results

Table of Dunelm selected results for years to June 2024 and 2025: revenue £1,705.5m/£1,770.0m; profit before tax £205.5m/£211.0m; margin 12.0%/11.9%; digital sales 37%/40%; market share 7.7%/7.9%; market size £22.1bn/?.

Source: Dunelm Group plc

Assess whether Dunelm Group plc is likely to be able to keep increasing its share of the homewares and furniture market.

Calculate the size of the homewares and furniture market in the year to June 2025 to support your answer.

Give your answer in £ billion to one decimal place.

1
15 marks

Source A: Bunzl plc

Bunzl plc is a distribution and services group. It does not make much: it buys products from manufacturers, holds them, and delivers them to businesses that need them regularly but do not want to manage the supply themselves. Its customers are in cleaning and hygiene, safety, healthcare, foodservice and grocery, and they are spread across more than 30 countries.

A hospital does not want to negotiate with forty suppliers for gloves, wipes and aprons. Bunzl sells it one relationship. That is the business.

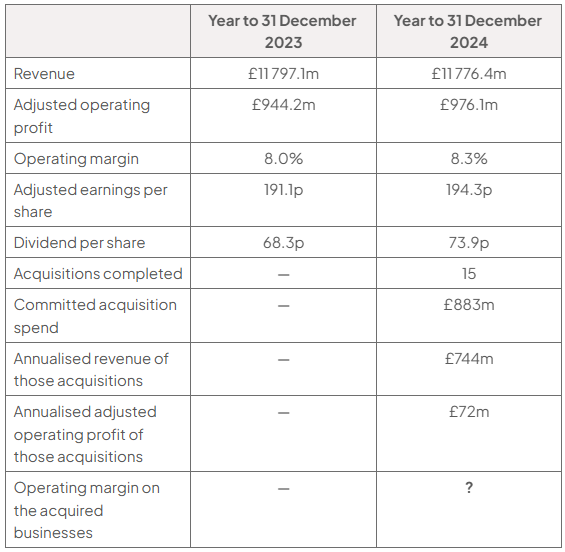
The year to 31 December 2024 produced an odd set of numbers. Revenue was £11 776.4 million against £11 797.1 million, which is a fall of 0.2%. But at constant exchange rates, which strips out the effect of the pound moving against other currencies, revenue rose 3.1%. Adjusted operating profit rose 3.4% as reported and 7.2% at constant rates. Appendix B shows the two measures side by side.

The operating margin improved, from 8.0% to 8.3%. Bunzl puts that down partly to selling more of its own brand products, which it sources itself rather than buying from a manufacturer whose name is on the box, and partly to the businesses it has bought.

Buying businesses is how Bunzl grows. During 2024 it completed 15 acquisitions, 13 of them announced, and committed a record £883 million to them. Those businesses are expected to add £744 million of revenue and £72 million of adjusted operating profit in a full year.

Adjusted earnings per share reached 194.3p and the dividend rose 8.2% to 73.9p. Cash conversion was 93%.

Source: information sourced from Bunzl plc annual results for the year ended 31 December 2024

Appendix A: Bunzl plc selected results

Table comparing Bunzl results for 2023 and 2024: revenue £11,797.1m/£11,776.4m; profit £944.2m/£976.1m; margin 8.0%/8.3%; EPS 191.1p/194.3p; dividend 68.3p/73.9p. 2024 acquisitions: 15, £883m spend, £744m revenue and £72m profit; margin unknown.

Source: Bunzl plc

Appendix B: Bunzl plc growth, as reported and at constant exchange rates

Bar chart of Bunzl’s 2024 growth, where constant-exchange-rate figures exceed reported figures: revenue −0.2% versus 3.1%, adjusted operating profit 3.4% versus 7.2%, and adjusted EPS 1.7% versus 5.5%. y-axis: −1% to 8%.
  • Constant exchange rates restate the prior year using this year's exchange rates so that currency movements do not affect the comparison.

Source: Bunzl plc

Appendix C: Own brand and branded products, analyst estimates

Table of analyst estimates comparing branded products with Bunzl own brand: revenue share 74% versus 26%; gross margin 12% versus 21%; switching suppliers is easy versus harder; sourcing costs none versus design, testing and minimum-order quantities.

Source: Analyst

In 2024 Bunzl plc's revenue fell 0.2% as reported, while its operating profit margin rose from 8.0% to 8.3%.

Evaluate whether Bunzl plc should judge its 2024 performance mainly on its sales growth or mainly on its operating profit margin.

2
15 marks

Source A: Pelham Audio Ltd

Pelham Audio Ltd designs and builds studio headphones and microphones in Cambridge. It is a private limited company founded by Nadia Sokolova and it employs 41 people, fourteen of them engineers.

For twenty years its customers were recording studios: a few thousand of them worldwide, buying expensive equipment and keeping it for a decade. That is still where the reputation comes from. It is no longer where most of the units go. Podcasters, musicians recording at home and people making video for a living now buy more Pelham Audio Ltd equipment than studios do, at less than a fifth of the price per item.

Last year revenue was £7.8 million. The United Kingdom accounted for £3.1 million, the United States £2.4 million, Germany £1.5 million and Japan £0.8 million. Everything is sold either through specialist dealers or directly from the company's own website.

Nadia Sokolova has spent money on finding things out. The company now knows what each dealer sells, what its website visitors look at before they buy, and what its customers say when asked. In February it commissioned a survey of 400 home producers, which found that 62% would pay more for a microphone that plugs straight into a computer without a separate audio interface. The research company reported the result with a margin of error of 4.9 percentage points at the 95% confidence level.

The data has produced two questions rather than one answer. The first is which country to put money behind next. The second is larger: whether Pelham Audio Ltd is a company that makes equipment for studios and happens to sell some to home producers, or the other way round.

Appendix A: Pelham Audio Ltd, revenue by market and by customer

Table comparing 2024/2025 revenue (£m): UK 3.02/3.10; US 1.86/2.40; Germany 1.44/1.50; Japan 0.58/0.80; total 6.90/7.80. Studio/home revenue 4.14/4.13 and 2.76/3.67; units 6,900/6,800 and 24,100/33,400.

Source: Analyst

Appendix B: Pelham Audio Ltd, survey of 400 home producers

Survey table: 400 home producers; 62% would pay more for a microphone needing no separate interface, with a 4.9-percentage-point margin of error at 95% confidence; likely true range 57.1%–66.9%.

Source: Analyst

Appendix A shows Pelham Audio Ltd's revenue in each of its four markets.

Evaluate whether Pelham Audio Ltd should use its sales figures or commission new research to decide which country to put money behind next.

3
15 marks

Source A: Marchmont Paper Co. Ltd

Marchmont Paper Co. Ltd makes notebooks, planners and page-a-day diaries in a converted mill in Hebden Bridge. It is a private limited company owned by Ines Marchmont and Tom Prideaux, and it employs 28 people. The paper is milled in Cumbria, the covers are cloth-bound by hand, and a planner sells for around £24.

Revenue last year was £3.8 million. Of that, £2.7 million came from the United Kingdom, £664 000 from Japan, £397 800 from France and £38 200 from everywhere else. Inside the UK figure, £1.4 million was taken on Marchmont Paper Co. Ltd's own website and £1.3 million through about 400 independent stationers and one department store chain.

Ines Marchmont buys a market report each year. It values the UK market for premium paper stationery at £210 million and covers sales made through stationery shops only. Marchmont Paper Co. Ltd's shop sales of £1.3 million give it a share of 0.62% on that basis. Just over half of what the company actually sells in the UK is not in the report at all.

The marketing objective for this year, written into a plan every January and reviewed the following January, is to grow revenue by 25%.

Japan is where the plan has been working and not working at the same time. Until 2024 Marchmont Paper Co. Ltd sold direct to about 90 Japanese shops. In 2025 it moved to a single distributor, which buys in bulk and sells on. The number of items sold rose sharply. What came back did not.

Marchmont Paper Co. Ltd knows very little about who buys its planners. The website asks one question at checkout, "what will you use this for?", and roughly a fifth of customers answer it. Nobody has ever spoken to a customer who bought from a shop.

Appendix B: Marchmont Paper Co. Ltd UK advertising spend and sales, by region

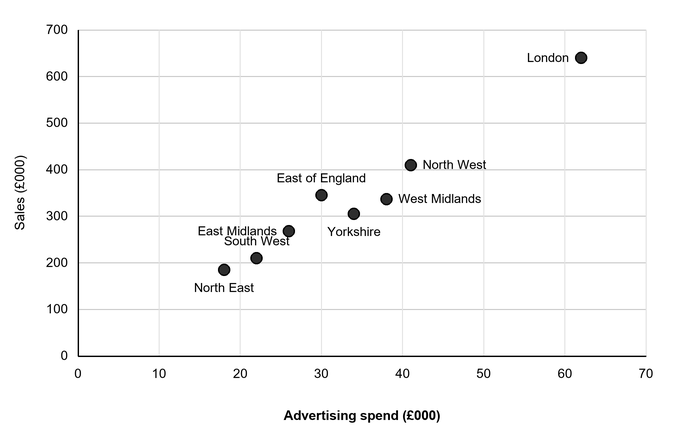
Scatter graph of regional advertising spend against sales, showing a positive relationship. Axes range from £0 to £70 000 spend and £0 to £700 000 sales; London is highest at £62 000 and £640 000, North East lowest at £18 000 and £185 000.

Source: Analyst

Appendix C: Two ways of setting next year's regional advertising budgets

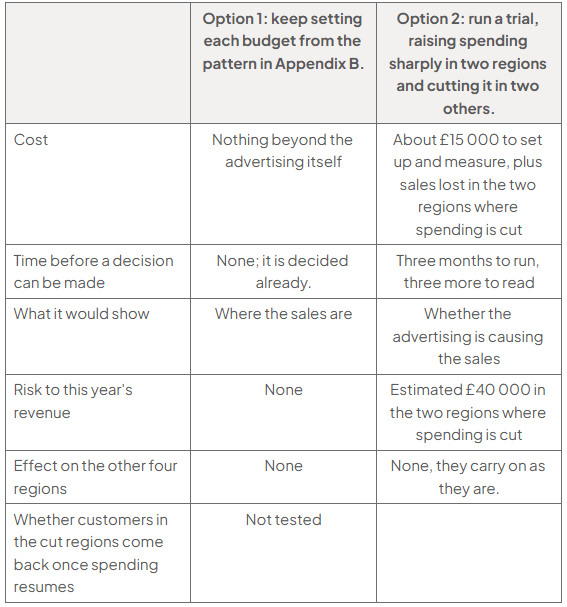
Table comparing regional advertising budgets: Option 1 follows Appendix B with no cost, delay or risk but tests neither causation nor recovery. Option 2 costs about £15 000 plus lost sales, takes three months to run and three to read, risks £40 000 of sales and shows whether advertising causes sales; whether customers return is not provided; other regions stay unchanged.

Source: Analyst

Appendix C sets out two ways in which Marchmont Paper Co. Ltd could decide next year's advertising budget for each region.

Evaluate both ways and recommend which one would be the better for Marchmont Paper Co. Ltd.