Quantitative Skills (AQA A Level Business): Revision Note
Syllabus Edition
First teaching 2026
First exams 2028
Exam code: 7132

Correlation
A correlation exists where there is a relationship or connection between two variables
Businesses often compare two variables, such as sales volume and advertising, to establish if there is any correlation between them
In this example, a business is investigating whether there is a correlation between the number of sales managers it employs and the volume of items it sells

Types of correlation
A positive correlation means that as one variable increases, so does the other variable
A line of best fit that slopes upwards can be identified
A negative correlation means that as one variable increases, the other variable decreases
A line of best fit that slopes downwards can be identified
No correlation means that there is no connection between the two variables
Therefore, it is not possible to identify a line of best fit

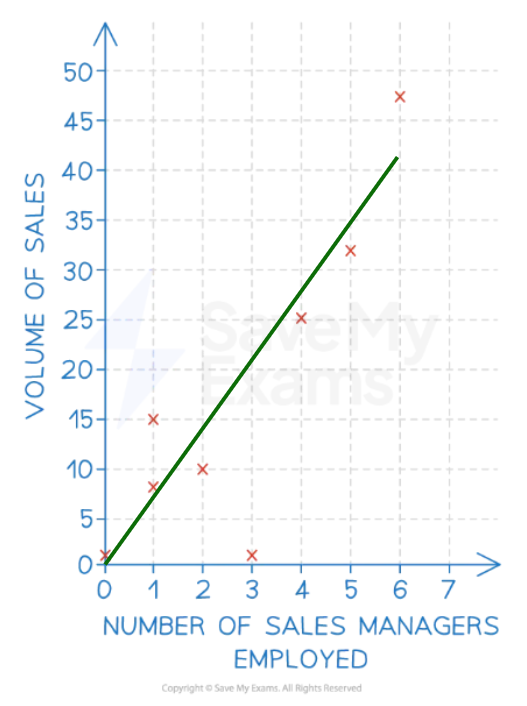
Correlation does not always indicate a relationship or causation between two sets of variables
Businesses need to conduct research to establish whether a relationship exists, as well as the strength of that relationship
Extrapolation
Extrapolation is the use of past data or trends to make predictions about the future by extending an existing pattern beyond the range of known figures
Where a line of best fit can be identified, and when causation is determined, a business can extrapolate the data to make predictions around changes to either of the variables
Extrapolating the line of best fit in the example below, the business could predict that employing seven sales managers would likely result in sales of 46 units
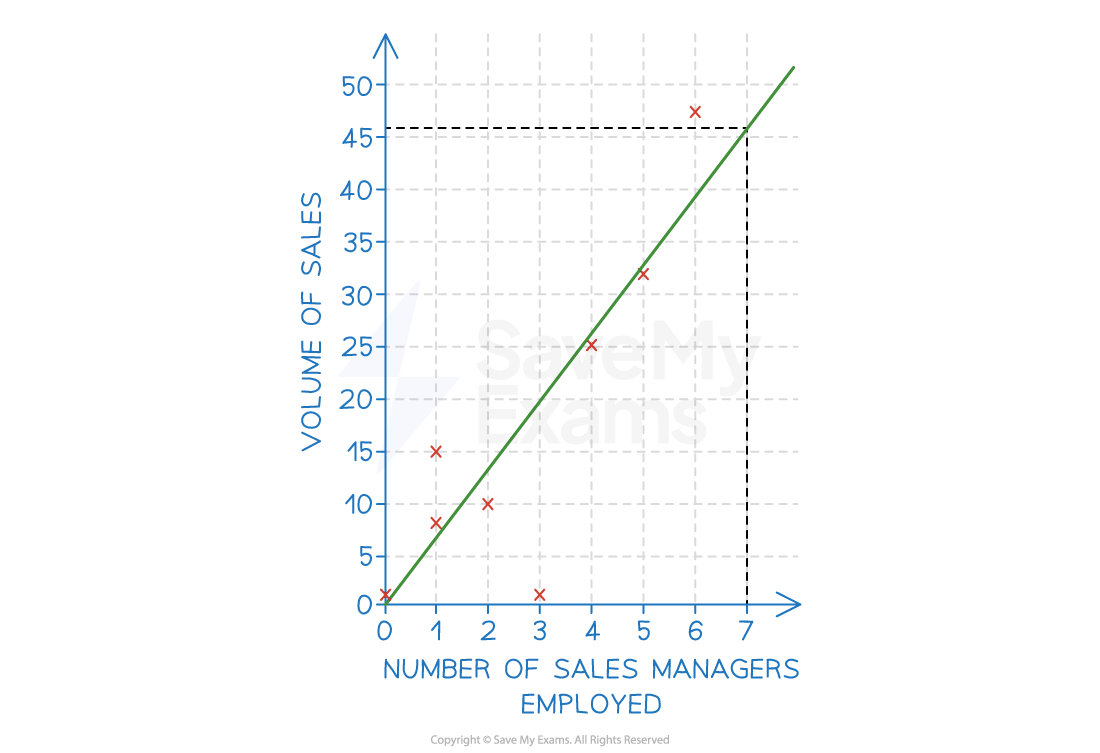
Extrapolation assumes that what has happened in the past will be the same as what will happen in the future
However, a range of examples demonstrates that this is not always the case
Economic shocks
A business extrapolating rising sales into early 2020 could not have predicted the sudden collapse in demand caused by COVID-19 lockdowns
Disruptive technology
Extrapolating Nokia's mobile phone sales in 2006 would have predicted continued dominance
The launch of the iPhone the following year made that projection meaningless almost immediately
Market saturation
A product growing rapidly in its early stages will not grow forever
Extrapolating early sales figures for a new product would overestimate future demand once the market approaches saturation
Changing consumer tastes
Extrapolating sales of sugary energy drinks in the early 2010s would have predicted continued growth, but rising health consciousness caused many consumers to switch to alternatives
New competition
A business with a growing market share cannot assume that trend will continue if a well-resourced rival enters the market
One-off events
A retailer that had an unusually strong year due to a viral social media moment cannot extrapolate that performance, as it was not driven by an underlying trend
Extrapolation is only reliable when market conditions remain broadly stable
Businesses often have no way of knowing when that stability is about to end
Index numbers
Index numbers standardise data by expressing all values relative to a chosen starting point
They are used to track and compare changes in a variable — such as sales, market size or price — over time
In business, index numbers are commonly used to analyse changes in sales performance, marketing spend and market conditions
How to calculate an index number
Formula
Step 1: Choose what to measure
Decide which variable to track
For example, monthly sales revenue, market size or average selling price
Step 2: Select a base period
Choose a starting point — typically an earlier year — and assign it an index value of 100
All other values are then expressed relative to this base period
Step 3: Collect the data
Gather the values for the chosen variable across all time periods to be compared
Step 4: Calculate and interpret
Apply the formula to each time period
An index value above 100 means the variable has increased relative to the base period
An index value below 100 means it has fallen
The difference between the index value and 100 shows the percentage change from the base period
Worked Example
A sports retailer recorded sales of £4m in 2021. By 2023, sales had grown to £4.8m.
(a) Using 2021 as the base year, calculate the index for 2023.
(b) Comment on the significance of this value.
(a) Index for 2023
(b) Significance of the index value
An index of 120 means sales in 2023 were 20% higher than in the base year
This indicates positive growth over the two-year period
However, to assess performance fully, the business should compare this against market growth
If the overall market grew by 30% over the same period, the business may be losing market share despite its rising sales
Examiner Tips and Tricks
A common mistake is to confuse the index value with the percentage change. An index of 120 does not mean a 120% increase — it means a 20% increase from the base year. Always subtract 100 from the index value to find the percentage change
Calculating percentages and percentage change
The ability to calculate percentages and percentage change is essential for analysing business and marketing data accurately
These skills appear throughout the course — from market share and sales growth to profit margins and budget analysis
Calculating a percentage
Used to express one value as a proportion of another, stated as a percentage
Commonly used in business to calculate market share, budget allocations and sales contributions
Formula
Worked Example
A business spends £15,000 on social media advertising from a total marketing budget of £60,000.
Calculate the percentage of the budget spent on social media.
Calculating percentage change
Used to measure how much a value has increased or decreased relative to its starting point
A positive result indicates an increase
A negative result indicates a decrease
Formula
Worked Example
A business's monthly sales grew from £80,000 to £96,000.
Calculate the percentage change in sales.
In this case, monthly sales grew by 20%
Worked Example
A business's website traffic fell from 50,000 visitors per month to 38,000.
Calculate the percentage change in traffic.
In this case, monthly traffic fell by 24%
Percentage change vs percentage points
These two terms are often confused but they mean very different things
A percentage point change is the arithmetic difference between two percentages
A percentage change measures how much one percentage has changed relative to its original value
Worked Example
A business's market share rises from 20% to 25%.
(a) Calculate the percentage point change in market share
(b) Calculate the percentage change in market share
(a) Percentage point change in market share
(b) Percentage change in market share
Examiner Tips and Tricks
The most common mistake when calculating percentage change is dividing by the new value instead of the original value— always divide by the starting figure. Also, take care to distinguish between a percentage point change and a percentage change: if market share rises from 10% to 15%, that is a 5 percentage point increase but a 50% percentage change. In an exam, read the question carefully to check which one is being asked for

Unlock more, it's free!
Join the 100,000+ Students that ❤️ Save My Exams
the (exam) results speak for themselves:

Was this revision note helpful?