Break-even Charts (AQA A Level Business): Revision Note
Syllabus Edition
First teaching 2026
First exams 2028
Exam code: 7132

The structure of break-even charts
A break-even chart is a visual representation of the break-even point
It is used to identify the following:
Fixed costs, total costs and revenue over a range of output
The break-even point, where total costs are equal to revenue
The profit or loss made at each level of output
The margin of safety
An example break-even chart
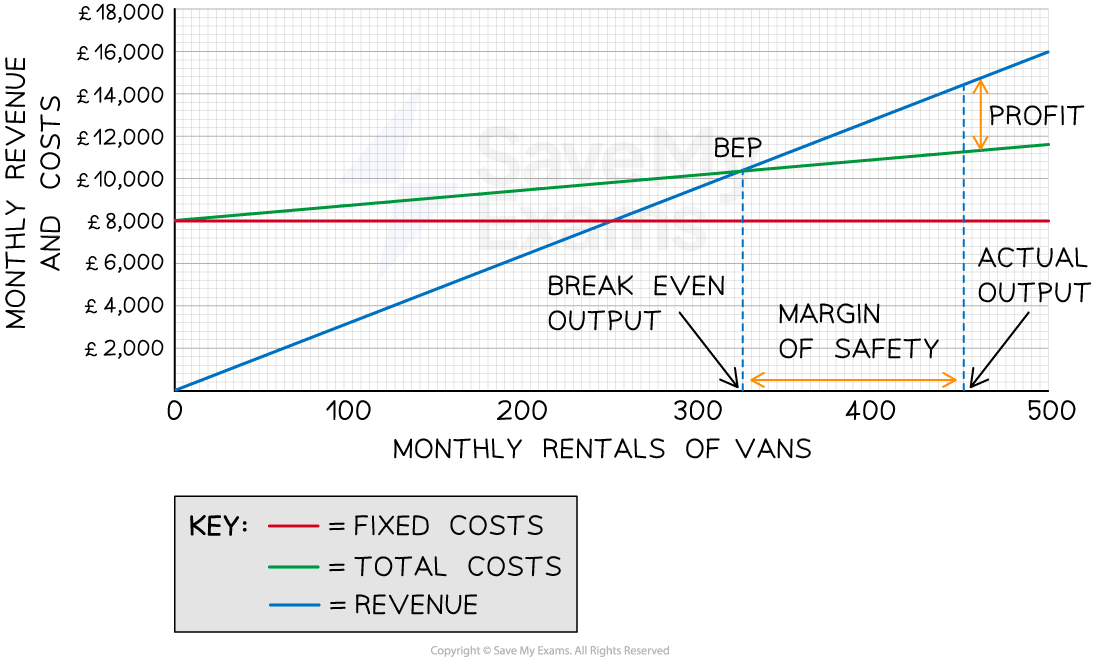
Fixed costs do not change as output increases
A2B's fixed costs are £8,000, and these do not change whether the business produces zero units or 500 units
Total costs are made up of fixed and variable costs
At zero units of output, they are made up exclusively of fixed costs
At 500 units, the total variable costs equate to £11,800
This line slopes upwards because total variable costs increase as output increases
The revenue line also slopes upwards
At zero units of output, the revenue is £0
At 500 units, the total revenue equates to £16,000
Revenue will increase with the output
The line will slope more steeply than the total costs and will cross the total costs line at some point
The point at which the total costs and the revenue lines cross is the break-even point
The break-even level of output for A2B is 324 units
The margin of safety can be identified as the difference on the x-axis between the actual level of output (in this case, 450 units) and the break-even point
The profit made at a specific level of output can be identified as the space between the revenue and total cost lines
In this instance, the profit made at 450 units of output is £14,400 − £11,250 = £3,150
Illustrating changes on the break-even chart
Changing any of the variables of break-even (selling price, variable cost per unit or total fixed costs) changes the break-even point and level of profit it can expect to achieve
Changes in variables and the break-even point
Increased selling price
An increase in the selling price reduces the break-even point

An increase in the selling price increases revenue at each level of output from R1 to R2
The break-even point falls from BEP1 to BEP2
Profit on each unit of output greater than the break-even point is increased
Decreased selling price
A decrease in the selling price increases the break-even point

A decrease in the selling price reduces revenue at each level of output from R1 to R2
The break-even point rises from BEP1 to BEP2
Profit on each unit of output greater than the break-even point is decreased
Increased variable costs
An increase in variable costs increases the break-even point

An increase in variable costs increases total costs at each level of output from TC1 to TC2
The break-even point increases from BEP1 to BEP2
Profit on each unit of output greater than the break-even point is decreased
Decreased variable costs
A decrease in variable costs decreases the break-even point

A decrease in variable costs decreases total costs at each level of output from TC1 to TC2
The break-even point falls from BEP1 to BEP2
Profit on each unit of output greater than the break-even point is increased
Increased fixed costs
An increase in fixed costs increases the break-even point

An increase in fixed costs increases total costs at each level of output from TC1 to TC2
The break-even point increases from BEP1 to BEP2
Profit on each unit of output greater than the break-even point is decreased
Decreased fixed costs
A decrease in fixed costs decreases the break-even point

A decrease in fixed costs reduces total costs at each level of output from TC1 to TC2
The break-even point falls from BEP1 to BEP2
Profit on each unit of output greater than the break-even point is increased

Unlock more, it's free!
Join the 100,000+ Students that ❤️ Save My Exams
the (exam) results speak for themselves:

Was this revision note helpful?