Operations Data: Objectives (AQA A Level Business): Revision Note
Syllabus Edition
First teaching 2026
First exams 2028
Exam code: 7132

Employee productivity
Employee productivity measures how much output each employee produces over a given time period
It is an important measure of workforce efficiency, used to compare performance over time or against competitors
Employee productivity is expressed as a number of units and is calculated using the formula
Worked Example
Croft Manufacturing produces component parts for the automotive industry. The table below shows output and staffing figures over two years.
Year 1 | Year 2 | |
|---|---|---|
Annual output (units) | 81,400 | 89,700 |
Number of employees | 40 | 35 |
Calculate the difference in employee productivity between Year 1 and Year 2.
Year 1
Year 2
Difference
Interpreting the result
A higher figure means each worker is producing more output
The workforce is therefore more efficient
A falling productivity figure over time may indicate declining motivation, skills gaps, ageing equipment or poor management
Improving productivity reduces unit costs, directly improving profitability
The same fixed costs are spread across more output
Ways to improve productivity
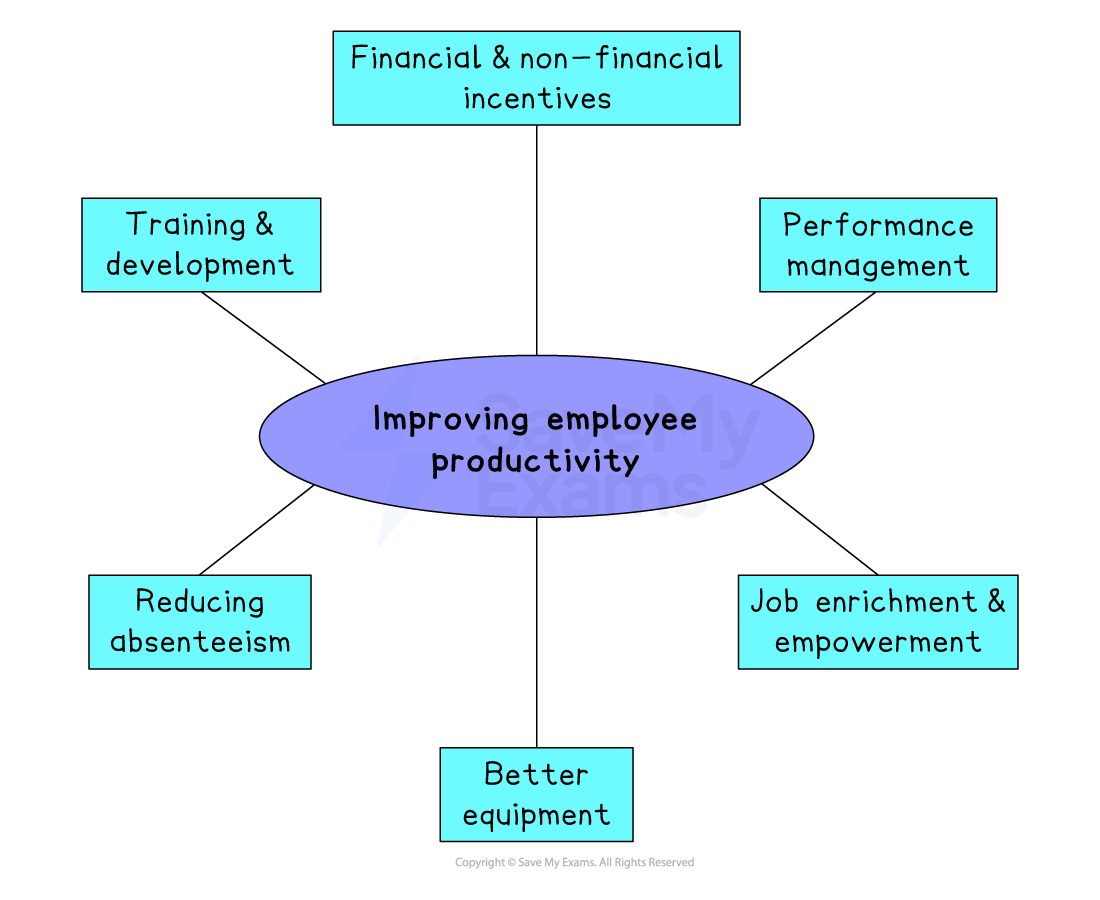
Investment in training and development
Equipping employees with better skills and knowledge enables them to work more accurately and efficiently, reducing errors and wasted time
Automation
Replacing manual tasks with machinery or technology increases the speed and consistency of production
More output is generated without an increase in staff
Better equipment
Modern, well-maintained machinery operates faster and breaks down less frequently than outdated alternatives
This reduces downtime and increases output produced per shift
Improved motivation through financial and non-financial incentives
Motivated employees work harder and take care with their work
Performance-related pay, recognition schemes and flexible working can all increase the effort employees put in
Job enrichment
Giving employees greater responsibility and variety in their roles increases engagement and ownership
This often translates into higher effort and better-quality output
Clearer goal-setting
When employees have specific, measurable targets they understand what is expected of them
This reduces time wasted on unclear priorities and focuses effort where it adds the most value
Unit costs
Unit costs, also called average costs, represent the total cost of producing one single unit of output
Lower unit costs give a business more flexibility to compete on price or improve its profit margin
Unit costs are calculated using the formula
Worked Example
A clothing manufacturer produces 5,200 jackets in June at a total cost of £244,600. In July output increases to 8,100 jackets, and total costs rise to £302,700.
Calculate the change in unit costs between June and July.
June unit costs
July unit costs
The increase in output has reduced unit costs by £9.67 per jacket, demonstrating the benefit of producing at higher volumes
Interpreting the result
Lower unit costs allow a business to either reduce its selling price (gaining competitive advantage) or maintain its price and earn a higher profit margin
Unit costs typically fall as output increases
Fixed costs are spread across more units
This is the basis of economies of scale
Rising unit costs may indicate falling output, rising input costs or declining efficiency
High unit costs relative to competitors suggest the business may be operating inefficiently or at too low a volume
Strategies to reduce unit costs
Increasing output to spread fixed costs
Fixed costs such as rent, machinery and management salaries remain the same regardless of how much is produced
By increasing output, these costs are divided across more units, reducing the cost attributed to each one
Automating production processes
Replacing labour with machinery reduces wage costs per unit and increases the speed and consistency of output, lowering the overall cost of production over time
Renegotiating supplier contracts
Securing lower prices for raw materials or components directly reduces variable costs per unit
Businesses with significant buying power or long-term supplier relationships are well placed to negotiate favourable terms
Reducing waste through lean production
Any material, time or energy that does not contribute to the finished product adds cost without adding value
Lean production techniques minimise this waste, ensuring that fewer resources are consumed for every unit produced
Resource utilisation
Resource utilisation refers to how efficiently a business uses its available resources, including labour, machinery, equipment and production space
Capacity utilisation is the most widely used measure of resource utilisation
It shows the proportion of a business's maximum possible output that is currently being produced
Capacity utilisation is expressed as a percentage and calculated using the formula
Worked Example
A car factory can produce up to 2,850 vehicles per week at full capacity. It currently produces 1,540 vehicles.
Calculate the car factory's current level of capacity utilisation.
Capacity utilisation
Only 54.04% of the factory's possible output capacity is currently being used
Interpreting the result
Utilisation % | Interpretation |
|---|---|
100 |
|
75-90 |
|
Below 50 |
|
Ways to increase capacity utilisation
Stimulating demand through marketing or price reductions
If low capacity utilisation is caused by weak demand, increasing marketing activity or temporarily reducing prices can attract more customers
This means increasing output and making better use of existing resources
Finding subcontract work to fill spare capacity
Rather than leaving machinery and staff idle, a business can take on work for other companies
Its spare capacity is used productively to generate additional revenue without increasing fixed costs
Rationalising
This involves reducing capacity to match lower demand
If low demand is likely to persist, the business may choose to permanently reduce its capacity by closing sites, selling equipment or reducing its workforce
This lowers fixed costs and raises capacity utilisation
However, it is a difficult and often costly process to reverse if demand later recovers
Measures of environmental impact and sustainability
Businesses use a range of metrics to evaluate their environmental performance
Key measures of environmental impact
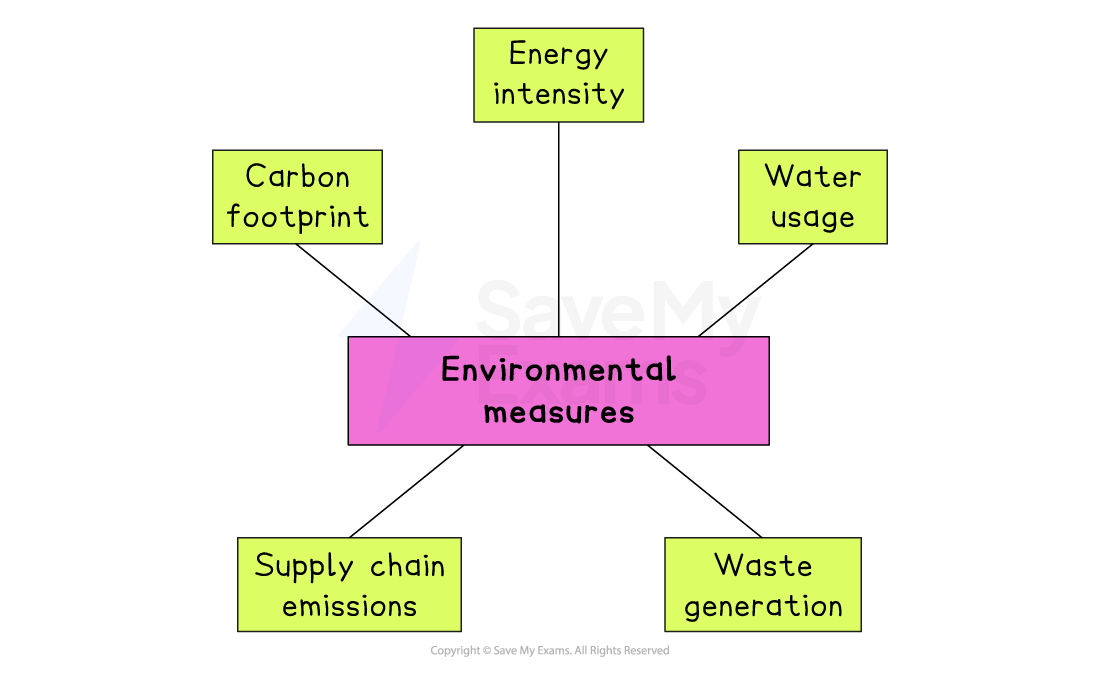
Carbon footprint
Total greenhouse gas emissions generated by a business's activities, measured in tonnes of CO₂
A falling carbon footprint over time indicates progress towards environmental targets
Energy intensity
The amount of energy consumed per unit of output
A lower figure indicates greater energy efficiency
E.g. A manufacturer that produces the same output while using less electricity has improved its energy intensity
Water usage
Total water consumption, or water used per unit of output
This is particularly significant for food and beverage manufacturers and agricultural businesses
Waste generation
The total amount of waste produced and the proportion that is recycled, reused or sent to landfill
Businesses aim to increase recycling rates and reduce their reliance on landfill
Supply chain emissions
Greenhouse gases generated not by the business itself but by its suppliers and distribution network
Increasingly monitored, as businesses are expected to account for all of their environmental impact
Interpreting environmental data
Businesses compare their figures year-on-year to track progress against their stated sustainability targets
Data can be benchmarked against industry averages or competitors to assess relative environmental performance
A rising carbon footprint or falling recycling rate may indicate that a business is moving away from its environmental commitments
This is a reputational and regulatory risk
Improving environmental performance can reduce operating costs through lower energy use and less waste
It can also satisfy consumer and investor expectations
Environmental data that is not independently verified should be treated with caution
Greenwashing - making misleading environmental claims - is an increasing concern for consumers and regulators

Unlock more, it's free!
Join the 100,000+ Students that ❤️ Save My Exams
the (exam) results speak for themselves:

Was this revision note helpful?