Network Analysis (AQA A Level Business): Revision Note
Syllabus Edition
First teaching 2026
First exams 2028
Exam code: 7132

What is network analysis?
Network analysis is a tool that supports the management of complex and time-sensitive projects
It involves the construction of a visual model of the project that includes key elements
A list of all activities required to implement the project
The time (duration) that each activity will take to complete
How each activity depends on others
Network analysis shows
The order in which activities must be completed
The longest path of project activities to the full implementation of the project
The earliest and latest that each activity can start and finish without delaying completion of the project as a whole
Activities within a project that can be carried out simultaneously are identified
The critical project activities which, if delayed, will cause the project as a whole to over-run
Those project activities where some delay is acceptable without delaying the project as a whole
The shortest time possible to complete the project
It allows managers to identify the relationships between the activities involved and to work out the most efficient way of completing the project
Resources such as raw materials and components can be ordered or hired at precisely the right time they are needed
Working capital may be managed efficiently
Where delays occur managers can identify the implications for the project's completion and redirect resources if required
Limitations of network analysis
Limitations | Explanation |
|---|---|
|
|
|
|
|
|
|
|
Network diagrams
A network diagram must always start and end on a single node
Lines must not cross and must only be assigned to activities
A simple network analysis diagram

Elements of a network diagram
Element | Description |
|---|---|
Node |
|
Activities |
|
Duration |
|
Calculating earliest start times (EST)
Working forward from Node 1, the Earliest Start Time for each activity is calculated by adding the duration of each task

The EST for each activity is placed in the top right of each node
Node 1 is the starting point of the project and where both Activity A and Activity B begin
Activity A and Activity B are independent processes
Activity A has a duration of 2 days and its earliest start time (EST) is 0 days
Activity B has a duration of 3 days and its EST is also 0 days
Activity C and Activity D both begin at Node 2 and are dependent upon the completion of Activity A but are independent from each other
Activity C has a duration of 3 days and its EST is 2 days
Activity D has a duration of 5 days and its EST is also 2 days
Activity E begins at Node 3
Activity E has a duration of 4 days and its EST is 3 days
Activity F begins at Node 4
Activity F has a duration of 2 days and its EST is 5 days
Activity G begins at Node 5
Activity G has a duration of 1 day and its EST is 7 days
Activity H begins at Node 6
Activity H has a duration of 3 days and its EST is 7 days
Node 7 is the end point of the project
Calculating latest finish times (LFT)
Working backwards from Node 7, it is now possible to calculate the Latest Finish Time (LFT) for each activity by subtracting the duration of each task
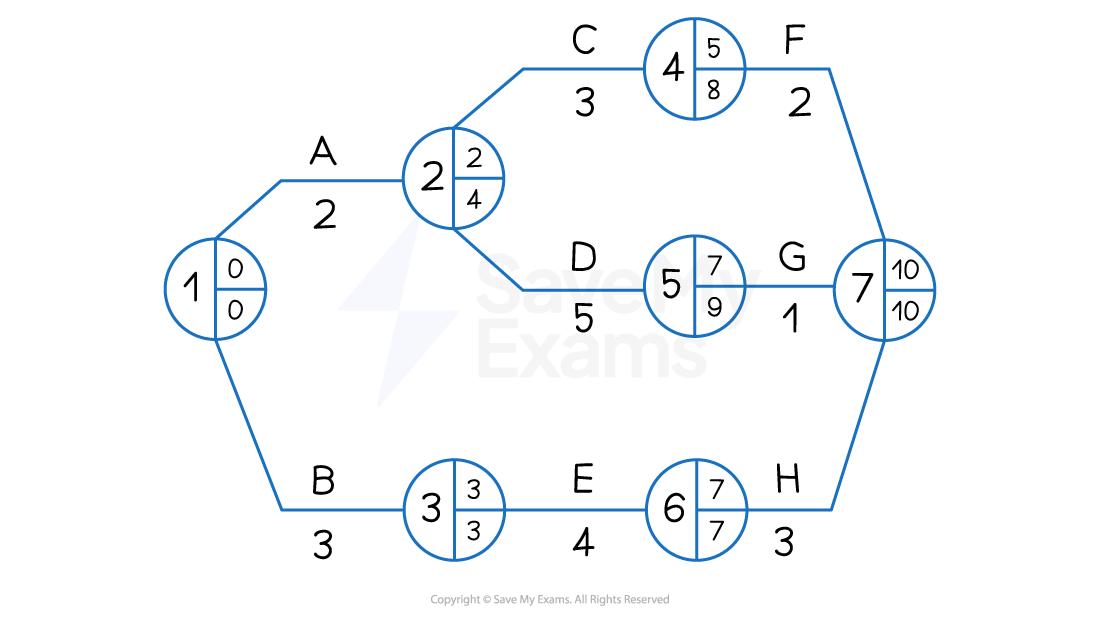
The LFT for each activity is placed in the bottom right of each node
Node 7 is the end point of the project, which has a latest finish time of 10 days
Activity H has a duration of 3 days
The LFT in Node 6 is 7 days (10 days - 3 days)
Activity G has a duration of 1 day
The LFT in Node 5 is 9 days (10 days - 1 day)
Activity F has a duration of 2 days
The LFT in Node 4 is 8 days (10 days - 2 days)
Activity E has a duration of 4 days
The LFT in Node 3 is 3 days (7 days - 4 days)
Activity D has a duration of 5 days
The LFT in Node 2 is 4 days (9 days - 5 days)
Activity C has a duration of 3 days
The LFT in Node 3 is 4 days because Activity D is the more time-critical of the two activities that are dependent upon the completion of Activity A and so its LFT is recorded
Activity B has a duration of 3 days
The LFT in Node 1 is 0 days (3 days - 3 days)
Activity A has a duration of 2 days
The LFT in Node 1 is 0 days because Activity B is the more time-critical of the two starting activities and so its LFT is recorded
The LFT in Node 1 is always 0
Float times and the critical path
Identifying the critical path
The critical path highlights those activities that determine the length of the whole project
If any of these critical activities are delayed, the project as a whole will be delayed
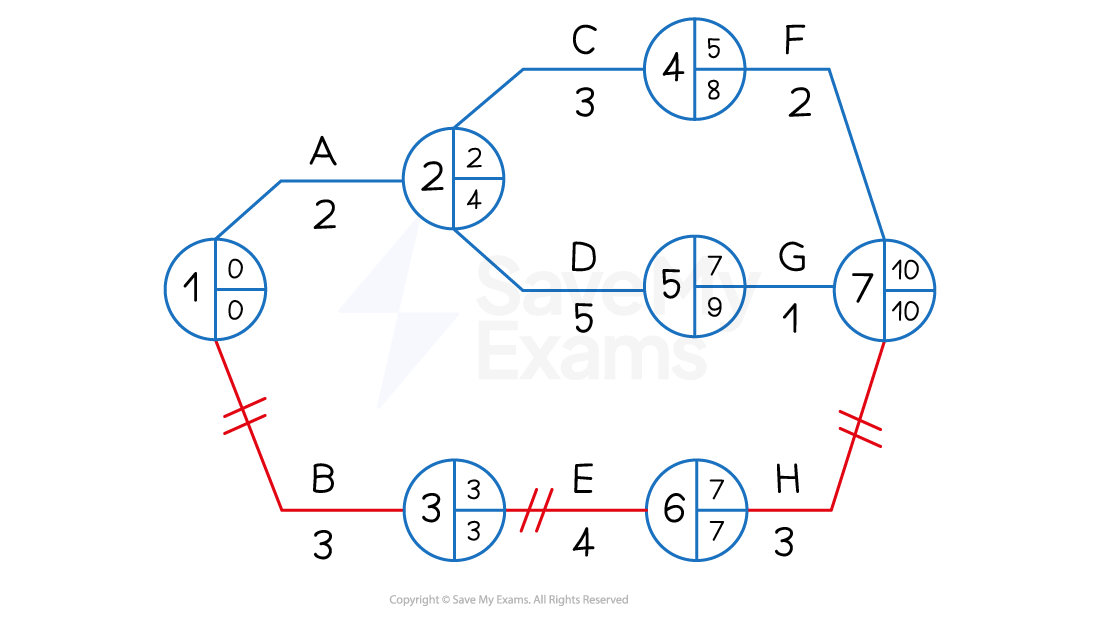
The critical path follows the nodes where the EST and LFT are equal
In the diagram below nodes 1 3 6 and 7 have equal ESTs and LFTs
Activities that determine these nodes are B E and H
These activities are marked with two short lines
The critical path is therefore BEH
Identifying and calculating float time
Float time exists where there is a difference between the Earliest Start Time (EST and the Latest Finish Time (LFT)
Where float time is identified, managers may
Transfer resources such as staff or machinery to more critical activities
Allow extra time to complete tasks to improve quality or allow for creativity
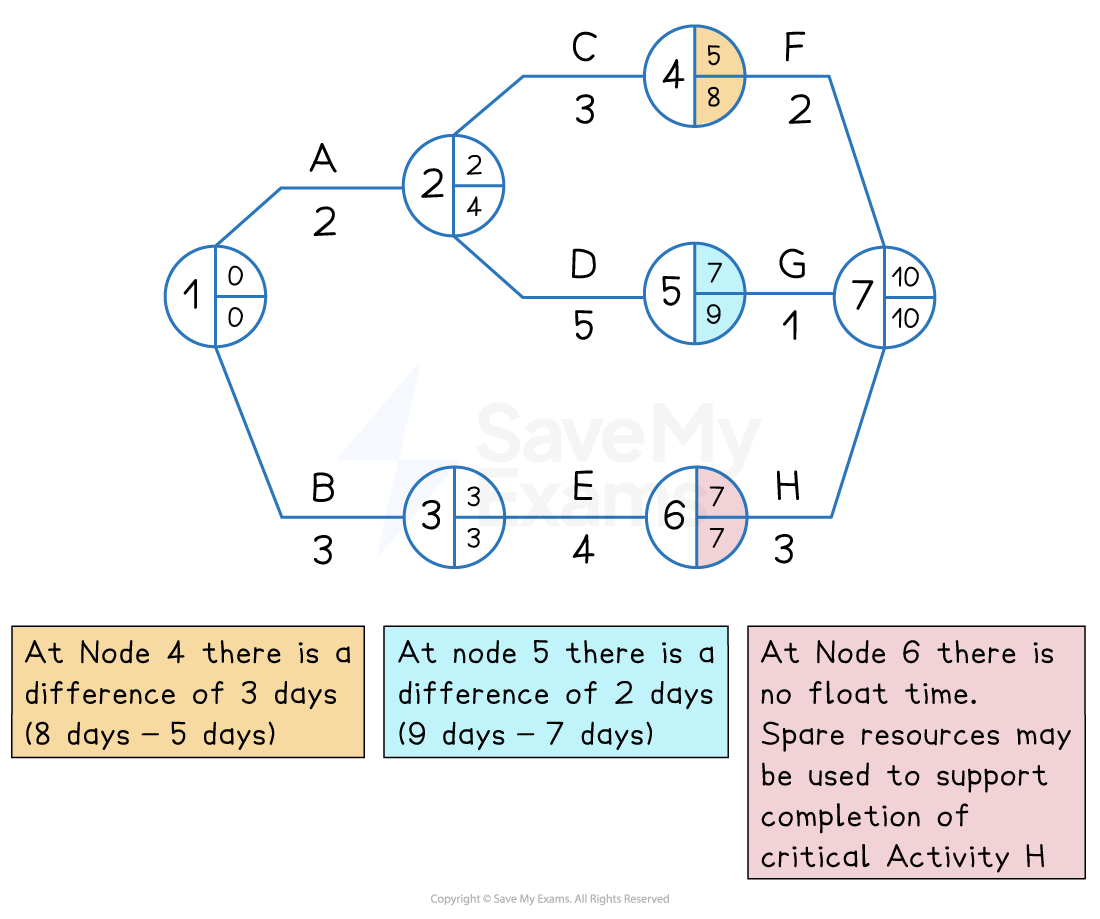
Float time analysis
The total float refers specifically to spare time that is available so that the overall project completion is not delayed
The total float for a specific activity is calculated by
Using the diagram above, the following total float times can be calculated for Activities A to H:
Activity | LFT | - Duration | - EST | = Total Float |
|---|---|---|---|---|
A | 4 | 2 | 0 | 2 |
B | 3 | 3 | 0 | 0 |
C | 8 | 3 | 2 | 3 |
D | 9 | 5 | 2 | 2 |
E | 7 | 4 | 3 | 0 |
F | 10 | 2 | 5 | 3 |
G | 10 | 1 | 7 | 2 |
H | 10 | 3 | 7 | 0 |
The critical activities B E and H each have a total float of 0 days
Worked Example
The network diagram below shows the activities involved in a new promotional campaign for a small fashion accessories business as well as the time (in weeks) it is expected that each activity will take to complete.
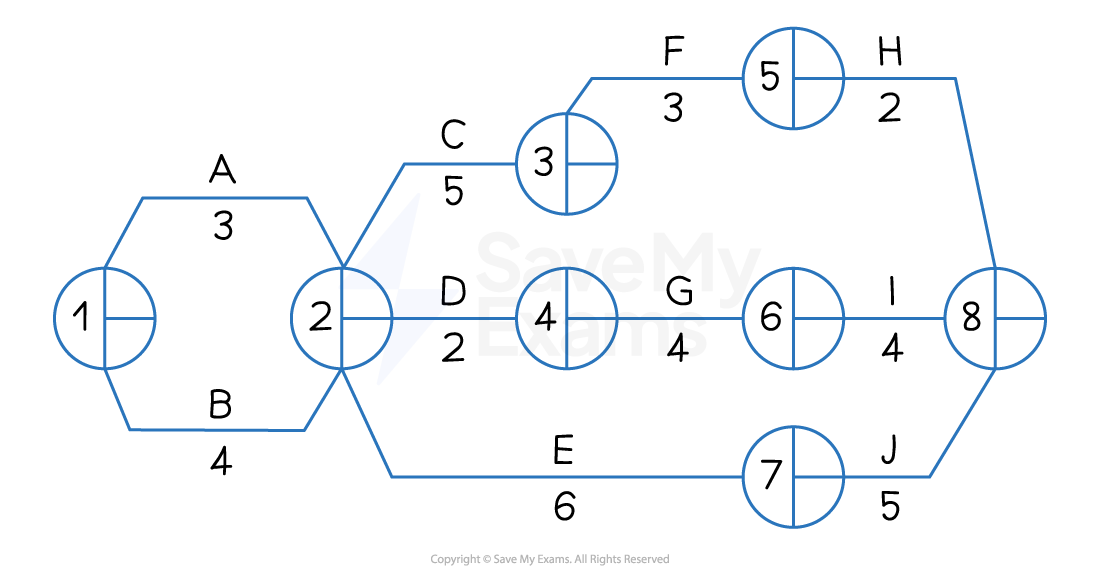
Calculate
a) The earliest start times and latest finish times for each node.
b) The total float time for activity G
Earliest Start Times (EST)
Node 1 EST = 0
Node 2 EST = 0 + 3 = 3 but 0 + 4 = 4 so 4
Node 3 EST = 4 + 5 = 9
Node 4 EST = 4 + 2 = 6
Node 5 EST = 9 + 3 = 12
Node 6 EST = 6 + 4 = 10
Node 7 EST = 4 + 6 = 10
Node 8 EST = 12 + 2 = 14 but 10 + 4 = 14 and 10 + 5 = 15 so 15
Latest Finish Times (LFT)
Node 8 = 15
Node 7 = 15 - 5 = 10
Node 6 = 15 - 4 = 11
Node 5 =15 - 2 = 13
Node 4 =11 - 4 = 7
Node 3 =13 - 3 = 10
Node 2 = 10 - 6 = 4
Node 1 = 4 - 4 = 0
Total float time for Activity G
If the length of time taken to complete an activity changes, there may be an effect on the critical path and available float
In the strategy shown in the network diagram above, the duration of activity G is increased from 1 to 4 days
The EST at node 7 will increase to 11 days and the LFT to 11 days
The EST at node 5 will remains at 11 days, while the LFT will change to 7 days
The EST at node 5 will remains at 2 days, while the LFT will change to 2 days
As a result, the critical path will switch from BEH to ADG

Examiner Tips and Tricks
Always double-check your EST (earliest start time) and LST (latest start time) calculations before identifying the critical path, as a single arithmetic slip early in the network will throw off every activity that follows it

Unlock more, it's free!
Join the 100,000+ Students that ❤️ Save My Exams
the (exam) results speak for themselves:

Was this revision note helpful?