Assessing Business Performance: Human Resources and Operations Data (AQA A Level Business): Revision Note
Syllabus Edition
First teaching 2026
First exams 2028
Exam code: 7132

Human resources data
A range of human resources data can be used to assess how well a business is performing
These data can be analysed over time to determine whether performance is improving or worsening
They may also be compared with the performance of similar firms
Common measures of human resources performance
Measure | Calculation | Explanation |
|---|---|---|
Labour turnover |
| |
Labour retention |
| |
Absenteeism |
| |
Labour cost per unit |
| |
Average wage |
| |
Accident rate |
| |
Sales per employees |
| |
Employee costs as a % of revenue |
|
Case Study
Horizon Care Services Ltd
Business overview
Horizon Care Services is a regional provider of residential care homes in the Midlands. The company employs over 600 staff across 12 locations and prides itself on delivering high-quality, compassionate care to elderly residents

Identifying HR Performance Issues
By late 2025, Horizon’s senior management became concerned about rising recruitment costs and declining staff morale. They reviewed key human resource performance data to investigate:
Metric | 2024 average | 2025 average | Change |
|---|---|---|---|
Labour turnover | 18% | 31% | ▲ 13 percentage pts |
Absenteeism rate | 2.3% | 4.1% | ▲ Nearly doubled |
Labour cost per unit | £145 | £172 | ▲ +18.6% |
Average wage | £22,000 | £23,500 | ▲ +6.8% |
Analysis
The sharp rise in labour turnover revealed that more staff were leaving the company
This increased the burden of recruitment and reduced team stability
The increase in absenteeism pointed to potential employee dissatisfaction, burnout, or illness, particularly among frontline care workers
Labour cost per unit rose significantly
This was partly due to more frequent use of agency staff to fill gaps left by absent or departed employees
Although wages had increased, staff surveys showed that employees felt under-supported and overworked
This suggested that pay increases alone weren’t enough to retain staff
Business response
Horizon launched an employee wellbeing programme, including counselling access, stress management workshops, and regular one-to-one check-ins with managers
It introduced a loyalty-based retention bonus scheme for employees with more than two years of service
A new induction and mentorship system was rolled out to better support new hires and reduce early-stage employee turnover
Outcomes within 4 months
Labour turnover dropped to 22%
Absenteeism fell back to 2.7%
Labour cost per unit stabilised at £158
Exit interviews showed improved staff sentiment and clearer communication with management
Operations data
A range of operations data can be used to assess how well a business is performing
Data can be analysed over time to determine whether performance is improving or worsening
They may also be compared with the performance of similar firms
Productivity data
Productivity measures how well a business uses its resources to produce output
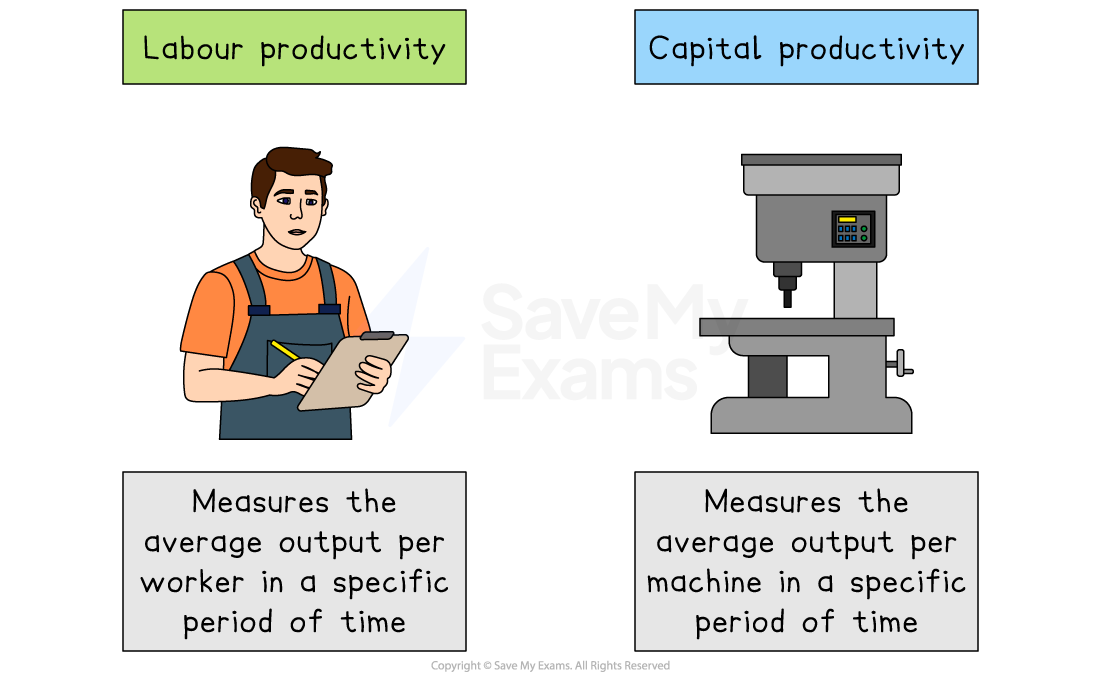
Higher levels of productivity are likely to lead to lower unit costs as fixed costs are spread across more units of output
This can allow a business to lower selling prices to achieve an important competitive advantage over rivals, especially those with lower levels of output
Comparing labour productivity can reveal a range of issues
When each employee delivers more output, profit should rise without the need to recruit more staff
Rising labour productivity also suggests training, motivation techniques or new technology is working, encouraging a business to make further such investments
Similarly, comparing capital productivity can provide some useful insights
High capital productivity shows the firm is getting strong returns from its investments, so it needs less new spending to grow
Investors look at output per £1 of capital employed to judge whether the company is making good use of its funds
Measuring capital productivity helps managers decide whether to upgrade, sell off underused assets or invest in new technology
Labour productivity and capital productivity calculations are covered in depth here
Quality data
The defect rate
The proportion of output that is judged to be substandard in a given time period
It is expressed as a percentage and calculated using the formula
Worked Example
HomeFlex manufactures high-strength universal charging cables for mobile phones. In 2022 it manufactured and tested 14,220 cables of which 213 were found to be defective
Calculate Homeflex's defect rate in 2022.
[2]
Step 1: Divide the number of defects by the total output
(1)
Step 2: Multiply the outcome by 100 and express as a percentage
(1)
The returns rate
The proportion of output that is returned by customers in a given time period
It is expressed as a percentage and calculated using the formula
Businesses take steps to reduce the defect rate and returns rate for several reasons
Avoid loss of revenue as faulty products or those that have been returned can rarely be sold
Customers will likely complain about substandard products which causes dissatisfaction and impacts business reputation
Unsafe products may harm customers and could lead to legal issues
Returned products require refunds, processing and disposal
The wastage rate
The proportion of materials and components wasted in production in a given time period
It is expressed as a percentage and calculated using the formula
Businesses take steps to reduce the wastage rate for several reasons
Lower production costs
By reducing waste, a business uses fewer raw materials overall, which brings down the cost of making each unit
Higher profit margins
Every tonne of material saved reduces variable costs, increasing the profit earned on each sale
Improved sustainability and reputation
Cutting scrap reduces costs of disposal and the business's environmental impact and shows customers the business is committed to being green
Customer satisfaction
A business may carry out surveys, focus groups or interview customers to determine how happy they are with their purchase
Increasingly, businesses use data collected by research organisations such as Trustpilot to determine levels of customer satisfaction
Customer loyalty
Customer loyalty may be measured by reviewing the volume of repeat sales
Loyalty schemes, such as Tesco's Clubcard, have made gathering and analysing this information much more straightforward
Examples of industry measures of quality
Industry | Quality measure | Explanation |
|---|---|---|
Hotels |
|
|
Train operators |
|
|
Hospitals |
|
|
Restaurants |
|
|
Capacity utilisation data
Capacity utilisation measures how effectively a business uses its assets to produce output
It compares current output to the maximum possible output a business can produce using all of its assets
High capacity utilisation is important for several reasons
Cost efficiency and profitability
Using more of a factory’s or machine’s capacity spreads fixed costs, such as rent and salaries, over more units of output, lowering the unit cost and increasing profit margins
Resource management
High capacity utilisation shows a business is making full use of its non-current assets, such as machines, buildings and labour, so it isn’t wasting money on idle capacity
Investment planning
Monitoring capacity utilisation helps managers decide when to invest or scale back capital expenditure
Cash‐flow forecasting
More output generally means more sales and cash coming in
A sudden drop in capacity utilisation can signal that there is likely to be an imminent shortage of cash
Quality and maintenance balance
While high utilisation is good, pushing equipment too hard can increase breakdowns and defects
The right rate of capacity utilisation balances the level of output with reliable, high‐quality production
Calculation of capacity utilisation is covered in depth here
Evaluating the use of operations data to analyse business performance
Advantages | Limitations |
|---|---|
|
|
|
|
|
|

Unlock more, it's free!
Join the 100,000+ Students that ❤️ Save My Exams
the (exam) results speak for themselves:

Was this revision note helpful?