Human Resource Data (AQA A Level Business): Revision Note
Syllabus Edition
First teaching 2026
First exams 2028
Exam code: 7132

Why measure human resource performance?
Businesses collect and analyse HR data to make informed decisions that help improve performance, reduce costs and plan for future workforce needs
Why HR data matters
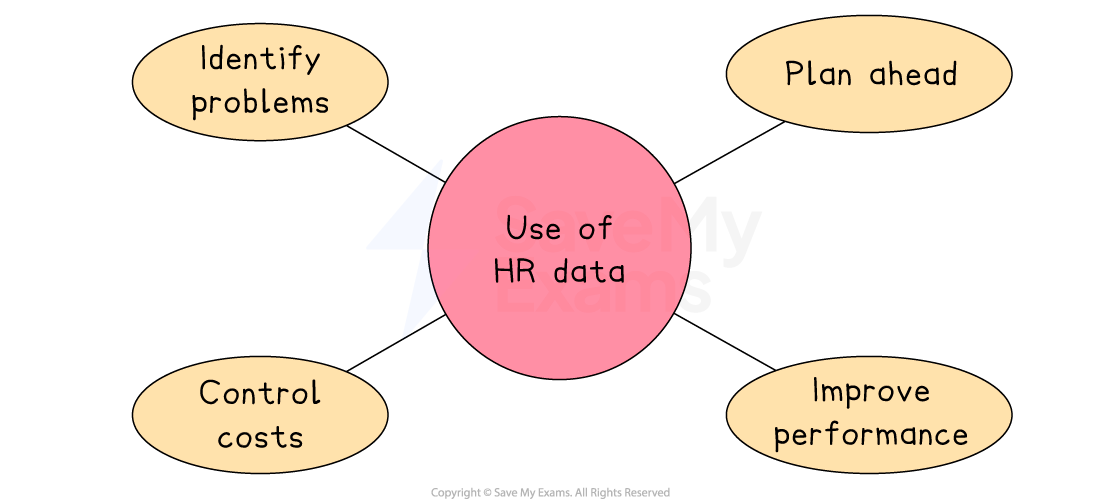
Identify problems
High labour turnover or rising costs may indicate poor working conditions, low morale or training gaps
Plan ahead
Workforce data informs recruitment, training, succession planning and budgeting
Improve performance
Tracking productivity or absenteeism helps managers take action to boost efficiency
Control costs
Monitoring labour cost per unit and employee costs as a percentage of revenue helps businesses stay competitive
Employee engagement
Employee engagement measures the extent to which employees feel motivated, committed to and emotionally invested in their work and the organisation
High engagement is linked to higher productivity, lower absenteeism and reduced staff turnover
It is commonly measured through employee surveys and exit interviews
Measuring engagement allows managers to identify problem areas, such as poor leadership or lack of development opportunities, before they lead to a loss of valuable employees
Tracking engagement over time shows whether HR initiatives are having the intended effect on workforce morale and motivation
Employee representation
Employee representation measures the degree to which different groups of employees have a voice in workplace decisions
Through trade unions, works councils, employee forums or elected representatives
Measuring representation helps the business assess whether all employees have fair access to support, particularly during disputes, redundancies or changes to terms and conditions
Strong employee representation is linked to better communication between management and staff, which can reduce conflict and improve trust
Monitoring representation also helps identify whether certain groups – such as junior staff or those on flexible contracts – are under-represented in decision-making processes
Employee diversity
Employee diversity measures the composition of the workforce
It considers characteristics such as gender, ethnicity, age, disability and socioeconomic background
Monitoring diversity data allows the business to assess whether its workforce reflects the communities it serves and the wider population
Measuring diversity highlights gaps such as under-representation of certain groups at senior levels
This may indicate barriers to progression or bias in recruitment and promotion processes
A diverse workforce is associated with greater innovation, better decision-making and improved performance
Increasingly, investors, customers and regulators expect businesses to report transparently on diversity
Employee well-being
Employee well-being measures the physical, mental and emotional health of the workforce
It is commonly monitored through absenteeism rates, staff surveys, occupational health referrals and access to well-being support services
Poor well-being is costly
It leads to absenteeism, presenteeism (being at work but not fully productive), and, ultimately, high staff turnover
Measuring well-being allows the business to identify stresses, such as excessive workload, poor management or an unsupportive culture, and address them before they escalate
Businesses with strong well-being programmes tend to report higher engagement, lower sickness absence and better staff retention
Key performance indicators (KPIs)
Key performance indicators (KPIs) are measurable targets set for individual employees or teams, used to assess whether performance meets the standards the business requires
Common examples include sales targets, customer satisfaction scores, output per hour, error rates and project completion times
KPIs give employees a clear understanding of what is expected of them, which supports motivation and focus
Measuring performance against KPIs allows managers to identify high performers for recognition and development, and to support those who are not meeting expectations
KPIs must be realistic, clearly defined and regularly reviewed to remain meaningful
Poorly designed KPIs can drive the wrong behaviours or demoralise staff if targets are unachievable
Measuring performance data
Employee productivity
Employee productivity measures output per worker during a specified period of time
It is expressed as a number of units and calculated using the formula:
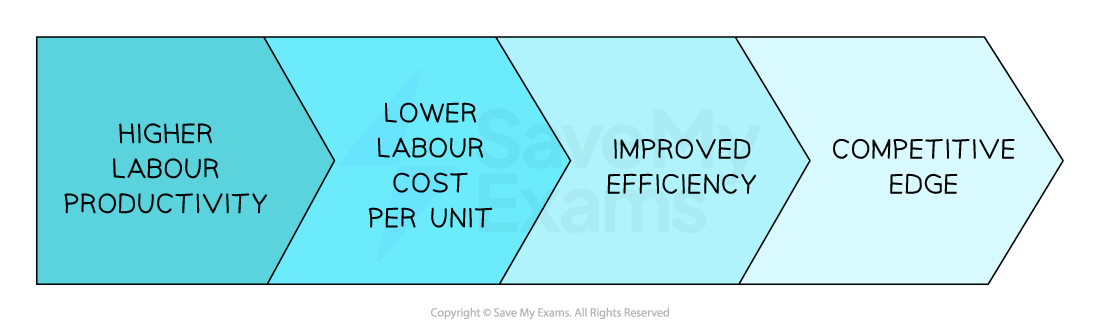
Businesses aim to increase the level of labour productivity to improve competitiveness
Falling productivity could trigger a review of equipment, working conditions or staff training needs
For example, Royal Mail invested in automated parcel sorting and upskilled employees in response to falling productivity during peak online shopping seasons
The link between high labour productivity and competitive edge
Worked Example
The table shows the number of pairs of luxury wool socks produced by Sock Mania in 2023 and 2024.
Year | Units produced |
|---|---|
2024 | 46,000 |
2025 | 69,000 |
In 2024, Sock Mania employed 50 staff. In 2025, the number of staff employed by the business increased by 20%.
Calculate the percentage change in employee productivity between 2024 and 2025.
Employee productivity for 2024
Employee productivity for 2025
Percentage difference between the two years
Employee productivity has increased by 25%
Employee cost per unit
Employee cost per unit measures how much it costs in wages to produce one unit of output
It is a key piece of data to assist with pricing and cost control decisions
Rising labour costs may push a business to automate processes or reallocate staff more efficiently
For example, Greggs introduced more self-serve tills and centralised some baking operations to reduce labour costs per unit across stores
It is calculated using the formula:
Worked Example
Westfield Furniture manufactures dining chairs. The table below shows the business's total annual wage bill and output over four years.
Year | Total annual wages | Total output (units) | Labour cost per unit (£) | Index (Year 1 = 100) |
|---|---|---|---|---|
1 | 400,000 | 20,000 | 20.00 | 100 |
2 | 440,000 | 20,000 | ||
3 | 450,000 | 25,000 | ||
4 | 480,000 | 20,000 |
Calculate the employee cost per unit and index number for Years 2, 3 and 4, using Year 1 as the base year.
Answer
Employee cost per unit
Year 2
Year 3
Year 4
Index number
Year 2
Year 3
Year 4
Year | Total annual wages | Total output (units) | Employee cost per unit (£) | Index (Year 1 = 100) |
|---|---|---|---|---|
1 | 400,000 | 20,000 | 20.00 | 100 |
2 | 440,000 | 20,000 | 22.00 | 110 |
3 | 450,000 | 25,000 | 18.00 | 90 |
4 | 480,000 | 20,000 | 24.00 | 120 |
Sales per employee
Sales per employee measures the average amount of revenue generated by each member of staff over a given period
It shows how efficiently the business is converting its labour resource into revenue
Sales per employee is calculated using the formula
A rising figure suggests the workforce is becoming more productive
A falling figure may indicate overstaffing, declining sales or poor employee performance
It is particularly useful for comparing performance across different time periods, branches or against competitors in the same sector
Worked Example
Oakwood Garden Centres had total sales revenue of £480,000 and 20 employees in Year 1.
By Year 2, revenue had grown to £750,000 and the business employed 25 staff.
Calculate the sales per employee for each year and the percentage change between them.
Answer
Sales per employee
Year 1
Year 2
Percentage change
Employee turnover
Employee turnover measures the proportion of employees leaving a business during a specific time period
It is expressed as a percentage and is calculated using the formula:
High staff turnover might lead a business to invest in better training, improve management or raise pay to improve retention
For example, in 2022, NHS England faced high nurse turnover
It responded with improved retention schemes, including flexible working, leadership development and mentorship programmes
Internal and external factors that affect employee turnover
A rising rate of employee turnover can signal internal HR management problems such as
Poor management leading to workers losing commitment
A poor recruitment and selection approach leading to staff leaving soon after starting their job
Low wage levels compared to those that could be earned elsewhere
External factors can also increase employee turnover in a business
A buoyant local economy where workers are attracted to employment opportunities elsewhere
Improved transport links that provide an opportunity for workers to seek work across a wider geographical area
The consequences of high employee turnover
Problems | Opportunities |
|---|---|
|
|
Worked Example
In 2022, Domus Construction Ltd employed 7,200 workers, six per cent of whom worked at the head office.
During 2022, fifty-four head office employees left the business.
Calculate the employee turnover of Domus Construction's head office in 2022.
Answer
Head office workers
Employee turnover
Employee costs
Employee costs as a proportion of revenue shows how much of a business’s revenue is spent on paying employees
It helps assess how efficiently the workforce is being used
If employee costs are growing faster than revenue, the business may need to restructure or freeze recruitment
For example, Marks & Spencer faced rising wage costs and declining revenues in some departments. It responded by closing underperforming stores and streamlining staff roles
It is calculated using the formula:
Worked Example
In the 2024–2025 financial year, Tangent Plc had:
Revenue = £5,297 million
Employee costs = £2,894 million
Calculate Tangent Plc's employee costs as a percentage of revenue between 2024 and 2025.
Answer
Employee costs as a percentage of turnover
54.6% of revenue was spent on paying staff
Influences on employee costs as a percentage of revenue
Wage levels and contracts
High wages, overtime pay or generous bonuses will raise employee costs
Productivity
More productive staff reduce the cost per unit and lower the ratio
Technology
Automation can reduce the need for labour, cutting costs
Industry type
Labour-intensive industries such as hospitality usually have higher employee costs than capital-intensive ones such as manufacturing
Revenue performance
A fall in revenue (e.g. due to low demand) makes employee costs look higher, even if wages have not changed
Examiner Tips and Tricks
Start with the formula: (Employee costs ÷ Revenue) × 100
Writing the method first earns own‑figure marks even if your calculation has errors

Unlock more, it's free!
Join the 100,000+ Students that ❤️ Save My Exams
the (exam) results speak for themselves:

Was this revision note helpful?