Matching Output to Demand (AQA A Level Business): Exam Questions

Exam code: 7132

Syllabus Edition

First teaching 2026

First exams 2028

2 hours15 questions
1
6 marks

Source B: Ocado Retail

Ocado Retail is the United Kingdom's only large supermarket that sells groceries online and has no shops at all. It is a joint venture owned half by Ocado Group and half by Marks and Spencer.

Instead of shops it runs seven customer fulfilment centres. These are huge automated warehouses in which thousands of robots travel across a grid above crates of groceries, lifting out the items each customer has ordered and passing them to packers. The centre at Erith has more than 3 500 robots and about 750 000 storage locations. A fleet of branded vans then delivers from these centres, and from smaller regional sites called spokes, to more than 80% of UK households.

The automation gives Ocado Retail very tight control of its inventory. It wastes 0.038% of the food it handles, which is roughly one product in every 2 600.

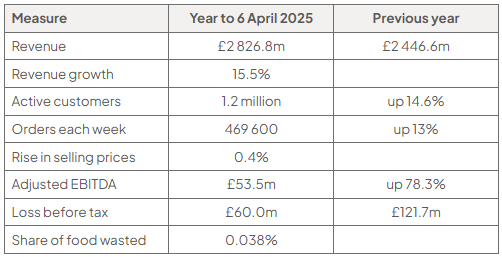
Trading has been strong. In the year to 6 April 2025 revenue rose 15.5% to £2 826.8 million, from £2 446.6 million. Active customers rose 14.6% to 1.2 million and orders rose 13% to 469 600 a week, while the average basket held steady and selling prices rose only 0.4%, well below inflation.

The business is also using its warehouses much harder than it was. Capacity utilisation across the fulfilment centres rose from 75% at the end of the 2023 financial year to as much as 94% by February 2025. Profitability improved with it: adjusted earnings before interest, tax, depreciation and amortisation rose 78.3% to £53.5 million, and the loss before tax narrowed from £121.7 million to £60.0 million.

Demand is not spread evenly. Orders peak sharply on Friday and Saturday, and again in the week before Christmas, and every order has to be picked, packed and delivered within a slot the customer has chosen.

Source: Ocado Retail and Ocado Group annual reports and trading statements, 2024 to 2026

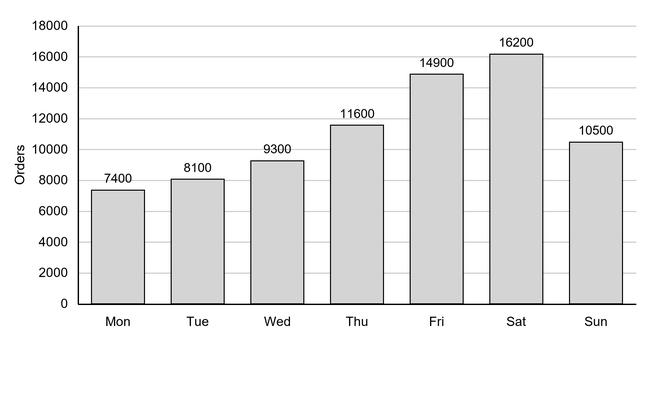
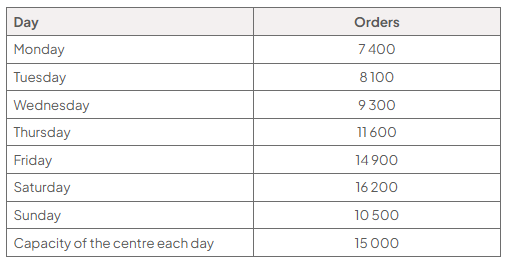
Appendix G: Orders in a typical week at one Ocado Retail fulfilment centre

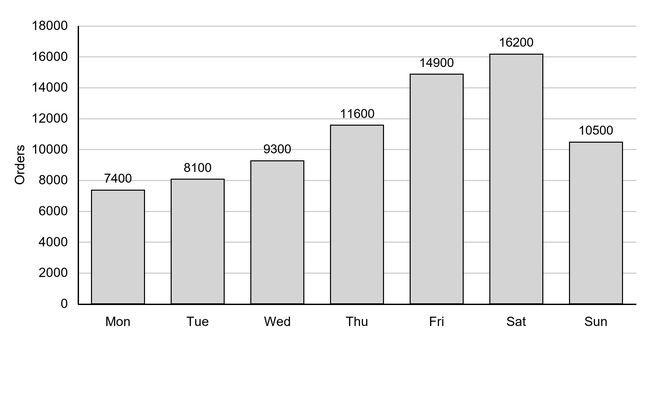
Bar chart of daily orders at one fulfilment centre: orders rise from 7,400 on Monday to 16,200 on Saturday, then fall to 10,500 on Sunday. The vertical axis ranges from 0 to 18,000 orders in 2,000-order intervals.
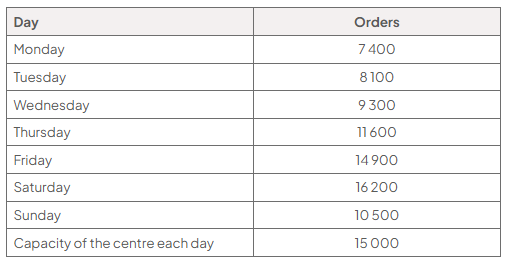
Table of orders at one Ocado Retail fulfilment centre: Monday 7,400; Tuesday 8,100; Wednesday 9,300; Thursday 11,600; Friday 14,900; Saturday 16,200; Sunday 10,500. Daily capacity is 15,000 orders.

Source: Analyst

Analyse one way in which the sharp rise in orders on a Friday and Saturday might affect Ocado Retail's costs.

2
6 marks

Source B: Thaxted Seed Co Ltd

Thaxted Seed Co Ltd supplies vegetable and flower seed to garden centres and smallholdings across eastern England. It employs 28 people at a single site in Essex, and in the year to September 2025 it had revenue of £4.2 million and an operating profit of £310 000.

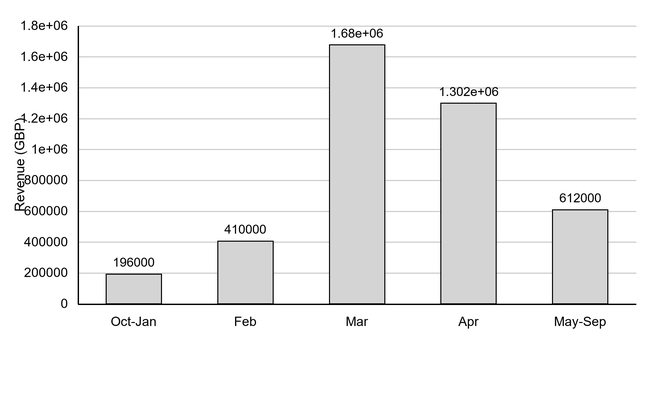
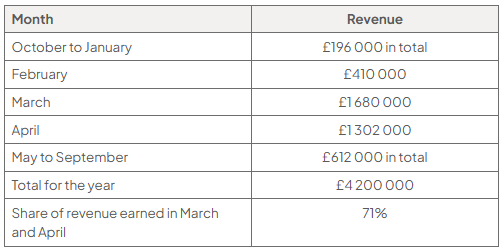
Almost everything it sells, it sells in eight weeks. Gardeners buy seed in March and April, and garden centres want their shelves full by the last week of February. Between May and January the warehouse is quiet. In the year to September 2025, 71% of the company's revenue came in March and April alone.

Seed cannot simply be made to order. It has to be grown, harvested, dried, tested for germination and packeted, and that work happens on a different timetable from the selling. Thaxted therefore buys and packets its seed through the autumn and holds it until spring. Seed also loses the ability to germinate as it ages, so anything unsold at the end of a season is worth far less the following year and is usually written off.

The company buys 62% of its seed from one Dutch grower, Verhoeven BV, which it has used since 1994. Verhoeven offers lower prices than anyone else and has never missed a delivery, but in August 2025 a wet harvest cut the quantity it could supply by a fifth, and Thaxted had to buy the shortfall elsewhere at short notice and at a higher price. The managing director, Tom Prideaux, has started asking whether depending on one supplier for most of what the company sells is wise.

Source: Thaxted Seed Co Ltd

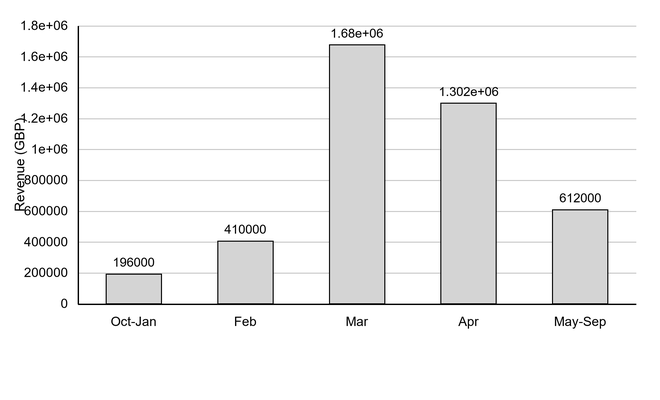
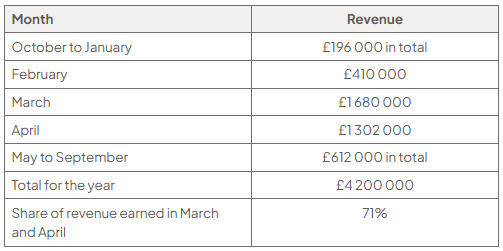
Appendix E: Thaxted Seed Co Ltd revenue by period

Bar chart of Thaxted Seed Co Ltd’s monthly revenue, showing a peak in March and April: Oct to Jan £196 000, Feb £410 000, Mar £1.68m, Apr £1.302m, and May to Sep £612 000.
Table of Thaxted Seed Co Ltd revenue: October to January £196 000, February £410 000, March £1.68 million, April £1.302 million, and May to September £612 000; annual total £4.2 million, with 71% in March and April.

Source: Thaxted Seed Co Ltd

Analyse one way in which earning 71% of its revenue in two months might affect Thaxted Seed Co Ltd's ability to plan its production.

3
6 marks

Source B: Screwfix

Screwfix sells tools, fixings, plumbing and electrical supplies to tradespeople. It is owned by Kingfisher, which also owns B&Q. Its branches are not really shops: most of the inventory sits in a warehouse behind a counter, and customers order on a phone or a screen and collect in minutes.

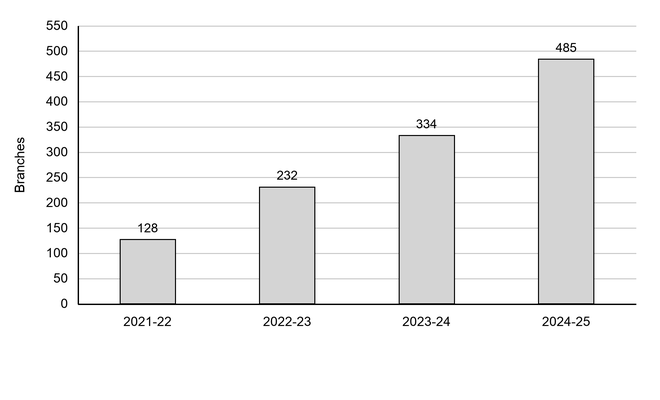
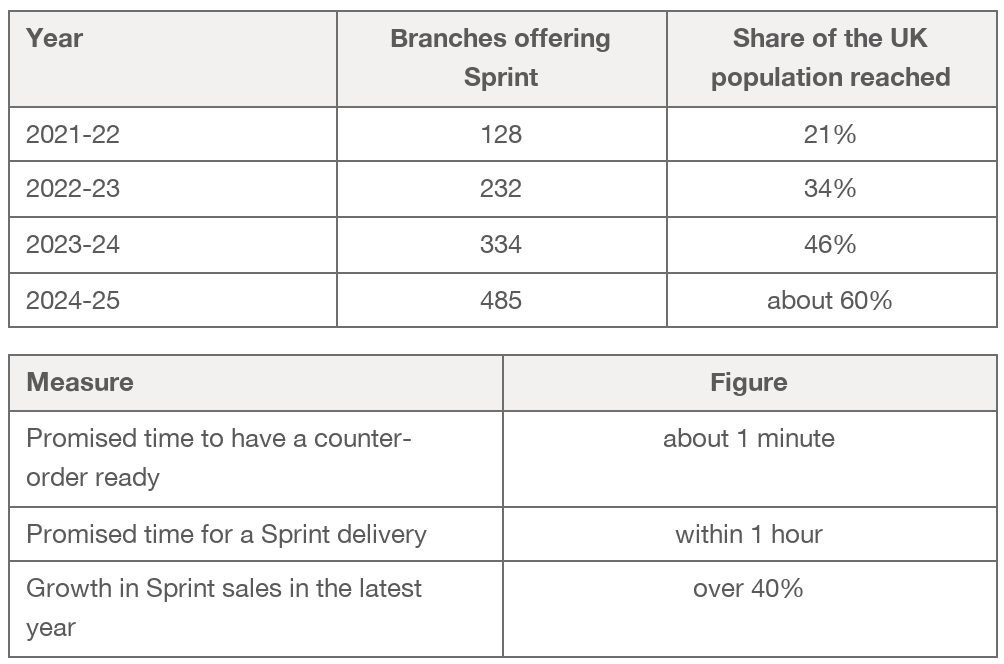
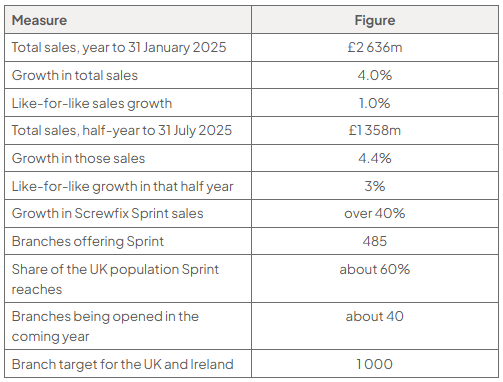
That speed is the product. A plumber halfway through a job cannot wait until tomorrow. Screwfix promises that what is ordered will be ready to collect in about a minute, and its Screwfix Sprint service delivers to a customer's door within an hour. Sprint sales grew by more than 40% in the year, and the service was extended to 151 more branches, so it now runs from 485 branches covering roughly 60% of the United Kingdom's population.

Trading has been solid in a difficult market for home improvement. Total sales rose 4.0% to £2 636 million in the year to 31 January 2025, with like-for-like sales up 1.0%. In the first half of 2025/26 sales rose 4.4% to £1 358 million, with like-for-like up 3%. The business is opening about 40 more branches and is working towards 1 000 across the United Kingdom and Ireland.

All of this depends on something invisible to the customer: having the right item within a few minutes of them. A branch is small, so it cannot hold everything, and what it does not hold has to come from a distribution centre fast enough to matter. Where those distribution centres sit, and how much inventory they hold, is the decision the business keeps returning to.

Source: Kingfisher plc results for the year to 31 January 2025 and the half year to 31 July 2025

Appendix F: How far Screwfix Sprint has reached

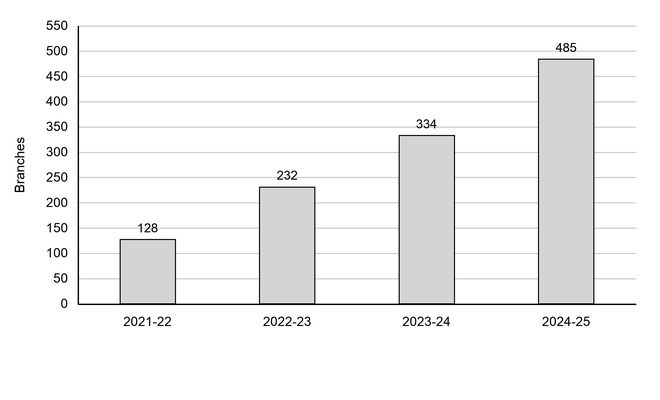
Bar chart of branches offering Screwfix Sprint, rising from 128 in 2021/22 to 232 in 2022/23, 334 in 2023/24 and 485 in 2024/25; vertical axis shows 0 to 550 branches.
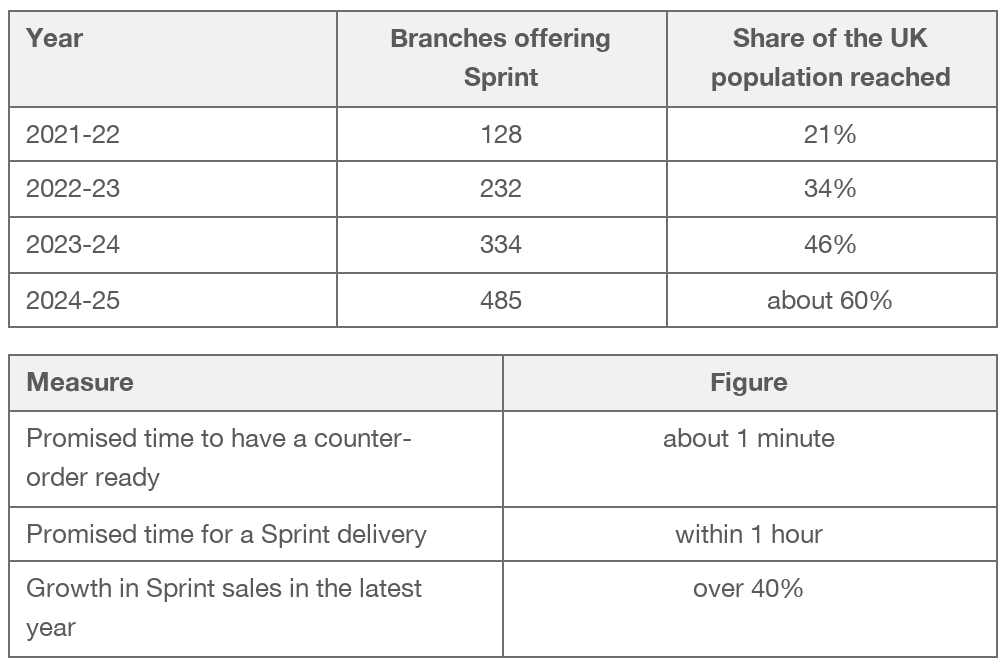
Table showing Sprint reach: 128 branches and 21% of UK population in 2021/22, rising to 485 and about 60% in 2024/25. Orders are ready in about 1 minute; delivery is within 1 hour; sales growth exceeds 40%.

Source: Analyst

Analyse one way in which promising a Sprint delivery within an hour might affect the number of staff Screwfix needs in a branch.

4
6 marks

Source B: Greencore

Greencore is the largest sandwich manufacturer in the world and the biggest maker of pre-packed sandwiches in the United Kingdom. Almost nothing it makes carries its own name: it makes food to go for supermarkets and coffee chains, who sell it as their own.

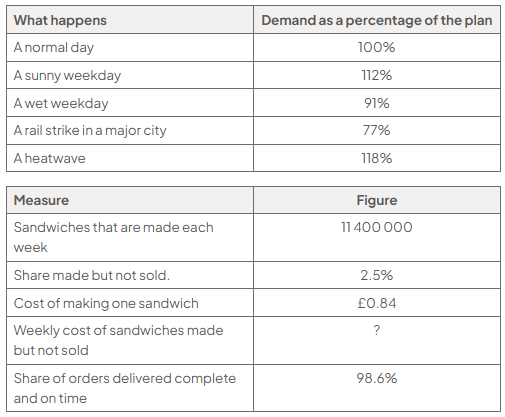
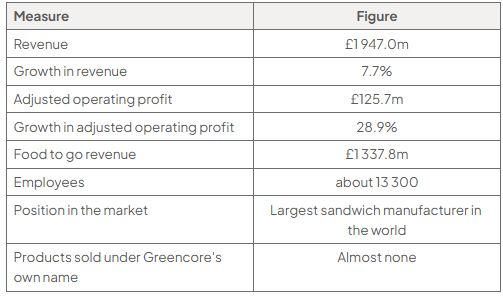
In the financial year to 26 September 2025 revenue rose 7.7% to £1 947.0 million and adjusted operating profit rose 28.9% to £125.7 million. Food to go, which covers sandwiches, salads, sushi and chilled snacking, brought in £1 337.8 million. The company employs about 13 300 people.

What makes the business unusual is that it holds almost no finished goods inventory. A sandwich made on Tuesday night is in a shop on Wednesday morning and must be sold that day. There is no warehouse of sandwiches to draw on if demand is higher than expected, and nothing can be made in advance and held. Greencore makes close to exactly what its customers have ordered, every day, and the order changes daily.

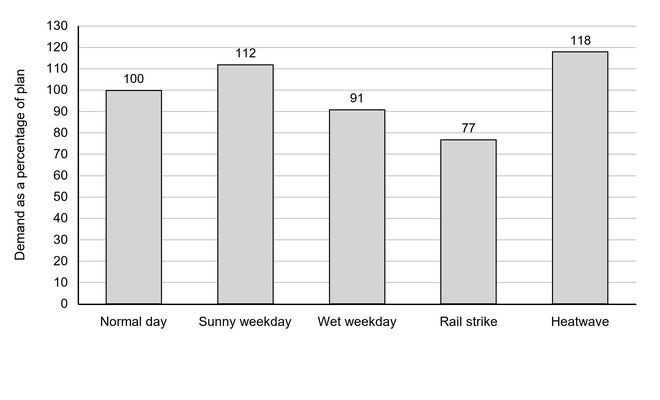
Demand is also unpredictable in ways the company does not control. A sunny Thursday sells more sandwiches than a wet one. A train strike empties city centres. Customers send their orders the afternoon before, and the factories build the night's production plan around them.

Everything therefore depends on being able to change what is made, and how much, at very short notice, and on suppliers who can do the same.

Source: Greencore Group plc full year results for the year ended 26 September 2025

Appendix G: What changes demand

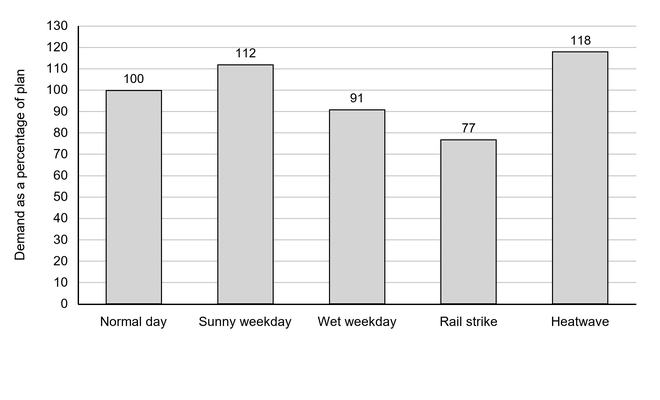
Bar chart of demand as a percentage of plan: normal day 100%, sunny weekday 112%, wet weekday 91%, rail strike 77%, and heatwave 118%. Vertical axis ranges from 0% to 130%.
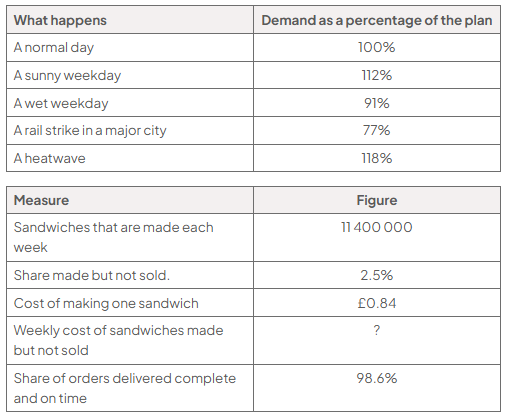
Two tables. Demand as a percentage of the plan: a normal day 100%; a sunny weekday 112%; a wet weekday 91%; a rail strike in a major city 77%; a heatwave 118%. A table of measures: sandwiches made each week 11 400 000; share made but not sold 2.5%; cost of making one sandwich £0.84; weekly cost of sandwiches made but not sold not provided; share of orders delivered complete and on time 98.6%.

Source: Analyst

Analyse one way in which demand reaching 112% of plan on a sunny weekday might affect Greencore's ability to supply its customers.

5
6 marks

Source B: Halfords

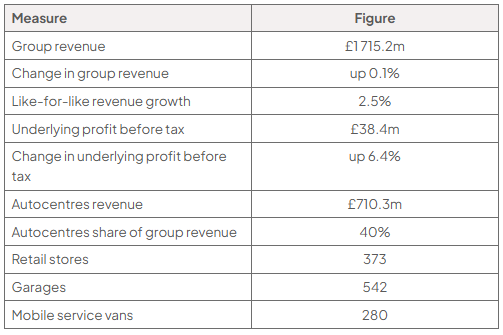
Halfords sells bikes, car parts and motoring products, and services and repairs cars. In the 52 weeks to 28 March 2025 group revenue was £1 715.2 million, almost flat on the year before but 2.5% ahead on a like-for-like basis, and underlying profit before tax rose 6.4% to £38.4 million. Customers reach it through 373 stores, 542 garages and 280 mobile service vans.

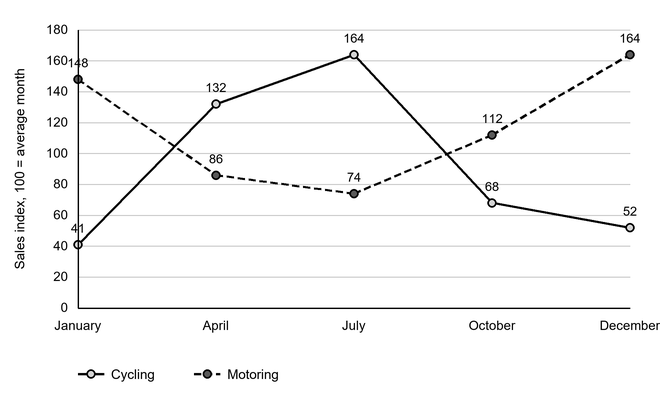
Two halves of the business pull in opposite directions through the year. Bikes sell in spring and summer; batteries, bulbs, wipers and screenwash sell in the dark and the cold. A wet April can take a third off cycling sales in a month, and the weather gives about a week's notice.

The buying does not work on a week's notice. Most cycling inventory is made outside the United Kingdom, and the gap between placing an order and having it in a store is about eighteen weeks. The season has to be bought before anybody knows what the weather will do, and whatever is left when the season ends gets marked down.

Against that, the garages have become the steadier half of the company. Servicing, maintenance and repair grew while retail stood still, and Halfords has begun putting stores and garages together on one site, where sales run about half again higher than in a standalone garage.

The decision in front of the buying team is how much of next year's cycling season to commit to before the spring.

Source: Halfords Group plc preliminary results for the 52 weeks to 28 March 2025

Appendix G: What the year looks like

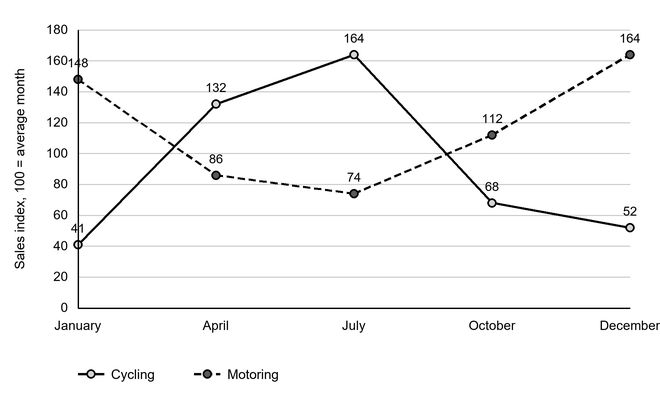
Line chart of the sales index, where 100 is an average month, for cycling and motoring: January, cycling 41 and motoring 148; April, cycling 132 and motoring 86; July, cycling 164 and motoring 74; October, cycling 68 and motoring 112; December, cycling 52 and motoring 164. The vertical axis runs from 0 to 180.
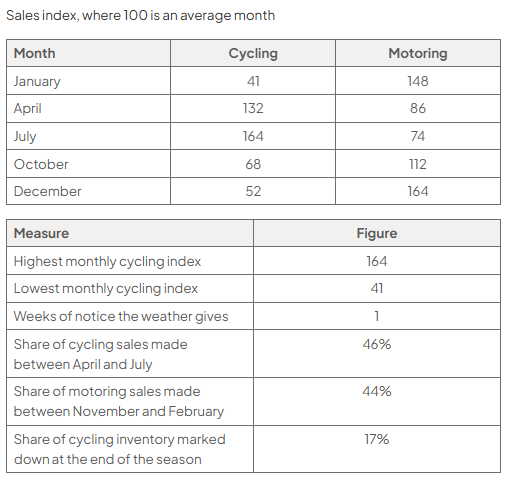
Two tables. Sales index, where 100 is an average month, for cycling and motoring: January 41 and 148; April 132 and 86; July 164 and 74; October 68 and 112; December 52 and 164. A table of measures: highest monthly cycling index 164; lowest monthly cycling index 41; 1 week of notice the weather gives; 46% of cycling sales made between April and July; 44% of motoring sales made between November and February; 17% of cycling inventory marked down at the end of the season.

Source: Analyst

Analyse one way in which cycling and motoring selling in opposite seasons might help Halfords manage its capacity.

6
6 marks

Source A: Thornbury Garden Products Ltd

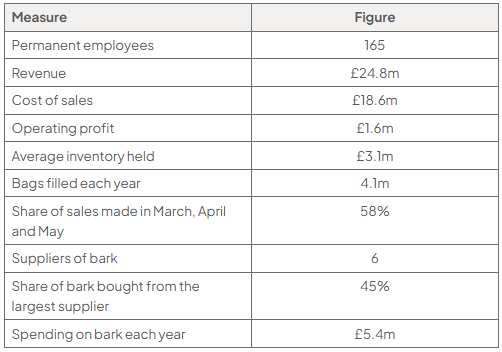
Thornbury Garden Products Ltd makes peat-free compost, bark mulch and growing media at one site near Evesham. It fills about 4.1 million bags a year, employs 165 permanent people, and in the year to March 2025 had revenue of £24.8 million, cost of sales of £18.6 million and an operating profit of £1.6 million.

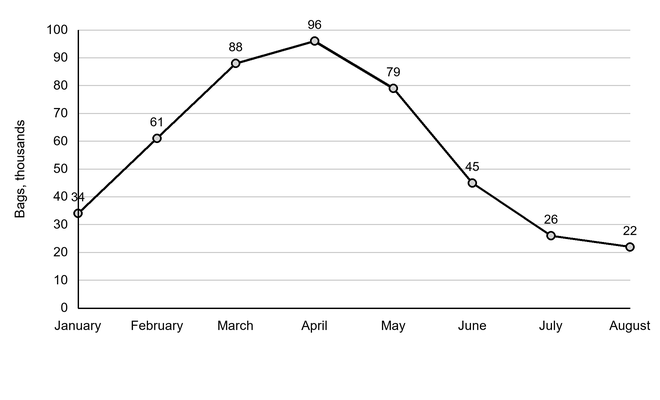
The whole business is shaped by three months. Fifty-eight per cent of the year's sales happen in March, April and May, because that is when people garden. In the peak the site fills 96 000 bags a week; in the quietest week of the year it fills 22 000. Nothing about the weather is known in advance, and a cold, wet April cannot be made up later in the year.

So the company builds inventory through the winter. By February it is holding about eleven weeks of finished bags, against three weeks in July. Compost is bulky and cheap: a lorry fills up long before it reaches its weight limit, the yard holds 620 000 bags and anything beyond that goes into rented outside storage. Bags left in sunlight begin to degrade after about nine months.

The other pressure is bark. Thornbury buys from six suppliers and 45% of its bark comes from one of them, on an annual bark spend of £5.4 million. Since peat was withdrawn from retail growing media, every maker in the country has been competing for the same bark, and the largest supplier knows it.

The operations director has to decide how to secure the bark before next winter's inventory build begins.

Source: Thornbury Garden Products Ltd

Appendix C: When the year's sales happen, and who makes them

Bags filled in a typical week, thousands

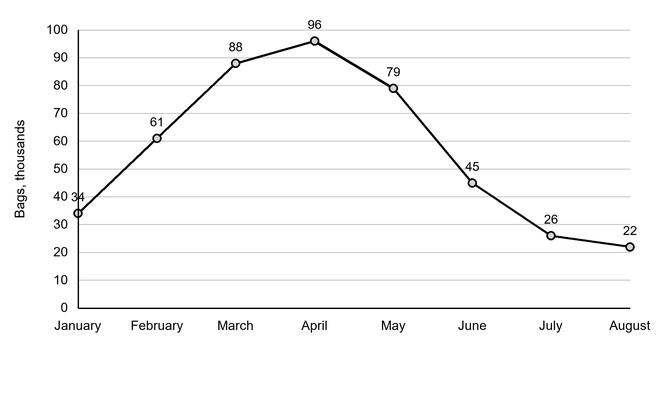
Line chart of weekly bags filled from January to August, in thousands: 34, 61, 88, 96, 79, 45, 26 and 22 respectively. Production peaks in April before falling sharply through summer.
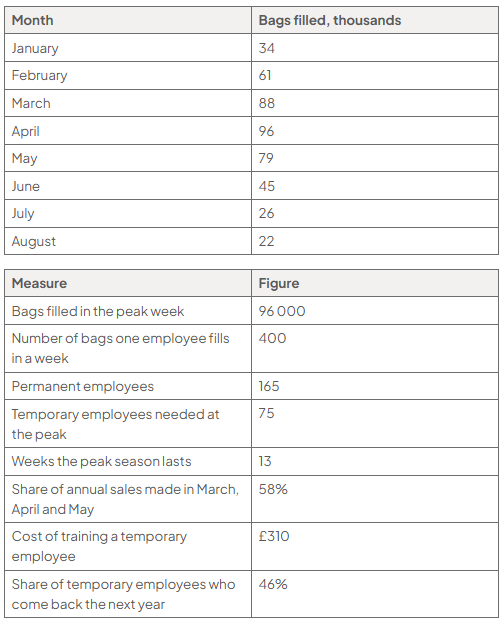
Tables show monthly bags filled (thousands): Jan 34, Feb 61, Mar 88, Apr 96, May 79, Jun 45, Jul 26, Aug 22. Other figures: 96,000 peak/week; 400 per employee; 165 permanent; 13 peak weeks; 58%; £310 training; 46% return; temporary staff: 75

Source: Analyst

Analyse one way in which making 58% of its sales in three months might affect how Thornbury Garden Products Ltd plans production.

7
6 marks

Source B: Alderney Foods Ltd

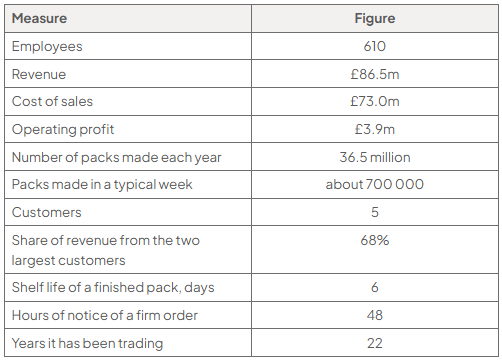
Alderney Foods Ltd makes chilled ready meals for supermarkets from one factory near Peterborough. It employs 610 people, makes about 36.5 million packs a year or roughly 700 000 a week, and in the year to March 2025 had revenue of £86.5 million, cost of sales of £73.0 million and an operating profit of £3.9 million. Five customers buy from it and the two largest provide 68% of revenue.

Everything about the business is decided by six days. That is how long a finished pack lasts, so nothing can be made early and nothing unsold can be held back. The company holds under half a million pounds of inventory against £73 million of cost of sales, and 44% of its ingredients are bought on the day they are used.

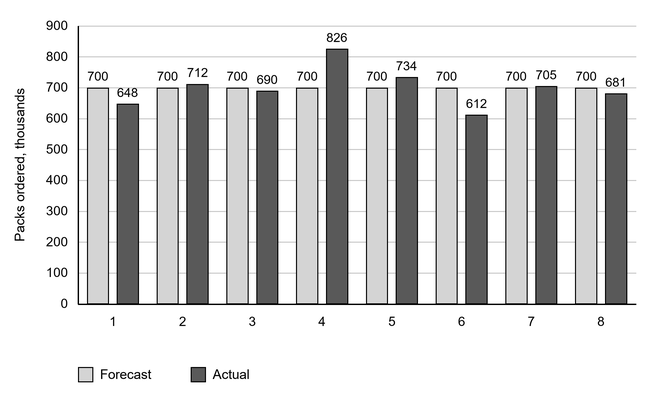
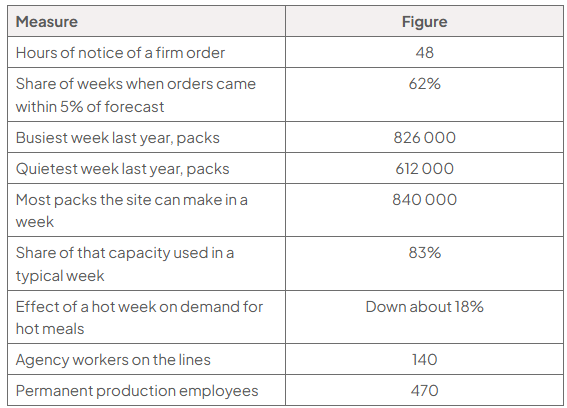
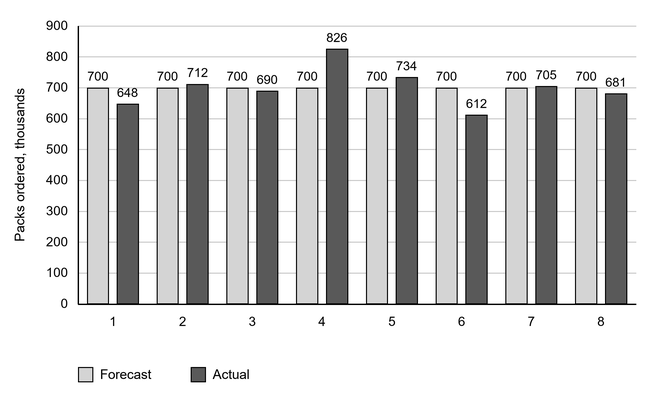
Demand is not steady and not knowable. Supermarkets confirm a firm order forty-eight hours before delivery, promotions move volumes without much warning, and a hot week takes about 18% off demand for hot meals. Last year the busiest week was 826 000 packs and the quietest 612 000, against a site that can make 840 000.

The two numbers that follow from all of this are the ones the board dislikes. Three per cent of everything made is thrown away, and 140 of the people on the lines are agency workers rather than employees.

Nobody is proposing to make the shelf life longer. The question is what to do about the waste.

Source: Alderney Foods Ltd

Appendix G: What Alderney was asked for, and what it expected

Packs ordered in a week, thousands

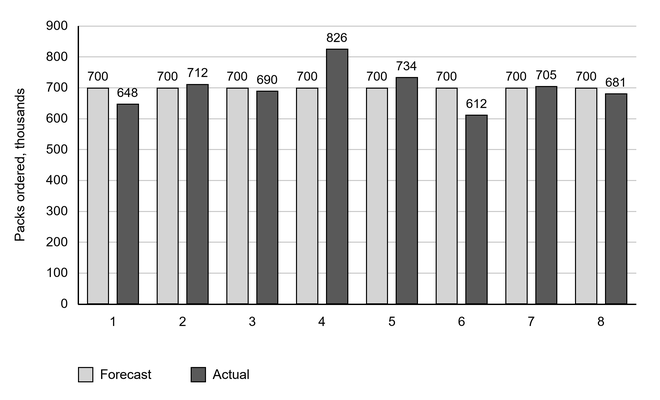
Bar chart of forecast and actual weekly orders: forecasts are 700 thousand packs each week, while actuals vary from 612 thousand in week 6 to 826 thousand in week 4; y-axis 0–900 thousand.
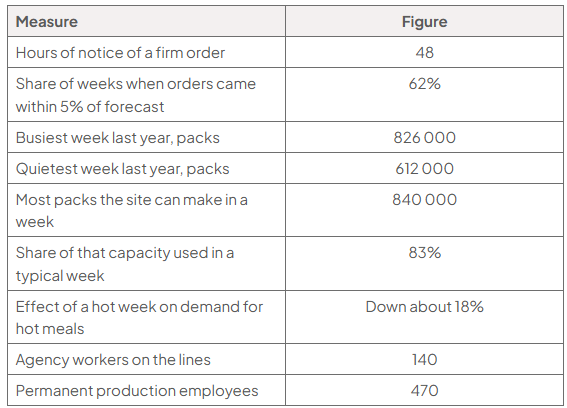
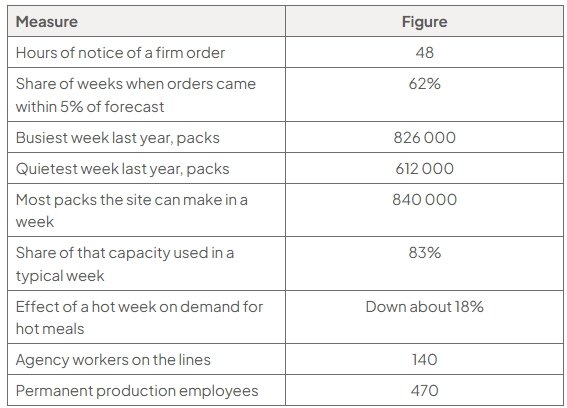
Table of Alderney Foods Ltd measures: 48 hours’ order notice; 62% of weeks within 5% of forecast; 826,000 busiest, 612,000 quietest and 840,000 weekly capacity; 83% typical use; hot-week demand down 18%; 140 agency and 470 permanent workers.

Source: Analyst

Analyse one way in which having only forty-eight hours' notice of a firm order might affect Alderney Foods Ltd.

1
9 marks

Source B: Thaxted Seed Co Ltd

Thaxted Seed Co Ltd supplies vegetable and flower seed to garden centres and smallholdings across eastern England. It employs 28 people at a single site in Essex, and in the year to September 2025 it had revenue of £4.2 million and an operating profit of £310 000.

Almost everything it sells, it sells in eight weeks. Gardeners buy seed in March and April, and garden centres want their shelves full by the last week of February. Between May and January the warehouse is quiet. In the year to September 2025, 71% of the company's revenue came in March and April alone.

Seed cannot simply be made to order. It has to be grown, harvested, dried, tested for germination and packeted, and that work happens on a different timetable from the selling. Thaxted therefore buys and packets its seed through the autumn and holds it until spring. Seed also loses the ability to germinate as it ages, so anything unsold at the end of a season is worth far less the following year and is usually written off.

The company buys 62% of its seed from one Dutch grower, Verhoeven BV, which it has used since 1994. Verhoeven offers lower prices than anyone else and has never missed a delivery, but in August 2025 a wet harvest cut the quantity it could supply by a fifth, and Thaxted had to buy the shortfall elsewhere at short notice and at a higher price. The managing director, Tom Prideaux, has started asking whether depending on one supplier for most of what the company sells is wise.

Source: Thaxted Seed Co Ltd

Appendix E: Thaxted Seed Co Ltd revenue by period

Bar chart of Thaxted Seed Co Ltd revenue by period: £196 000 in October to January, £410 000 in February, £1.68m in March, £1.302m in April and £612 000 in May to September; March is highest.
Table of Thaxted Seed Co Ltd revenue by period: October to January £196 000, February £410 000, March £1.68m, April £1.302m and May to September £612 000. Total revenue is £4.2m; March and April account for 71%.

Source: Thaxted Seed Co Ltd

Appendix H: Two ways of handling the spring peak

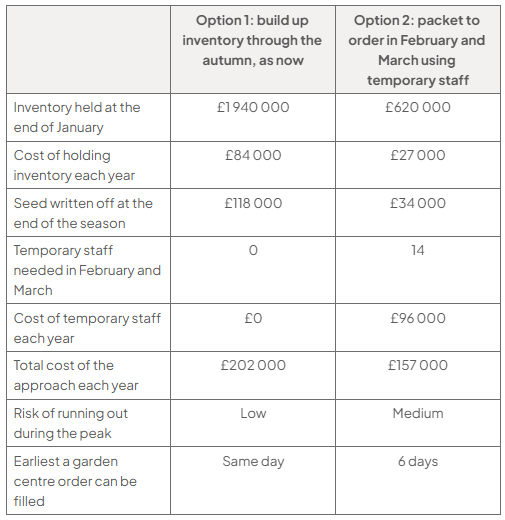
Comparison of two approaches: build autumn inventory or packet to order using 14 temporary staff. Annual total costs are £202 000 and £157 000 respectively; stock-out risk is low versus medium, and orders take the same day versus 6 days.

Source: Analyst

Assess the usefulness to Thaxted Seed Co Ltd of using temporary staff to cope with the spring peak.

2
9 marks

Source B: Screwfix

Screwfix sells tools, fixings, plumbing and electrical supplies to tradespeople. It is owned by Kingfisher, which also owns B&Q. Its branches are not really shops: most of the inventory sits in a warehouse behind a counter, and customers order on a phone or a screen and collect in minutes.

That speed is the product. A plumber halfway through a job cannot wait until tomorrow. Screwfix promises that what is ordered will be ready to collect in about a minute, and its Screwfix Sprint service delivers to a customer's door within an hour. Sprint sales grew by more than 40% in the year, and the service was extended to 151 more branches, so it now runs from 485 branches covering roughly 60% of the United Kingdom's population.

Trading has been solid in a difficult market for home improvement. Total sales rose 4.0% to £2 636 million in the year to 31 January 2025, with like-for-like sales up 1.0%. In the first half of 2025/26 sales rose 4.4% to £1 358 million, with like-for-like up 3%. The business is opening about 40 more branches and is working towards 1 000 across the United Kingdom and Ireland.

All of this depends on something invisible to the customer: having the right item within a few minutes of them. A branch is small, so it cannot hold everything, and what it does not hold has to come from a distribution centre fast enough to matter. Where those distribution centres sit, and how much inventory they hold, is the decision the business keeps returning to.

Source: Kingfisher plc results for the year to 31 January 2025 and the half year to 31 July 2025

Appendix E: Selected data for Screwfix

Table of selected Screwfix data: 2025 sales £2 636m, growth 4%, like-for-like 1%; half-year sales £1 358m, growth 4.4%, like-for-like 3%; Sprint growth over 40%, 485 branches, 60% UK reach, 40 planned, target 1 000.

Source: Kingfisher plc

Appendix F: How far Screwfix Sprint has reached

Bar chart of Screwfix branches offering Sprint, rising from 128 in 2021/22 to 232 in 2022/23, 334 in 2023/24 and 485 in 2024/25; vertical axis 0 to 550 branches.
Tables show Sprint reach rising from 128 branches and 21% of the UK population in 2021/22 to 485 branches and about 60% in 2024/25; orders take about 1 minute, delivery within 1 hour, sales growth over 40%.

Source: Analyst

Assess whether extending Screwfix Sprint to more branches is the best way for Screwfix to grow its sales.

3
9 marks

Source B: Halfords

Halfords sells bikes, car parts and motoring products, and services and repairs cars. In the 52 weeks to 28 March 2025 group revenue was £1 715.2 million, almost flat on the year before but 2.5% ahead on a like-for-like basis, and underlying profit before tax rose 6.4% to £38.4 million. Customers reach it through 373 stores, 542 garages and 280 mobile service vans.

Two halves of the business pull in opposite directions through the year. Bikes sell in spring and summer; batteries, bulbs, wipers and screenwash sell in the dark and the cold. A wet April can take a third off cycling sales in a month, and the weather gives about a week's notice.

The buying does not work on a week's notice. Most cycling inventory is made outside the United Kingdom, and the gap between placing an order and having it in a store is about eighteen weeks. The season has to be bought before anybody knows what the weather will do, and whatever is left when the season ends gets marked down.

Against that, the garages have become the steadier half of the company. Servicing, maintenance and repair grew while retail stood still, and Halfords has begun putting stores and garages together on one site, where sales run about half again higher than in a standalone garage.

The decision in front of the buying team is how much of next year's cycling season to commit to before the spring.

Source: Halfords Group plc preliminary results for the 52 weeks to 28 March 2025

Appendix E: Halfords, published figures for the 52 weeks to 28 March 2025

Table of Halfords’ published figures: group revenue £1 715.2m, up 0.1%; like-for-like growth 2.5%; underlying profit before tax £38.4m, up 6.4%; autocentres revenue £710.3m, 40% of group revenue.

Source: Halfords Group plc

Appendix G: What the year looks like

Sales index, where 100 is an average month

Line graph of monthly sales indices (100 = average month) for cycling and motoring at January, April, July, October and December; vertical scale 0 to 180. Cycling: 41, 132, 164, 68, 52; motoring: 148, 86, 74, 112, 164.
Two tables. Sales index, where 100 is an average month, for cycling and motoring: January 41 and 148; April 132 and 86; July 164 and 74; October 68 and 112; December 52 and 164. A table of measures: highest monthly cycling index 164; lowest monthly cycling index 41; 1 week of notice the weather gives; 46% of cycling sales made between April and July; 44% of motoring sales made between November and February; 17% of cycling inventory marked down at the end of the season.

Source: Analyst

Assess how well Halfords is able to match what it sells to when customers want it.

4
9 marks

Source A: Thornbury Garden Products Ltd

Thornbury Garden Products Ltd makes peat-free compost, bark mulch and growing media at one site near Evesham. It fills about 4.1 million bags a year, employs 165 permanent people, and in the year to March 2025 had revenue of £24.8 million, cost of sales of £18.6 million and an operating profit of £1.6 million.

The whole business is shaped by three months. Fifty-eight per cent of the year's sales happen in March, April and May, because that is when people garden. In the peak the site fills 96 000 bags a week; in the quietest week of the year it fills 22 000. Nothing about the weather is known in advance, and a cold, wet April cannot be made up later in the year.

So the company builds inventory through the winter. By February it is holding about eleven weeks of finished bags, against three weeks in July. Compost is bulky and cheap: a lorry fills up long before it reaches its weight limit, the yard holds 620 000 bags and anything beyond that goes into rented outside storage. Bags left in sunlight begin to degrade after about nine months.

The other pressure is bark. Thornbury buys from six suppliers and 45% of its bark comes from one of them, on an annual bark spend of £5.4 million. Since peat was withdrawn from retail growing media, every maker in the country has been competing for the same bark, and the largest supplier knows it.

The operations director has to decide how to secure the bark before next winter's inventory build begins.

Source: Thornbury Garden Products Ltd

Appendix A: Thornbury Garden Products Ltd selected data, year to March 2025

Table of Thornbury Garden Products Ltd selected data for the year to March 2025: 165 permanent employees; revenue £24.8m; cost of sales £18.6m; operating profit £1.6m; average inventory held £3.1m; 4.1m bags filled each year; 58% of sales made in March, April and May; 6 suppliers of bark; 45% of bark bought from the largest supplier; spending on bark each year £5.4m.

Source: Thornbury Garden Products Ltd

Appendix C: When the year's sales happen, and who makes them

Bags filled in a typical week, thousands

Line chart of weekly bags filled from January to August, rising from 34 thousand to a peak of 96 thousand in April before falling to 22 thousand in August; vertical scale is 0 to 100 thousand.
Two tables show weekly bags filled (thousands): Jan 34, Feb 61, Mar 88, Apr 96, May 79, Jun 45, Jul 26, Aug 22; staffing data: peak 96 000, 400 per employee, 165 permanent, 13 weeks, 58%, £310, 46%, temporary peak 75.

Source: Analyst

Assess whether taking on temporary employees is the best way for Thornbury Garden Products Ltd to meet demand in the peak season.

Calculate the employee productivity Thornbury Garden Products Ltd would need in the peak week if it used only its 165 permanent employees, to support your answer.

5
9 marks

Source B: Alderney Foods Ltd

Alderney Foods Ltd makes chilled ready meals for supermarkets from one factory near Peterborough. It employs 610 people, makes about 36.5 million packs a year or roughly 700 000 a week, and in the year to March 2025 had revenue of £86.5 million, cost of sales of £73.0 million and an operating profit of £3.9 million. Five customers buy from it and the two largest provide 68% of revenue.

Everything about the business is decided by six days. That is how long a finished pack lasts, so nothing can be made early and nothing unsold can be held back. The company holds under half a million pounds of inventory against £73 million of cost of sales, and 44% of its ingredients are bought on the day they are used.

Demand is not steady and not knowable. Supermarkets confirm a firm order forty-eight hours before delivery, promotions move volumes without much warning, and a hot week takes about 18% off demand for hot meals. Last year the busiest week was 826 000 packs and the quietest 612 000, against a site that can make 840 000.

The two numbers that follow from all of this are the ones the board dislikes. Three per cent of everything made is thrown away, and 140 of the people on the lines are agency workers rather than employees.

Nobody is proposing to make the shelf life longer. The question is what to do about the waste.

Source: Alderney Foods Ltd

Appendix E: Alderney Foods Ltd selected data, year to March 2025

Table of Alderney Foods Ltd selected data: 610 employees; revenue £86.5m; cost of sales £73.0m; operating profit £3.9m; 36.5 million packs made each year, about 700 000 in a typical week; 5 customers, with 68% of revenue from the two largest; a finished pack has a shelf life of 6 days; firm orders give 48 hours' notice; trading for 22 years.

Source: Alderney Foods Ltd

Appendix G: What Alderney was asked for, and what it expected

Packs ordered in a week, thousands

Bar chart of weekly forecast and actual packs ordered, in thousands, for weeks 1 to 8. Forecast is 700 each week; actual orders are 648, 712, 690, 826, 734, 612, 705 and 681. Axis ranges from 0 to 900.
Alderney Foods data table: 48 hours’ order notice; 62% of weeks within 5% of forecast; busiest and quietest weeks 826 000 and 612 000 packs; capacity 840 000, normally 83% used; hot-week demand down 18%; 140 agency and 470 permanent workers.

Source: Analyst

Assess whether using 140 agency workers is the best way for Alderney Foods Ltd to match its output to demand.

1
15 marks

Source B: Ocado Retail

Ocado Retail is the United Kingdom's only large supermarket that sells groceries online and has no shops at all. It is a joint venture owned half by Ocado Group and half by Marks and Spencer.

Instead of shops it runs seven customer fulfilment centres. These are huge automated warehouses in which thousands of robots travel across a grid above crates of groceries, lifting out the items each customer has ordered and passing them to packers. The centre at Erith has more than 3 500 robots and about 750 000 storage locations. A fleet of branded vans then delivers from these centres, and from smaller regional sites called spokes, to more than 80% of UK households.

The automation gives Ocado Retail very tight control of its inventory. It wastes 0.038% of the food it handles, which is roughly one product in every 2 600.

Trading has been strong. In the year to 6 April 2025 revenue rose 15.5% to £2 826.8 million, from £2 446.6 million. Active customers rose 14.6% to 1.2 million and orders rose 13% to 469 600 a week, while the average basket held steady and selling prices rose only 0.4%, well below inflation.

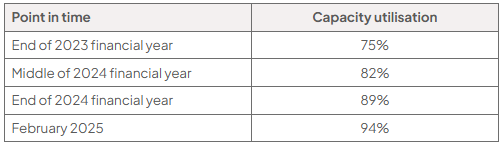
The business is also using its warehouses much harder than it was. Capacity utilisation across the fulfilment centres rose from 75% at the end of the 2023 financial year to as much as 94% by February 2025. Profitability improved with it: adjusted earnings before interest, tax, depreciation and amortisation rose 78.3% to £53.5 million, and the loss before tax narrowed from £121.7 million to £60.0 million.

Demand is not spread evenly. Orders peak sharply on Friday and Saturday, and again in the week before Christmas, and every order has to be picked, packed and delivered within a slot the customer has chosen.

Source: Ocado Retail and Ocado Group annual reports and trading statements, 2024 to 2026

Appendix E: Selected data for Ocado Retail

Table of selected Ocado Retail data for the year to 6 April 2025 versus the previous year: revenue £2,826.8m versus £2,446.6m; customers and orders up 14.6% and 13%; EBITDA up 78.3%; loss £60.0m versus £121.7m.

Source: Ocado Retail

Appendix F: Capacity utilisation of Ocado Retail's customer fulfilment centres

Table showing Ocado Retail fulfilment-centre capacity utilisation: 75% at the end of 2023, 82% in mid-2024, 89% at the end of 2024 and 94% in February 2025.

Source: Ocado Retail

Appendix G: Orders in a typical week at one Ocado Retail fulfilment centre

Bar chart of orders at one fulfilment centre across Monday to Sunday: orders rise from 7,400 on Monday to 16,200 on Saturday, then fall to 10,500 on Sunday; vertical axis ranges from 0 to 18,000 orders.
Table of daily orders at one fulfilment centre: Monday to Sunday values range from 7,400 to 16,200, with Saturday at 16,200; daily capacity is 15,000 orders.

Source: Analyst

Ocado Retail is considering two ways of coping with the peak in orders on a Friday and Saturday:

Option 1: open an eighth customer fulfilment centre

Option 2: offer customers lower delivery charges to move their orders to quieter days

Evaluate both options and recommend which one Ocado Retail should choose.

Calculate the capacity utilisation of the centre in Appendix G on a Saturday to support your answer.

2
15 marks

Source B: Greencore

Greencore is the largest sandwich manufacturer in the world and the biggest maker of pre-packed sandwiches in the United Kingdom. Almost nothing it makes carries its own name: it makes food to go for supermarkets and coffee chains, who sell it as their own.

In the financial year to 26 September 2025 revenue rose 7.7% to £1 947.0 million and adjusted operating profit rose 28.9% to £125.7 million. Food to go, which covers sandwiches, salads, sushi and chilled snacking, brought in £1 337.8 million. The company employs about 13 300 people.

What makes the business unusual is that it holds almost no finished goods inventory. A sandwich made on Tuesday night is in a shop on Wednesday morning and must be sold that day. There is no warehouse of sandwiches to draw on if demand is higher than expected, and nothing can be made in advance and held. Greencore makes close to exactly what its customers have ordered, every day, and the order changes daily.

Demand is also unpredictable in ways the company does not control. A sunny Thursday sells more sandwiches than a wet one. A train strike empties city centres. Customers send their orders the afternoon before, and the factories build the night's production plan around them.

Everything therefore depends on being able to change what is made, and how much, at very short notice, and on suppliers who can do the same.

Source: Greencore Group plc full year results for the year ended 26 September 2025

Appendix E: Selected data for Greencore, year to 26 September 2025

Greencore 2025 selected data table: revenue £1,947.0m, up 7.7%; adjusted operating profit £125.7m, up 28.9%; food-to-go revenue £1,337.8m; about 13,300 employees; largest sandwich manufacturer worldwide; almost no own-brand products.

Source: Greencore Group plc

Appendix G: What changes demand

Bar chart of demand as a percentage of plan: normal day 100%, sunny weekday 112%, wet weekday 91%, rail strike 77%, and heatwave 118%; vertical axis ranges from 0% to 130%.
Two tables show demand versus plan: normal 100%, sunny 112%, wet 91%, rail strike 77%, heatwave 118%; and weekly figures: 11,400,000 sandwiches, 2.5% unsold, £0.84 each, cost ?, 98.6% on time.

Source: Analyst

Appendix H: Two ways of coping with demand that will not sit still

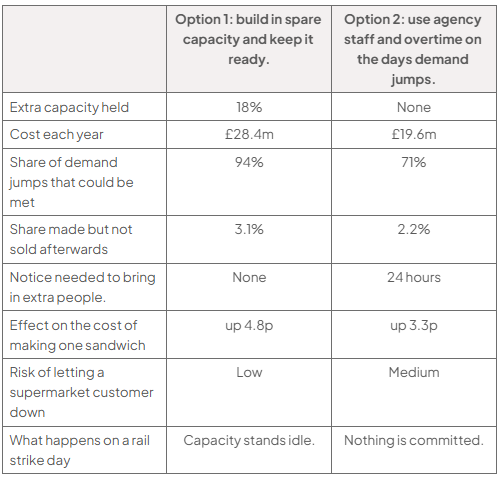
Comparison table of Option 1, spare capacity, and Option 2, agency staff and overtime: 18% versus none; annual cost £28.4m versus £19.6m; demand jumps met 94% versus 71%; unsold 3.1% versus 2.2%; notice none versus 24 hours; cost per sandwich up 4.8p versus 3.3p; customer risk low versus medium; during a rail strike, capacity stands idle versus nothing committed.

Source: Analyst

Greencore is considering two ways of coping with demand that changes from day to day:

Option 1: build in spare capacity and keep it ready

Option 2: use agency staff and overtime on the days demand jumps

Evaluate both options and recommend which one Greencore should choose.

Calculate the weekly cost of sandwiches that are made but not sold to support your answer.

3
15 marks

Source B: Alderney Foods Ltd

Alderney Foods Ltd makes chilled ready meals for supermarkets from one factory near Peterborough. It employs 610 people, makes about 36.5 million packs a year or roughly 700 000 a week, and in the year to March 2025 had revenue of £86.5 million, cost of sales of £73.0 million and an operating profit of £3.9 million. Five customers buy from it and the two largest provide 68% of revenue.

Everything about the business is decided by six days. That is how long a finished pack lasts, so nothing can be made early and nothing unsold can be held back. The company holds under half a million pounds of inventory against £73 million of cost of sales, and 44% of its ingredients are bought on the day they are used.

Demand is not steady and not knowable. Supermarkets confirm a firm order forty-eight hours before delivery, promotions move volumes without much warning, and a hot week takes about 18% off demand for hot meals. Last year the busiest week was 826 000 packs and the quietest 612 000, against a site that can make 840 000.

The two numbers that follow from all of this are the ones the board dislikes. Three per cent of everything made is thrown away, and 140 of the people on the lines are agency workers rather than employees.

Nobody is proposing to make the shelf life longer. The question is what to do about the waste.

Source: Alderney Foods Ltd

Appendix F: What Alderney holds, and what it throws away

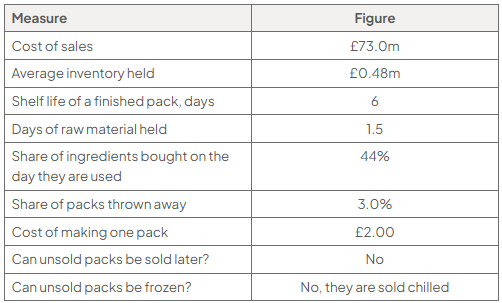
Table of inventory and waste measures: £73.0m cost of sales; £0.48m average inventory; six-day shelf life; 1.5 days’ raw-material inventory; 44% ingredients bought when used; 3.0% packs discarded; £2 per pack; unsold packs cannot be sold later or frozen and are sold chilled.

Source: Analyst

Appendix G: What Alderney was asked for, and what it expected

Packs ordered in a week, thousands

Bar chart comparing weekly forecast and actual packs ordered, in thousands, for weeks 1–8. Forecast is 700 each week; actuals are 648, 712, 690, 826, 734, 612, 705 and 681.
Table of Alderney Foods measures: 48 hours’ notice; 62% of weeks within 5% of forecast; busiest and quietest weeks 826,000 and 612,000 packs; capacity 840,000; typical use 83%; hot weeks reduce demand 18%; 140 agency and 470 permanent workers.

Source: Analyst

Evaluate two ways in which Alderney Foods Ltd could match its output to demand more closely, and recommend which one it should do first.

Calculate Alderney Foods Ltd's inventory turnover to support your answer.