How to Answer Maths & Data Questions (AQA GCSE Psychology): Revision Note
Exam code: 8182
Written by: Raj Bonsor
Updated on
How do I answer AQA GCSE Psychology maths and data questions?
At least 10% of the marks in GCSE Psychology are for mathematical skills
Maths and data questions can appear in any section of both papers, set in the context of a study
Most are worth between 1 mark and 4 marks, and they assess your ability to:
apply your mathematical knowledge to the data from a study (assessment objective 2, or AO2)
analyse data to draw conclusions (AO3)
You are allowed to use a calculator in both papers
The skills that you can be asked to use are:
decimal form, standard form, significant figures and estimates
frequency tables, bar charts, histograms and scatter diagrams
the characteristics of normal distribution
How do I answer a calculation question?
Always show your workings, as marks are available for correct workings even when the final answer is incorrect
Read the question carefully to check which numbers you need
E.g. a question may ask how many participants did not do something
Give the statistic that the question asks for
E.g. if you are asked for the median, do not calculate the mean
Finish the calculation in the form that the question asks for:
a fraction or a ratio 'in its simplest form' must be simplified, e.g. 60:10 becomes 6:1
a ratio must be written in the order given in the question, e.g. 6:1 and not 1:6
an answer 'to two significant figures' must be rounded correctly, e.g. 37.5% becomes 38%, not 37%
Worked Example
Here is an example of a 2-mark percentage question:
20 people were shown an image of two cars on a road and asked whether Car A or Car B was further away in the image.
18 people said that Car B was further away.
Q. Calculate the percentage of people who said Car B was further away.
Show your workings.
[2 marks]
Answer:
Divide the number who said Car B by the total number of people, then multiply by 100:
Percentage = 90\% [2 marks]
Marking commentary:
This response receives full marks because the answer is correct. The workings are shown in full, so a student who wrote the correct calculation but made an error in the final answer would still receive 1 mark.
How do I draw a table or graph?
A typical 4-mark graph question gives 1 mark for each of the following:
an informative title, which refers to both variables
correct labelling of both axes
correct scaling of both axes
correct plotting of the results
In some papers, one of the marks is for using the correct type of graph, and labelling and scaling share a mark
Always write a title, as it earns a mark
E.g. 'A scatter diagram to show the relationship between mean daily social media use and mean daily happiness score'
Copy the wording of the table headings into your axis labels
E.g. if the table shows mean scores, the word 'mean' needs to be in the label
Choose the correct type of graph:
a bar chart for data in separate categories, with gaps between the bars
a histogram for continuous data, with the bars touching
a scatter diagram for a correlation between two co-variables
A frequency table needs rows and columns, a heading for each column and a row for each category of behaviour
A scatter diagram showing the relationship between the number of hours spent on social media and the number of hours spent reading for pleasure
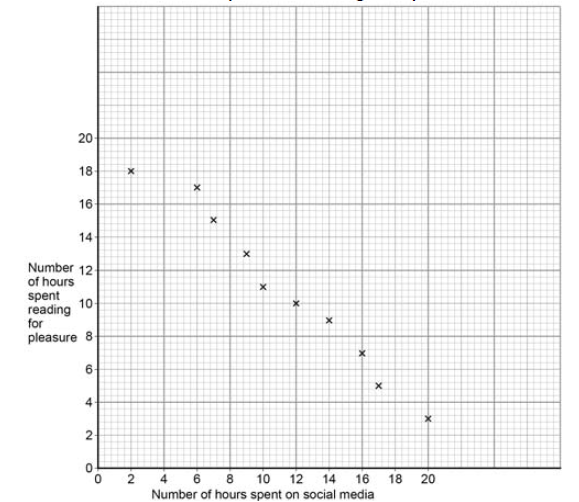
A scatter diagram with an informative title, labelled axes, a scale on each axis and plotted points
How do I draw a conclusion from data?
A conclusion is what the results suggest, and it is not the same as the results themselves
'The range for males was higher than for females' restates a result
'The scores for males were more spread out than the scores for females' is a conclusion
When a question says 'Use the data to explain your answer', quote the numbers that support your conclusion
Words such as 'more' or 'less' on their own are not enough
Data that is collected as words is not always qualitative
If the researcher counts how many participants gave each answer, the data is quantitative
Examiner Tips and Tricks
Examiners have suggested the following advice to help you improve your performance on maths and data questions:
Learn the characteristics of normal distribution
Most scores are grouped in the middle and the rest taper symmetrically towards each end, which produces a bell-shaped curve
The mean, median and mode are all of a very similar value and match the highest point of the curve
Do not describe a correlation in terms of an independent variable and a dependent variable
A correlation shows a relationship between two co-variables and cannot show cause and effect
Check your answer if you have time, as it is easy to copy the wrong number from the workings box onto the answer line

Unlock more, it's free!
Join the 100,000+ Students that ❤️ Save My Exams
the (exam) results speak for themselves:

Was this revision note helpful?