Thatcher's Economic Policies, 1979-1987 (AQA A Level History: Component 2: Depth study): Revision Note
Exam code: 7042

Summary
Monetarism aimed to reduce inflation by controlling the money supply and limiting government spending and borrowing, replacing the post-war commitment to full employment
The 1979 and 1981 Budgets tightened economic policy, the second in the middle of a deep recession
Interest rates reached 17%
VAT rose from 8 to 15%
The tax burden shifted from direct to indirect taxation
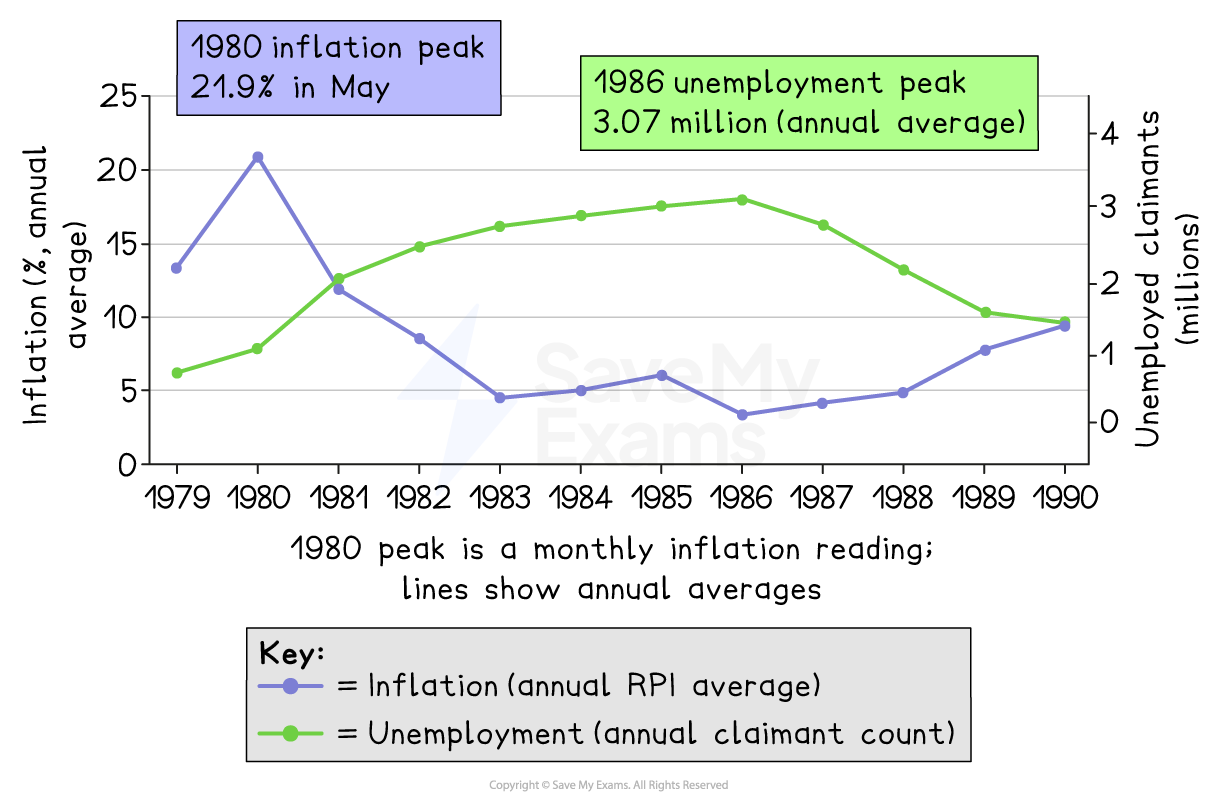
Inflation peaked at around 22% in 1980, falling to roughly 2.5% in 1986 before rising again towards the end of the decade
Unemployment passed 3 million in January 1982, peaking in 1986
The Midlands, the North, central Scotland and South Wales were hit the hardest
Economic realignment moved Britain from manufacturing towards service industries, deepening the north-south divide, though average growth of 2.2% was no better than in the 1970s
The key question asks whether Thatcher's economic policies successfully tackled Britain's economic problems, or whether they left a legacy of lasting damage to industry and employment in some regions
Monetarism
What was monetarism?
Monetarism was associated particularly with Milton Friedman and the Chicago School of Economists
They argued that inflation was caused when the money supply grew too quickly
The solution was tighter control of the money supply
This was combined with limits on government spending and borrowing
This challenged the priorities of the post-war consensus
Earlier governments had often treated unemployment as the greater danger
Thatcherites argued that controlling inflation should come first
They believed economic growth would follow once inflation was brought under control
The Medium Term Financial Strategy, announced in 1980, set targets for:
growth of the money supply
government borrowing
Publishing these targets was meant to convince markets that the government would not change course easily
The 1979 Budget
The 1979 Budget shifted taxation from direct to indirect taxes
The top rate of income tax fell from 83% to 60%
The basic rate fell from 33% to 30%
VAT rose from 8% to 15%
Duties on petrol, cigarettes and alcohol also increased
Supporters argued that lower direct taxes would:
reward work
encourage enterprise
leave individuals with more control over their income
Critics argued that indirect taxes placed a heavier burden on poorer households
Recession and the 1981 Budget
By 1980, Britain had entered a serious recession
Inflation rose above 15%
Unemployment climbed above 2 million
Stagflation had returned
North Sea oil revenue strengthened the public finances and helped avoid a balance-of-payments crisis
Many expected the government to change direction; instead, the 1981 Budget tightened policy further
Government borrowing was reduced
Grants to local councils were cut
Some benefits were frozen
The Budget was introduced during a recession
Critics described it as the biggest fiscal squeeze of peacetime
Thatcher's refusal to reverse course became important to her political reputation
It strengthened the image of her as a leader who would not change policy under pressure
Controlling public spending
Thatcherites believed that individuals usually spend money more efficiently than governments
Cutting spending was, therefore, an aim in itself
It was not only a way of controlling the money supply
Spending policy brought central government into conflict with Labour-controlled councils
Rate capping limited how much councils could raise through local taxation
In 1985, authorities, including Liverpool and Sheffield, refused to set legal rates
They later backed down when faced with the threat of bankruptcy
The Local Government Act (1985) abolished:
the Greater London Council (GLC)
the metropolitan county authorities
This shifted more power towards central government
Despite the language of spending cuts, total public spending did not fall in real terms
Rising unemployment increased social security costs
These costs offset savings made elsewhere
“Mrs Thatcher’s governments since 1979 have blended the new economic doctrine with opportunism. The virtues of the free market and the private firm, the hostility to nationalisation, the opposition to high taxes and a willingness to cut public expenditure, and the preference for sound money and a strong pound have all been consistent factors in Conservative thinking and rhetoric since the 1920s. Yet she threw away monetarism when it became a political liability. She abandoned much of the substance of her economic ideas in order to seek the pragmatic goal of prosperity. For the beneficiaries of this boom it has indeed become the case that they ‘had never had it so good’, in 1987 they voted with their wallets”
Paul Hirst, left-wing academic, commentary, written two years after the 1987 election in After Thatcher (1989)
Approach: Hirst was a left-wing academic writing in 1989, so his description of Thatcher’s economic policy as “opportunism” is clearly critical
However, the source is useful because he recognises both sides of Thatcherism: a continued commitment to the free market, privatisation and lower taxation, but also a willingness to abandon strict monetarism when it became politically difficult
His claim that voters “voted with their wallets” is useful for explaining Conservative support in 1987, although it does not account for Labour’s weaknesses or the divided opposition
Examiner Tips and Tricks
Keep the chronology clear. Monetarism was strongest in the first Thatcher government, especially between 1979 and 1981. By the second term, strict monetary targets mattered less and supply-side policies became more important
Inflation and unemployment
Controlling inflation
Interest rates were the government's main weapon against inflation
They rose to 17% in 1979
High rates made borrowing more expensive for businesses and pushed up the value of the pound
British exports became harder to sell abroad
Output and demand fell, businesses closed and unemployment rose
Inflation rose before it fell, peaking at around 22% in May 1980
It then fell steadily to around 2.5% in 1986
Inflation began to rise again by the late 1980s, with Britain joining the European Exchange Rate Mechanism in 1990 in a further attempt to hold it down
The rise in unemployment
Low unemployment was no longer the government's main economic objective
Thatcherites accepted that unemployment might rise while inflation was brought under control
Industry was expected to become more competitive, with job losses treated as a price worth paying
The recession hit manufacturing particularly hard
Manufacturing output fell by 15% in two years
Production in the West Midlands fell by around a quarter
Steel production fell by 30%, to less than 14 million tonnes
Plant closures were concentrated in:
the Midlands
the North
central Scotland
South Wales
Unemployment rose sharply as a result
It passed 3 million in January 1982, the highest figure since the 1930s
The claimant count peaked at just over 3.1 million in 1986
It did not fall below 3 million until 1987
Some areas were hit much harder than others
In Liverpool, unemployment reached 25%
It remained in double figures throughout the 1980s
Men were affected more heavily than women as more men were employed in manufacturing
In many households, women became the main earners
Measuring unemployment
Unemployment figures vary depending on how the rate is calculated
Contemporary figures gave a rate of about 13%
These measured claimants against the number of people in work
Modern Office for National Statistics (ONS) figures give a peak of 11.8% in 1984
These use the wider economically active population
Both figures are valid
They use different methods, so the safest comparison is often the number of people unemployed
“For the first time in a generation this country looks forward to an era of real prosperity and fulfilment. A vast change separates the Britain of today from the Britain of the late 1970s. Is it really only such a short time ago that inflation rose to an annual rate of 27 per cent? Remember the conventional wisdom of the day. The British people were ‘ungovernable’. We were in the grip of an incurable ‘British disease’. Britain was heading for ‘irreversible decline’. Well, the people were not ungovernable, the disease was not incurable, the decline has been reversed. ...”
Adapted from The Conservative Party general election manifesto, The Next Moves Forward (1987)
Approach: This was a Conservative Party campaign document published during the 1987 election, so it was designed to persuade voters that the government’s economic policies had been successful
It is useful for showing how the Conservatives presented the 1980s: as a period of recovery from the inflation and economic problems of the late 1970s. However, its claim that national decline had been “reversed” is clearly part of an election argument, so it should be checked against evidence on inflation, unemployment and living standards before accepting it fully
Examiner Tips and Tricks
Treat inflation and unemployment as part of the same story. Inflation fell, but unemployment rose sharply during the recession, so the two need to be compared rather than discussed separately
Use unemployment figures carefully. The number unemployed is often safer than a percentage because contemporary and modern rates were calculated in different ways
Economic realignment
The shift from manufacturing to services
Britain's traditional industries were already in long-term decline before 1979
British firms faced growing competition from overseas
New technology reduced the need for some forms of industrial labour
The economy was already beginning to move away from manufacturing and heavy industry towards service industries
These included finance, retail and travel
Thatcher's policies did not begin this shift, but they accelerated it
Employment in manufacturing fell from 7.1 million in 1979 to around 5 million by 1990
Some commentators described the process as the deindustrialisation of Britain
Workers in traditional industries found that their skills were less in demand
Mechanisation and more flexible working practices also reduced the number of jobs available
The north-south divide
Economic change hit regions very unevenly, sharpening the north-south divide
Average weekly household income in 1985 was £248 in the South East
It was £173 in the North and North East
In 1986, 10.1% of the workforce was unemployed in the South East
This was 19.1% in the North East
Homeownership also varied between regions
In 1985, 41% of households in Scotland were owner-occupiers
In the South West, the figure was 69%
Job losses also varied sharply between regions from 1978 to 1986
The West Midlands lost around 301,000 jobs
The North West lost around 278,000
Yorkshire and Humberside lost around 266,000
The North and North East lost around 215,000
By contrast:
the South West gained around 39,000 jobs
East Anglia gained around 23,000
the South East gained around 73,000
The impact on industrial communities
Economic change affected whole communities, not just individual workers
When a major factory or industry closed, local shops and services also lost customers
Areas that had depended on one main employer could, therefore, decline quickly
Young people often moved away to find work
This reduced the working-age population in some former industrial areas, contributing to the decline
Urban decline brought wider social problems
Poor health and depression became more common in some areas
Alcohol and drug problems increased
Some towns and cities experienced severe deprivation
The effects were especially visible in older industrial cities
Liverpool became associated with what was sometimes referred to as 'managed decline'
Government responses
The government introduced measures to reduce some of the effects of unemployment
The Young Workers Scheme (1982) paid employers subsidies to take on young workers
Employer National Insurance contributions were reduced for lower-paid jobs
The Enterprise Allowance Scheme paid unemployed people £40 a week for up to a year to set up their own businesses
The government also supported regeneration in some declining urban areas
Michael Heseltine backed redevelopment projects in London and Liverpool
The redevelopment of the West India Docks led to the growth of Canary Wharf
It became an important centre for financial services
These policies aimed to attract new employment to areas that had lost traditional industry
They did not recreate the industries or jobs that had disappeared
Economic growth
Britain experienced stronger economic growth during the second half of the 1980s
Service industries and finance expanded
However, average growth across the decade was more modest
Average annual GDP growth during the 1980s was 2.2%
This was similar to Britain's performance in the 1970s
It was also similar to several of Britain's main competitors
The poor performance at the start of the decade reduced the overall figure
Stronger growth later in the 1980s was balanced by the deep recession of the early years
“It is impossible exactly to disentangle the positive (or negative) effects of Thatcherism from changes that were already in train. Unemployment was already rising when she came to power, the trend towards a greater inequality of income already well established, and the new underclass of the cities was already growing. We call this ‘Mrs Thatcher’s Britain’ but it is not a Britain of her making. ... However, the process of polarisation between the People and the Underclass was exacerbated by policies designed to speed the adjustment rather than to soften its economic and social pains. ... The Britain of the peripheral council estates, planning disasters on a vast scale, and of the declining inner city areas has become increasingly another country”
Peter Jenkins, left-leaning journalist, in Mrs Thatcher's Revolution: The Ending of the Socialist Era (1987)
Approach: Jenkins was a left-leaning journalist writing in 1987, so he was critical of Thatcherism but was also writing while many of its effects were still unfolding
The source is useful because he makes an important distinction between changes Thatcher caused and trends she accelerated. He accepts that unemployment and inequality were already rising before 1979, but argues that government policies deepened social and regional divisions
His criticism should therefore be checked against evidence on unemployment, income inequality and regional change, rather than simply accepted because of his political viewpoint
Examiner Tips and Tricks
Be careful with causation. Traditional industry was already declining before 1979. A stronger argument is that Thatcher’s policies accelerated an existing process and increased its impact on some regions
Use regional evidence wherever possible. National growth figures can hide large differences between places such as the South East, where jobs and incomes were stronger, and the North East or West Midlands, where industrial job losses were much greater
How successful were Thatcher's economic policies?
Thatcher's governments achieved one of their main aims by reducing inflation
However, this came with high unemployment, industrial decline and large regional differences
The overall judgement depends on whether the greater weight is given to lower inflation and economic restructuring, or to the social and industrial costs
Evidence that the policies succeeded
Inflation was brought down from around 22% in 1980 to around 2.5% in 1986
The government held its nerve in the 1981 recession rather than reversing course, which restored the confidence of financial markets and Conservative supporters
British industry was forced to become more competitive after decades of relative decline
Service industries, particularly financial services, grew strongly and became major export earners
The economy grew in the second half of the 1980s, helping the Conservatives to win a third term in 1987
North Sea oil revenue was used to steady the pound and avoid a balance-of-payments crisis
Evidence that the policies had serious limits
Unemployment passed 3 million in 1982 and stayed close to or above that level until 1987, the worst figures since the 1930s
Average growth of 2.2% across the 1980s was no better than in the 1970s, with productivity growing marginally
Monetarism was abandoned before the end of the second term
This meant the central policy was not sustained
Public spending was never cut in real terms, because unemployment drove social security costs upwards
The costs fell unevenly, deepening the north-south divide, leaving whole communities without their main employer
Inflation rose into double figures again by 1990, so the central achievement did not hold
“The 1980s saw the rebirth in Britain of an enterprise economy. This was by and large a decade of great prosperity, when our economic performance astonished the world. Whereas most European economies in the 1980s grew more slowly than they had the previous decade, the British economy grew faster. Trade union power, training, housing and business regulation were areas in which in varying degrees we made progress in strengthening the ‘supply side’ of the economy. ...”
Margaret Thatcher in her autobiography The Downing Street Years (1993)
Approach: Thatcher was writing in 1993, after leaving office, so this is a retrospective defence of her own economic record
The source is useful because it shows how she wanted Thatcherism to be remembered: as creating an enterprise economy, weakening trade union power and improving the supply side of the economy. However, claims that the 1980s were a decade of “great prosperity” should be checked against evidence on unemployment, regional inequality and the average growth rate for the decade
Because Thatcher was the architect of these policies, the source is valuable for understanding their aims, but less reliable as an independent judgement of their overall success
Examiner Tips and Tricks
Keep the whole period in view. Do not stop once inflation falls in the early 1980s. By the end of the decade, inflation was rising again, while some of the industrial and regional effects had become long-term

Unlock more, it's free!
Join the 100,000+ Students that ❤️ Save My Exams
the (exam) results speak for themselves:

Was this revision note helpful?