Required Practical: Investigating Stationary Waves (AQA A Level Physics): Revision Note
Exam code: 7408

Required practical: investigating stationary waves
Aims of the experiment
The overall aim of the experiment is to measure how the frequency of the first harmonic is affected by changing one of the following variables:
the length of the string
the tension in the string
strings with different values of mass per unit length
Variables:
Independent variable = either length, tension, or mass per unit length
Dependent variable = frequency of the first harmonic
Control variables:
If length is varied = same masses attached (tension), same string (mass per unit length)
If tension is varied = same length of the string, same string (mass per unit length)
If mass per unit length is varied = same masses attached (tension), same length of the string
Equipment list
Apparatus | Purpose |
|---|---|
Signal generator | Used to operate the vibration generator and measure the frequency of the first harmonic |
Vibration generator | Connected to the signal generator to produce the stationary wave |
Retort stand | To provide a stable fixed end on the table |
G clamp or 2 kg mass | To place on the retort stand to stabilise apparatus |
2.0 m of string | Used to observe the stationary wave |
Pulley | To allow the masses to hang vertically, and introduces less friction than the edge of the table |
Wooden bridge | To provide the other fixed end which can vary the length of the string |
Mass hanger + 100 g masses | To hang from the pulley to vary tension in the string |
Metre ruler | To measure the length of the string |
Top-pan balance | To measure the mass of the string |
Resolution of measuring equipment:
Metre ruler = 1 mm
Signal generator ~ 10 nHz
Top-pan balance = 0.005 g
Method
This method is an example of the procedure for varying the length of the string with the frequency – this is just one possible relationship that can be tested
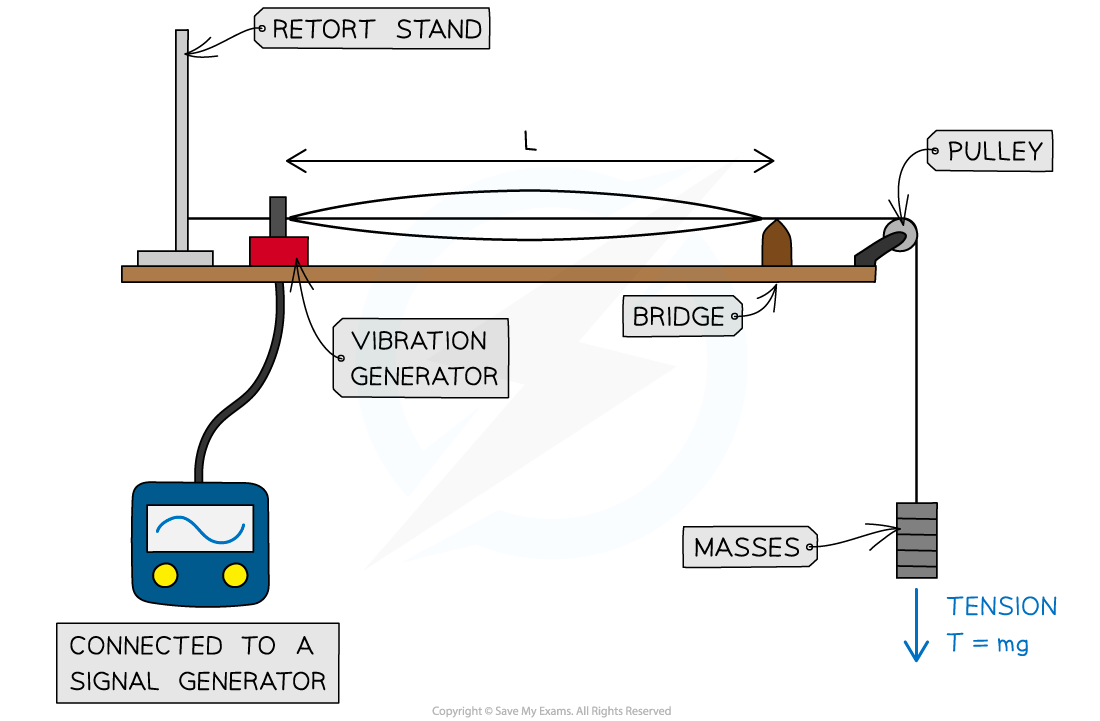
Set up the apparatus by attaching one end of the string to the vibration generator and pass the other end over the bench pulley and attach the mass hanger.
Adjust the position of the bridge so that the length L is measured from the vibration generator to the bridge using a metre ruler.
Turn on the signal generator to set the string oscillating.
Increase the frequency of the vibration generator until the first harmonic is observed and read the frequency that this occurs at.
Repeat the procedure with different lengths.
Repeat the frequency readings at least two more times and take the average of these measurements.
Measure the tension in the string using
where m is the amount of mass attached to the string and g is the gravitational field strength on Earth (9.81 N kg–1)
Measure the mass per unit length of the string .
Simply take a known length of the string (1 m is ideal) and measure its mass on a balance
An example of a table with some possible string lengths might look like this:
/ m | / Hz | / Hz | / Hz | / Hz |
|---|---|---|---|---|
0.2 | ||||
0.4 | ||||
0.6 | ||||
0.8 | ||||
1.0 | ||||
1.2 | ||||
1.4 | ||||
1.6 |
Analysing the results
For the first harmonic, wavelength,
So, the speed of the stationary wave is:
Rearranging for frequency, :
Comparing this to the equation of a straight line: y = mx
Gradient
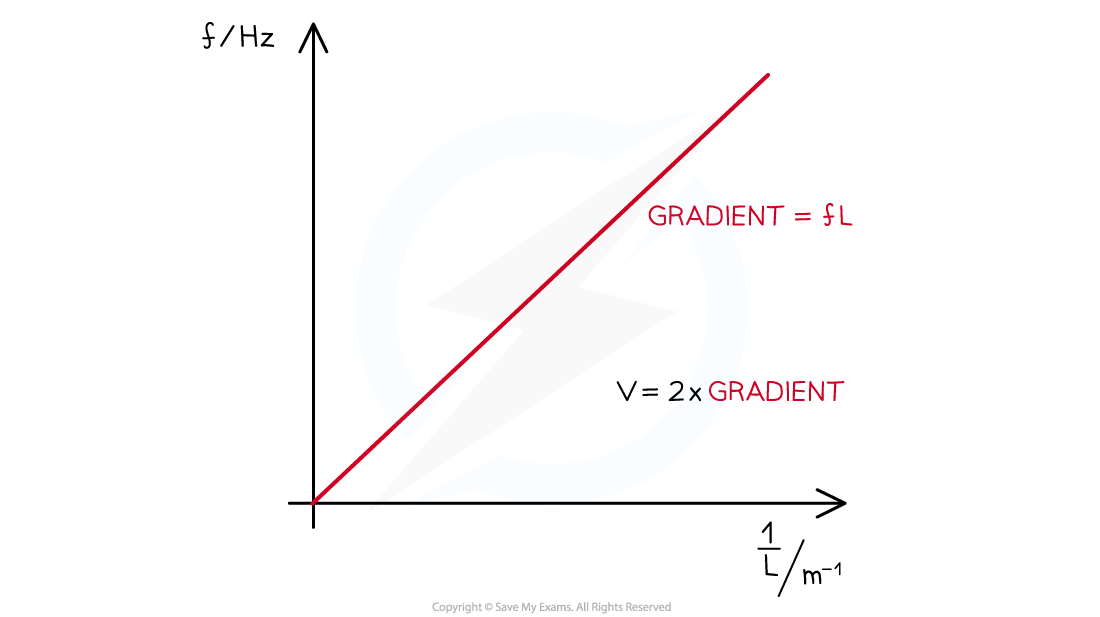
Plot a graph of the mean values of against .
Draw a line of best fit and calculate the gradient.
Work out the wave speed, which will be 2 × gradient:
Verify the wave speed of the travelling waves using the equation:
Where:
= tension (N)
= mass per unit length (kg m−1)
Assess the uncertainties in the measurements of length and the frequency and carry out calculations to determine the uncertainty in the wave speed
Evaluating the experiment
Systematic errors:
An oscilloscope can be used to verify the signal generator’s readings
The signal generator should be left for about 20 minutes to stabilise
The measurements would have a greater resolution if the length used is as large as possible, or as many half-wavelengths as possible
This means measurements should span a suitable range, for example, 20 cm intervals over at least 1.0 m
Random errors:
The sharpness of resonance leads to the biggest problem in deciding when the first harmonic is achieved
This can be resolved by adjusting the frequency while looking closely at a node — this is a technique to gain the largest response
Looking at the amplitude is likely to be less reliable since the wave will be moving very fast
When taking repeat measurements of the frequency, the best procedure is as follows:
Determine the frequency of the first harmonic when the largest vibration is observed and note down the frequency at this point
Increase the frequency and then gradually reduce it until the first harmonic is observed again and note down the frequency of this
If taking three repeat readings, repeat this procedure again
Average the three readings and move onto the next measurement
Safety considerations
Use a rubber string instead of a metal wire, in case it snaps under tension
If using a metal wire, wear goggles to protect the eyes in case it snaps
Stand well away from the masses in case they fall onto the floor
Place a crash mat or any soft surface under the masses to break their fall
Worked Example
A student investigates the relationship between the frequency of the stationary waves on a wire and the tension in the wire. The tension is varied by adding masses to a hanger which is attached to a pulley over one end of a table. The student records the following data:
Mass of the wire = 0.16 g
Length of the wire weighed = 1.0 m
Distance between the fixed ends = 0.4 m
Mass on hanger / kg | Frequency / Hz 1st reading | Frequency / Hz 2nd reading | Frequency / Hz Mean |
|---|---|---|---|
0.20 | 140 | 135 | |
0.40 | 195 | 200 | |
0.60 | 240 | 240 | |
0.80 | 280 | 278 | |
1.00 | 310 | 310 | |
1.20 | 340 | 340 | |
1.40 | 365 | 368 | |
1.60 | 392 | 390 |
Calculate the frequency using the relation between frequency, length, tension and mass per unit length. Evaluate the percentage uncertainty in these values.
[7]
Answer:
Step 1: Calculate the mean values of frequency
The mean readings are: 138 Hz; 198 Hz; 240 Hz; 279 Hz; 310 Hz; 340 Hz; 367 Hz; 391 Hz
Step 2: Work out the tensions and mass per unit length
Use the equation to calculate the frequency for a mass of 0.20 kg:
[1 mark]
[1 mark]
Working in the same way, the frequencies for the remaining lengths are: 200 Hz; 240 Hz; 280 Hz; 310 Hz; 340 Hz; 370 Hz; 390 Hz [1 mark]
Step 3: Determine the uncertainties in each quantity
Mass on hanger
The maximum uncertainty is likely to be 0.005 kg
Therefore, % uncertainty in measurement of 0.2 kg is
Since each mass has an uncertainty of 0.005 kg, these are added together as the masses increase, so each mass has the same percentage uncertainty i.e. [1 mark]
Length
Resolution of a metre ruler is 1 mm, but errors of up to 1 cm are possible in this set up
Therefore, % uncertainty in measurement of 0.4 m is [1 mark]
Mass per unit length
The resolution of a metre ruler is 1 mm and the resolution of a top-pan balance is 0.005 g
Therefore the uncertainty in the mass per unit length:
Therefore, % uncertainty in measurement of 0.16 g m-1 is [1 mark]
Step 4: Determine the uncertainties in the mean frequency values
Since tension (proportional to the mass on the hanger) and mass per unit length are to the power of , their % uncertainties are halved
Maximum % uncertainty in calculated frequencies would be the % uncertainty in each value added together:
% uncertainty in frequency = 2.5% + 1.25% + 1.5% = 5.25% [1 mark]

Unlock more, it's free!
Join the 100,000+ Students that ❤️ Save My Exams
the (exam) results speak for themselves:

Was this revision note helpful?
Build on this topic