Motion Along a Straight Line (AQA A Level Physics): Revision Note
Exam code: 7408

Displacement, speed, velocity & acceleration
Scalar quantities
Scalar quantities only have a magnitude (size)
Distance: the total length between two points
Speed: the total distance travelled per unit of time
Vector quantities
Vector quantities have both magnitude and direction
Displacement: the distance of an object from a fixed point in a specified direction
Velocity: the rate of change of displacement of an object
Acceleration: the rate of change of velocity of an object
Equations for velocity and acceleration
The equation for velocity is
Where:
= velocity (m s-1)
= change in displacement (m)
= change in time (s)
The equation for acceleration is
Where:
= acceleration (m s-2)
= change in velocity (m s-1)
= change in time (s)
Worked Example
A car accelerates uniformly from rest to a speed of 150 km h–1 in 6.2 s. Calculate the magnitude of the acceleration of the car in m s–2.
[2]
Answer:
Step 1: Convert the speed from km h-1 to m s-1
[1 mark]
Step 2: Calculate the acceleration
[1 mark]
Average & instantaneous speed
Instantaneous speed / velocity
The instantaneous speed (or velocity) is the speed (or velocity) of an object at any given point in time
This could be for an object moving at a constant velocity or accelerating
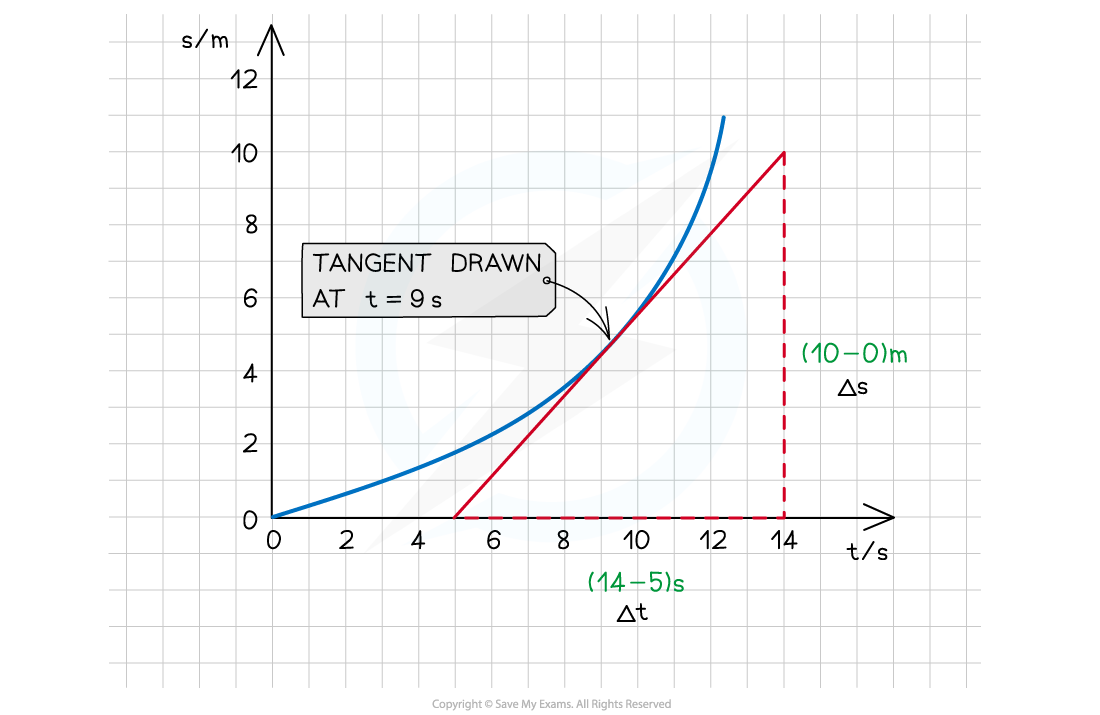
An object accelerating is shown by a curved line on a displacement – time graph
An accelerating object will have a changing velocity
To find the instantaneous velocity on a displacement-time graph:
Draw a tangent at the required time
Calculate the gradient of that tangent
Average speed / velocity
The average speed (or velocity) is the total distance (or displacement) divided by the total time
To find the average velocity on a displacement-time graph, divide the total displacement (on the y-axis) by the total time (on the x-axis)
This method can be used for both a curved or a straight-line on a displacement-time graph
Worked Example
A cyclist travels a distance of 20 m at a constant speed then decelerates to a traffic light 5 m ahead. The whole journey takes 3.5 s. Calculate the average speed of the cyclist.
[2]
Answer:
Step 1: Write the average speed equation
Step 2: Calculate the total distance
[1 mark]
Step 3: Calculate the average speed
[1 mark]
Uniform & non-uniform acceleration graphs
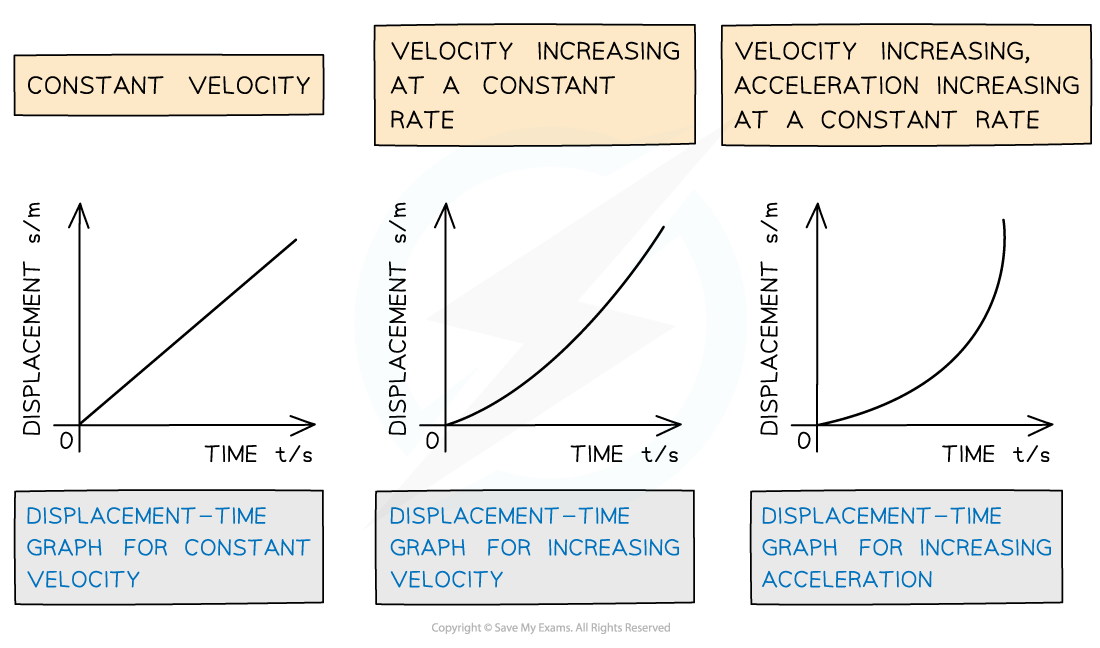
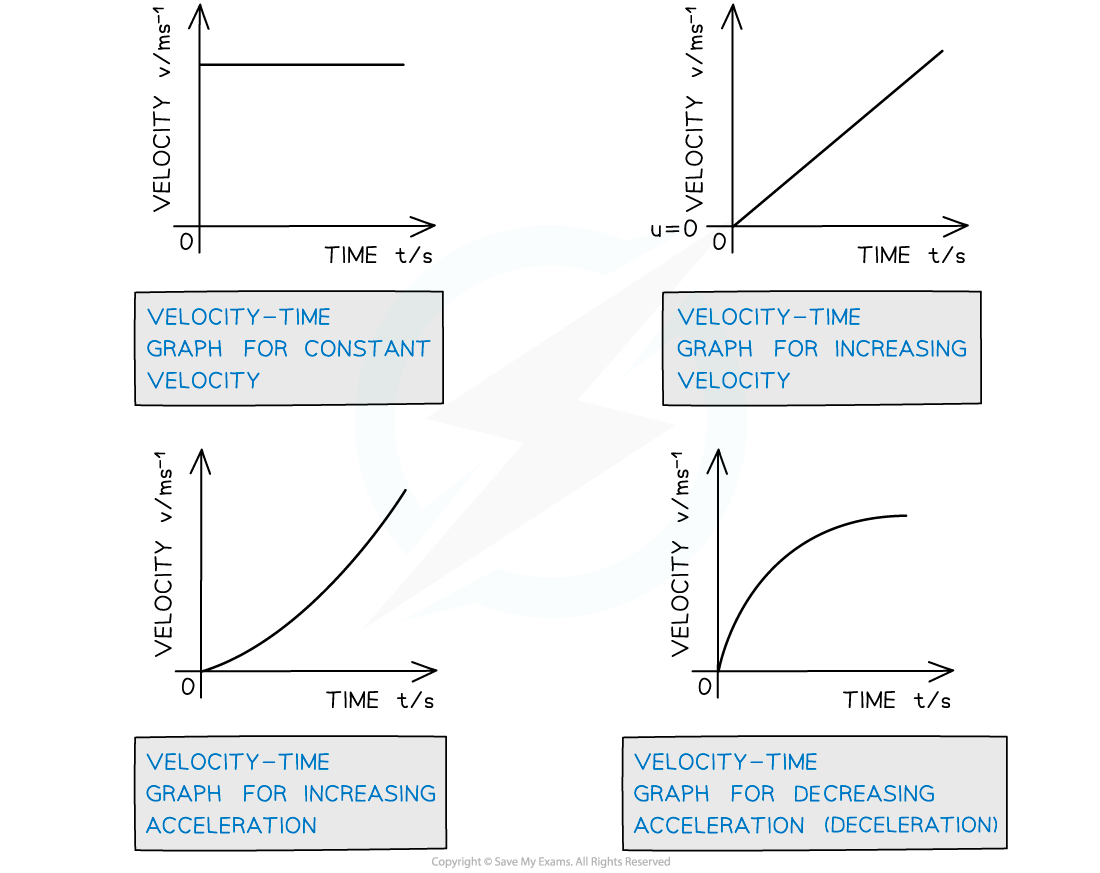
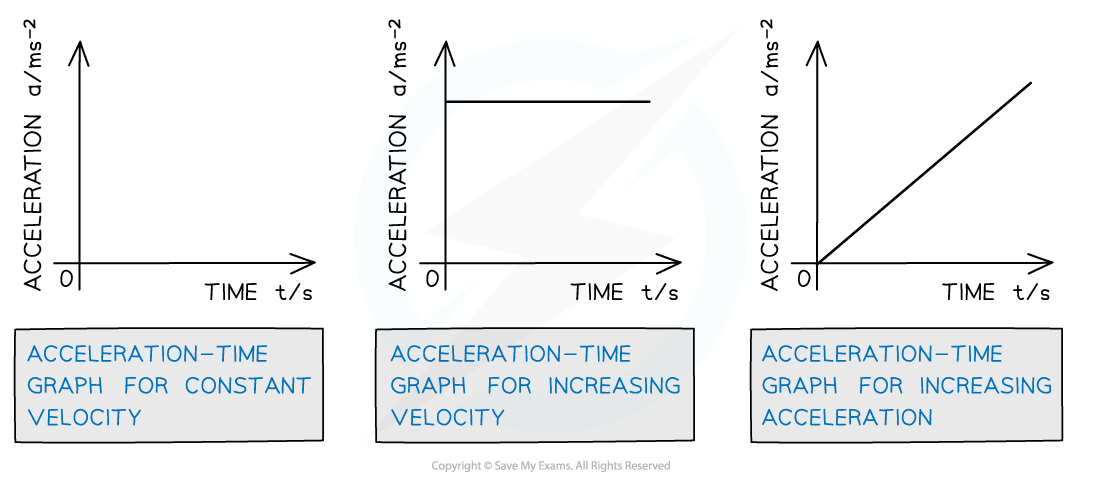
Three types of graph that can represent motion are displacement-time graphs, velocity-time graphs and acceleration-time graphs
Displacement-time graph
On a displacement-time graph:
The gradient (or slope) equals velocity
The y-intercept equals the initial displacement
A diagonal straight line represents a constant velocity
A positive slope represents motion in the positive direction
A negative slope represents motion in the negative direction
A curved line represents an acceleration
A horizontal line (zero slope) represents a state of rest
The area under the curve is meaningless
Remember the displacement-time graph can have positive or negative values on the displacement axis
However, a distance-time graph only has positive values
Velocity-time graph
On a velocity-time graph:
Slope equals acceleration
The y-intercept equals the initial velocity
A straight line represents uniform acceleration
A positive slope represents an increase in velocity (acceleration) in the positive direction
A negative slope represents an increase in velocity (acceleration) in the negative direction
A curved line represents the non-uniform acceleration
A horizontal line (zero slope) represents motion with constant velocity
The area under the curve equals the displacement or distance travelled
Remember the velocity-time graph can have positive or negative values on the displacement axis
However, a speed-time graph only has positive values
Acceleration-time graph
On an acceleration-time graph:
The slope is meaningless
The y-intercept equals the initial acceleration
A horizontal line (zero slope) represents an object undergoing constant acceleration
The area under the curve equals the change in velocity

Unlock more, it's free!
Join the 100,000+ Students that ❤️ Save My Exams
the (exam) results speak for themselves:

Was this revision note helpful?
Build on this topic