Required Practical: Charging & Discharging Capacitors (AQA A Level Physics): Revision Note
Exam code: 7408

Required practical: charging & discharging capacitors
Aim of the experiment
The overall aim of this experiment is to calculate the capacitance of a capacitor
This is just one example of how this required practical might be carried out
Variables
Independent variable = time,
Dependent variable = potential difference,
Control variables:
Resistance of the resistor
Current in the circuit
Equipment list
Apparatus | Purpose |
|---|---|
Switch | To switch between the charging and discharging circuit |
Capacitor | To measure the capacitance |
10 kΩ resistor | To discharge the capacitor |
Battery pack (power supply) | To provide the potential difference across the capacitor |
Voltmeter | To measure the potential difference across the capacitor |
Stopwatch | To measure the time taken for the capacitor to discharge |
Resolution of measuring equipment:
Voltmeter = 0.1 V
Stopwatch = 0.01 s
Method
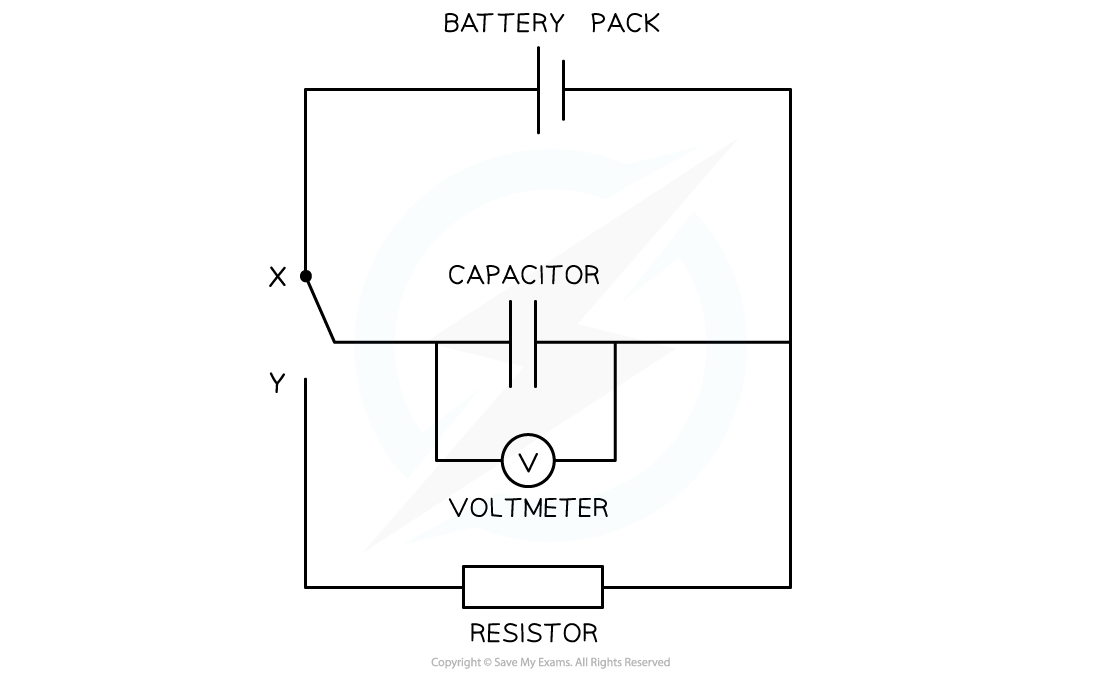
Set up the apparatus like the circuit above, making sure the switch is not connected to X or Y (no current should be flowing through).
Set the battery pack to a potential difference of 10 V and use a 10 kΩ resistor. The capacitor should initially be fully discharged.
Charge the capacitor fully by placing the switch at point X. The voltmeter reading should read the same voltage as the battery (10 V).
Move the switch to point Y.
Record the voltage reading every 10 s down to a value of 0 V. A total of eight to ten readings should be taken.
An example table might look like this:
Time / s | Potential difference / V |
|---|---|
0.00 | |
10.00 | |
20.00 | |
30.00 | |
40.00 | |
50.00 | |
60.00 | |
70.00 | |
80.00 |
Analysing the results
The potential difference (p.d) across the capacitance is defined by the equation:
Where:
= p.d across the capacitor (V)
= initial p.d across the capacitor (V)
= exponential function
= time (s)
= resistance of the resistor (Ω)
= capacitance of the capacitor (F)
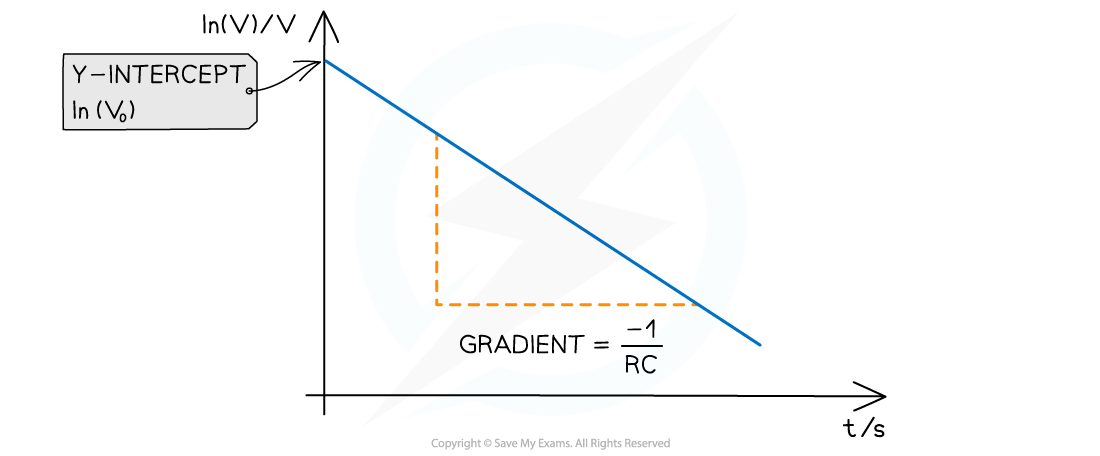
Rearranging this equation for by taking the natural log () of both sides:
Comparing this to the equation of a straight line:
Plot a graph of against and draw a line of best fit.
Calculate the gradient (this should be negative).
The capacitance of the capacitor is equal to:
Evaluating the experiment
Systematic Errors:
If a digital voltmeter is used, wait until the reading is settled on a value if it is switching between two
If an analogue voltmeter is used, reduce parallax error by reading the p.d at eye level to the meter
Make sure the voltmeter starts at zero to avoid a zero error
Random Errors:
Use a resistor with a large resistance so the capacitor discharges slowly enough for the time to be taken accurately at p.d intervals
Using a datalogger will provide more accurate results for the p.d at a certain time
This will reduce the error in the speed of the reflex needed to stop the stopwatch at a certain p.d
The experiment could be repeated by measuring the time for the capacitor to charge instead
Safety considerations
Keep water or any fluids away from the electrical equipment
Make sure no wires or connections are damaged and contain appropriate fuses to avoid a short circuit or a fire
Using a resistor with too low a resistance will not only mean the capacitor discharges too quickly but also that the wires will become very hot due to the high current
Capacitors can still retain charge after power is removed which could cause an electric shock
These should be fully discharged and removed after a few minutes
Worked Example
A student investigates the relationship between the potential difference and the time it takes to discharge a capacitor using a 10 kΩ resistor. They obtain the following results:
Time / s | Potential difference / V |
|---|---|
0.00 | 10.00 |
10.00 | 8.95 |
20.00 | 7.58 |
30.00 | 6.13 |
40.00 | 4.90 |
50.00 | 4.12 |
60.00 | 3.00 |
70.00 | 2.03 |
The capacitor is labelled with a capacitance of 4200 µF. Calculate:
(i) The value of the capacitance of the capacitor discharged. [4]
(ii) The relative percentage error of the value obtained from the graph and this true value of the capacitance. [2]
Answer:
Part (i)
Step 1: Complete the table
Add an extra column and calculate this for each p.d
Time / s | Potential difference / V | / V |
|---|---|---|
0.00 | 10.00 | 2.30 |
10.00 | 8.95 | 2.19 |
20.00 | 7.58 | 2.03 |
30.00 | 6.13 | 1.81 |
40.00 | 4.90 | 1.59 |
50.00 | 4.12 | 1.42 |
60.00 | 3.00 | 1.10 |
70.00 | 2.03 | 0.71 |
[1 mark]
Step 2: Plot the graph of against average time
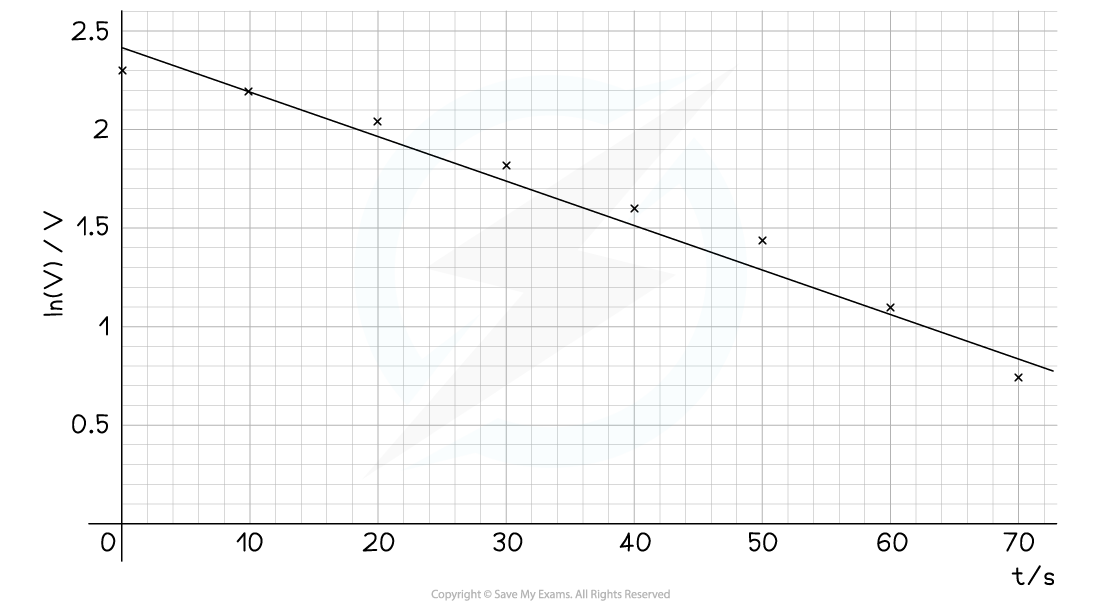
Make sure the axes are properly labelled and the line of best fit is drawn with a ruler [1 mark]
Step 3: Calculate the gradient of the graph
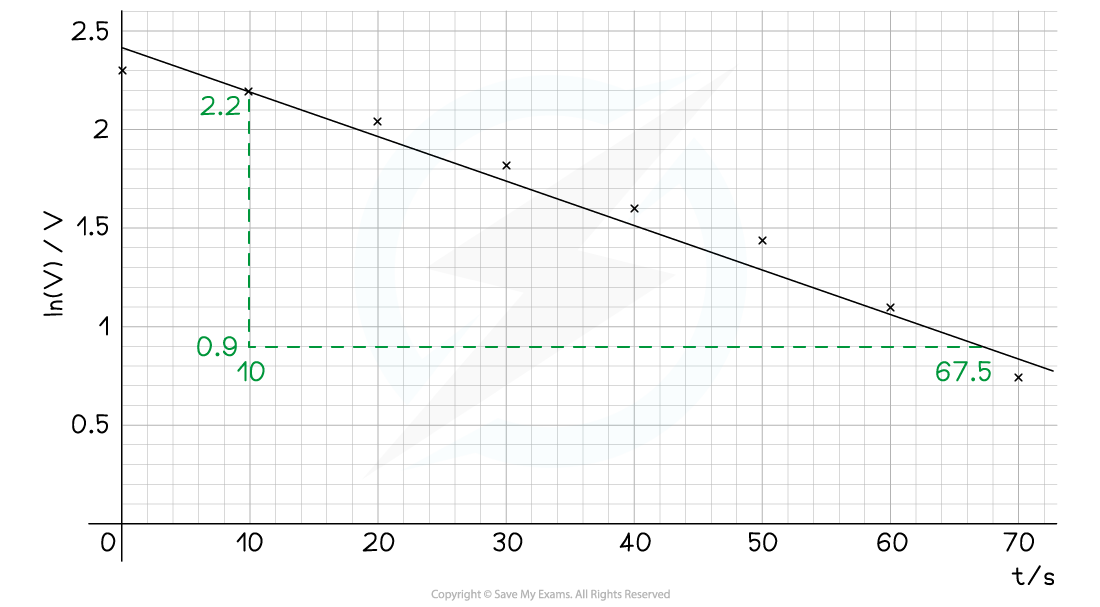
The gradient is calculated by:
[1 mark]
Step 4: Calculate the capacitance
[1 mark]
Part (ii)
Calculate the relative percentage error of the value obtained
[1 mark]
[1 mark]

Unlock more, it's free!
Join the 100,000+ Students that ❤️ Save My Exams
the (exam) results speak for themselves:

Was this revision note helpful?
Build on this topic