Required Practical: Investigating Resistivity (AQA A Level Physics): Revision Note
Exam code: 7408

Required practical: investigating resistivity
Aims of the experiment
The aim of the experiment is to determine the resistivity of a 2 metre constantan wire
Variables:
Independent variable = Length, L, of the wire (m)
Dependent variable = The current, I, through the wire (A)
Control variables:
Voltage through the wire
The material the wire is made from
Equipment list
Equipment | Purpose |
|---|---|
Ammeter | To determine the current through the wire |
Voltmeter | To determine the voltage across the wire |
2.0 m of constantan wire (22–36 swg) | To calculate its resistivity |
Flying lead | A wire with a crocodile clip at one end to allow connection at any point along the test wire |
Metre ruler | To measure the length of the wire |
Micrometer | To measure the diameter of the wire |
Power supply | To provide the voltage through the wire |
Resolution of measuring equipment:
Metre ruler = 1 mm
Micrometer screw gauge = 0.01 mm
Voltmeter = 0.1 V
Ammeter = 0.01 A
Method

Measure the diameter of the constantan wire using a micrometer.
The measurement should be taken between five and ten times randomly along the wire
Calculate the mean diameter from these values
Set up the equipment so the wire is taped or clamped to the ruler with one end of the circuit attached to the wire where the ruler reads 0.
The ammeter is connected in series and the voltmeter in parallel to the wire
Attach the flying lead to the test wire at 0.25 m.
Set the power supply at a voltage of 6.0 V.
Check that this is the voltage through the wire on the voltmeter
Read and record the current from the ammeter, then switch off the current immediately after the reading.
This is to prevent the wire from heating up and changing the resistivity
Vary the distance between the fixed end of the wire and the flying lead in 0.25 m intervals (0.25 m, 0.50 m, 0.75 etc.) until the full length of the 2.0 m wire.
The original length and the intervals can be changed (e.g. start at 0.1 m and increase in 0.1 m intervals), as long as there are eight to ten readings
Record the current for each length at least three times and calculate an average current, I.
For each length, calculate the average resistance of the length of the wire using the equation:
Where:
= average resistance of the length of the wire (Ω)
= potential difference across the circuit (V)
= the average current through the wire for the chosen length (A)
An example of a table of results might look like this:
Length of wire / m | Current / A | Current / A | Current / A | Average current / A | Resistance / Ω |
|---|---|---|---|---|---|
0.25 | |||||
0.50 | |||||
0.75 | |||||
1.00 | |||||
1.25 | |||||
1.50 | |||||
1.75 | |||||
2.00 |
Analysis of results
The resistivity, , of the wire is equal to
Where:
= resistivity (Ω m)
= resistance (Ω)
= cross-sectional area of the wire (m2)
= length of wire (m)
Rearranging for the resistance, R, gives:
Comparing this to the equation of a straight line:
Gradient,
Therefore, to find resistivity:
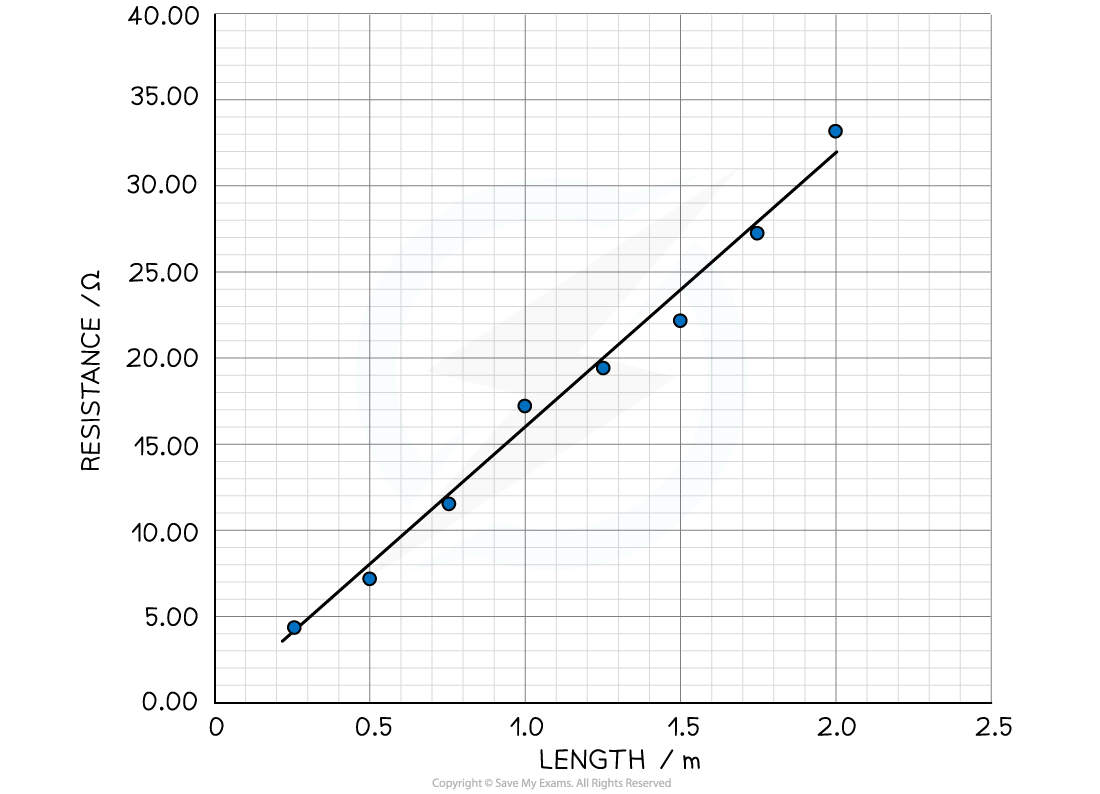
Plot a graph of the length of the wire, , against the average resistance of the wire
Draw a line of best fit
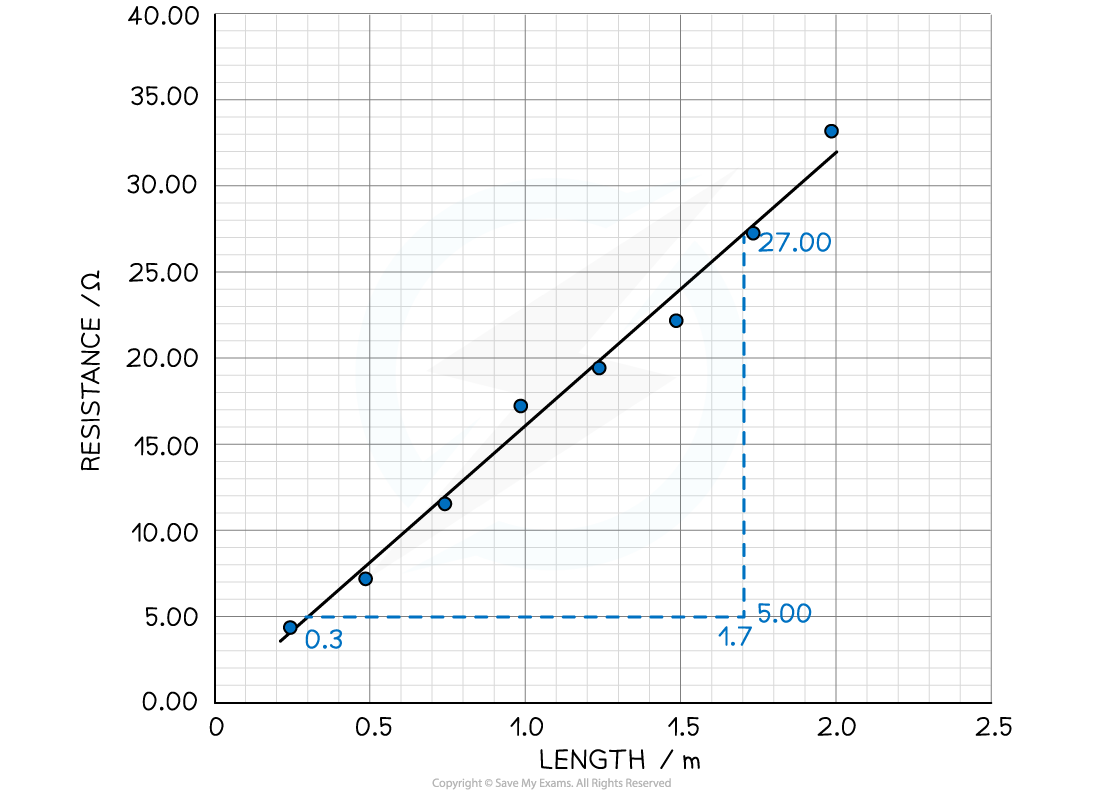
Calculate the gradient
Multiply the gradient by cross-sectional area,

To calculate the cross-sectional area, , of the wire
Evaluating the experiment
Systematic Errors:
The end of the wire that is attached to the circuit (not the flying lead) must start at 0 on the ruler
Otherwise, this could cause a zero error in the length measurements
Random Errors:
Only allow small currents to flow through the wire
The resistivity of a material depends on its temperature
The current flowing through the wire will cause its temperature to increase and affect its resistance and resistivity
Therefore the temperature is kept constant and low by small currents
The current should be switched off between readings so its temperature doesn't change its resistance
Make at least five to ten measurements of the diameter of the wire with the micrometer screw gauge and calculate an average diameter to reduce random errors in the reading
Safety considerations
When there is a high current, and a thin wire, the wire will become very hot
Make sure never to touch the wire directly when the circuit is switched on
Switch off the power supply right away if there is a smell of burning
Make sure there are no liquids close to the equipment, as this could damage the electrical equipment
Worked Example
A student wants to find the resistivity of a constantan wire. They set up the experiment by attaching one end of the wire to a circuit with a 6.0 V battery and the other with a flying lead and measure the length with a ruler. Attaching the flying lead onto the wire at different lengths, they obtain the following table of results.
Length of wire / m | Current / A | Current / A | Current / A | Average current / A | Resistance / Ω |
|---|---|---|---|---|---|
0.25 | 1.34 | 1.34 | 1.35 | ||
0.50 | 0.85 | 0.85 | 0.83 | ||
0.75 | 0.51 | 0.51 | 0.50 | ||
1.00 | 0.35 | 0.36 | 0.35 | ||
1.25 | 0.30 | 0.31 | 0.31 | ||
1.50 | 0.27 | 0.27 | 0.27 | ||
1.75 | 0.23 | 0.21 | 0.21 | ||
2.00 | 0.18 | 0.17 | 0.18 |
The following additional data for the wire is:
Average diameter / mm | ||||||||||
|---|---|---|---|---|---|---|---|---|---|---|
0.19 | 0.19 | 0.20 | 0.19 | 0.18 | 0.19 | 0.20 | 0.18 | 0.20 | 0.19 | 0.19 |
Calculate the resistivity of the wire.
[5]
Answer:
Step 1: Complete the average current and resistance columns in the table
The resistance is calculated using the equation
Length of wire / m | Current / A | Current / A | Current / A | Average current / A | Resistance / Ω |
|---|---|---|---|---|---|
0.25 | 1.34 | 1.34 | 1.35 | 1.34 | 4.48 |
0.50 | 0.85 | 0.85 | 0.83 | 0.84 | 7.14 |
0.75 | 0.51 | 0.51 | 0.50 | 0.51 | 11.76 |
1.00 | 0.35 | 0.36 | 0.35 | 0.35 | 17.14 |
1.25 | 0.30 | 0.31 | 0.31 | 0.31 | 19.35 |
1.50 | 0.27 | 0.27 | 0.27 | 0.27 | 22.22 |
1.75 | 0.23 | 0.21 | 0.21 | 0.22 | 27.27 |
2.00 | 0.18 | 0.17 | 0.18 | 0.18 | 33.33 |
[1 mark]
Step 2: Calculate the cross-sectional area of the wire from the diameter
The average diameter is 0.191 mm = 0.191 × 10⁻³ m
The cross-sectional area is equal to
[1 mark]
Step 3: Plot a graph of the length L against the resistance R
[1 mark]
Step 4: Calculate the gradient of the graph
[1 mark]
Step 5: Calculate the resistivity of the wire
[1 mark]
[1 mark]

Unlock more, it's free!
Join the 100,000+ Students that ❤️ Save My Exams
the (exam) results speak for themselves:

Was this revision note helpful?
Build on this topic