Resonance (AQA A Level Physics): Revision Note
Exam code: 7408

Resonance
The frequency of forced oscillations is referred to as the driving frequency (f) or the frequency of the applied force
All oscillating systems have a natural frequency (f0), this is defined as this is the frequency of an oscillation when the oscillating system is allowed to oscillate freely
Oscillating systems can exhibit a property known as resonance
When the driving frequency approaches the natural frequency of an oscillator, the system gains more energy from the driving force
Eventually, when they are equal, the oscillator vibrates with its maximum amplitude, this is resonance
Resonance is defined as:
When the frequency of the applied force to an oscillating system is equal to its natural frequency, the amplitude of the resulting oscillations increases significantly
For example, when a child is pushed on a swing:
The swing plus the child has a fixed natural frequency
A small push after each cycle increases the amplitude of the oscillations to swing the child higher. This frequency at which this push happens is the driving frequency
When the driving frequency is exactly equal to the natural frequency of the swing oscillations, resonance occurs
If the driving frequency does not quite match the natural frequency, the amplitude will increase but not to the same extent as when resonance is achieved
This is because, at resonance, energy is transferred from the driver to the oscillating system most efficiently
Therefore, at resonance, the system will be transferring the maximum kinetic energy possible
A graph of driving frequency f against amplitude A of oscillations is called a resonance curve. It has the following key features:
When f < f0, the amplitude of oscillations increases
At the peak where f = f0, the amplitude is at its maximum. This is resonance
When f > f0, the amplitude of oscillations starts to decrease
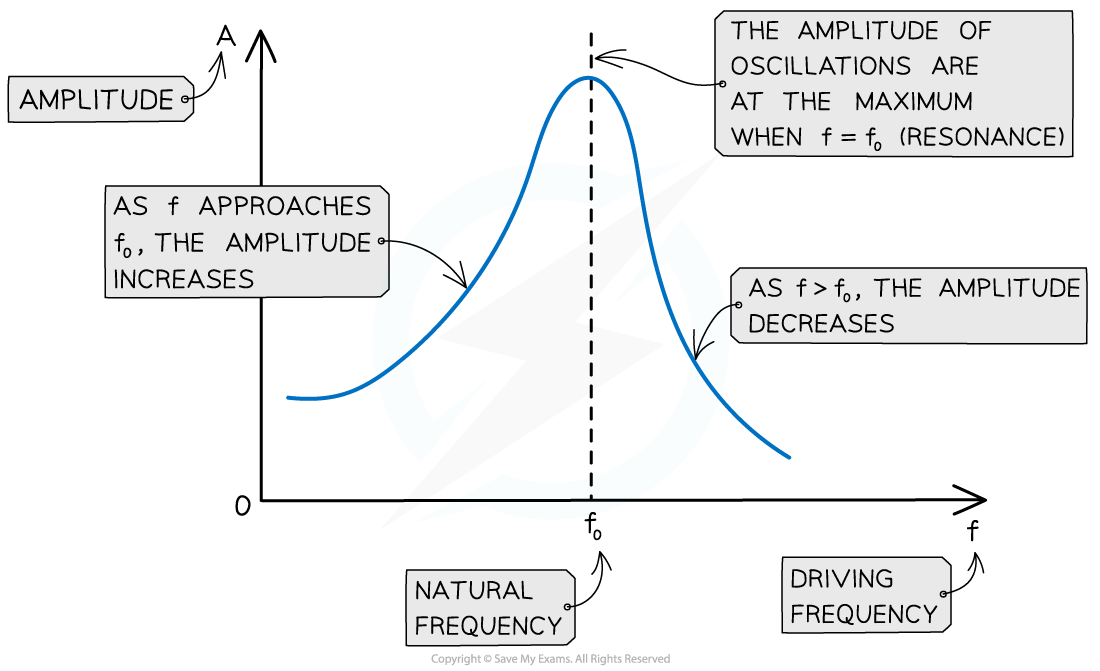
The maximum amplitude of the oscillations occurs when the driving frequency is equal to the natural frequency of the oscillator
The Effects of Damping on Resonance
Damping reduces the amplitude of resonance vibrations
The height and shape of the resonance curve will therefore change slightly depending on the degree of damping
Note: the natural frequency f0 of the oscillator will remain the same
As the degree of damping is increased, the resonance graph is altered in the following ways:
The amplitude of resonance vibrations decrease, meaning the peak of the curve lowers
The resonance peak broadens
The resonance peak moves slightly to the left of the natural frequency when heavily damped
Therefore, damping reduced the sharpness of resonance and reduces the amplitude at resonant frequency
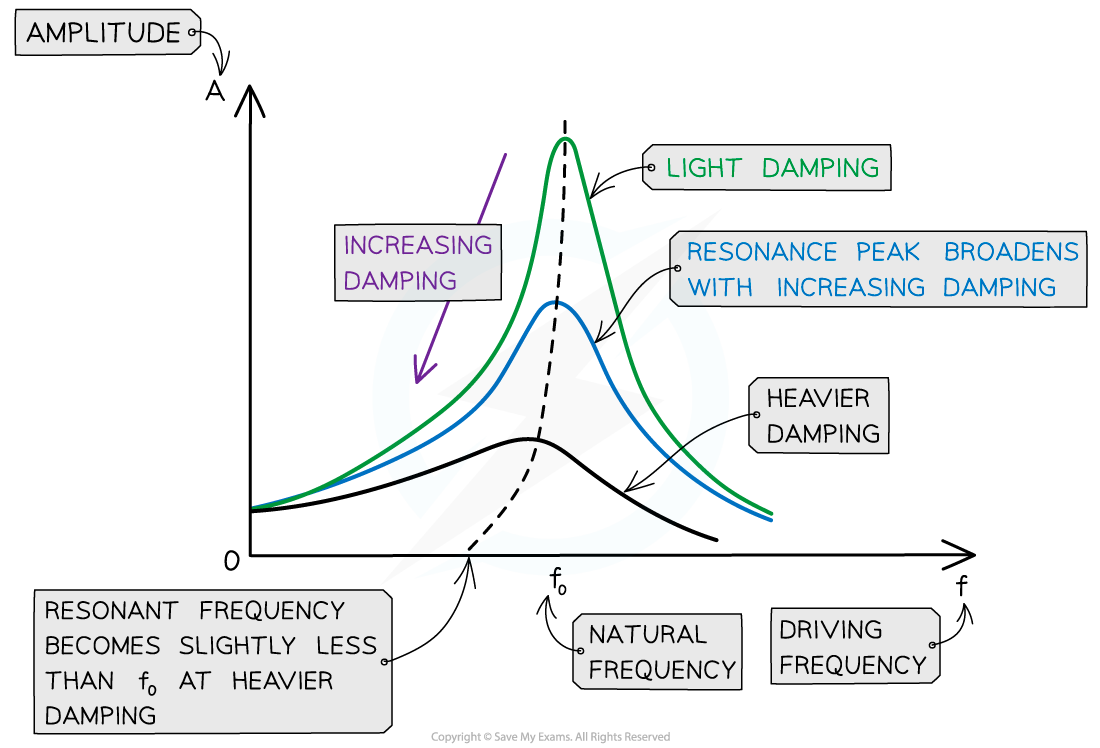
As damping is increased, resonance peak lowers, the curve broadens and moves slightly to the left
Resonance Effects
Resonance occurs for any forced oscillation where the frequency of the driving force is equal to the natural frequency of the oscillator
Examples include:
An organ pipe, where air resonates down an air column setting up a stationary wave in the pipe
Glass smashing from a high pitched sound wave at the right frequency
A radio tuned so that the electric circuit resonates at the same frequency as the specific broadcast
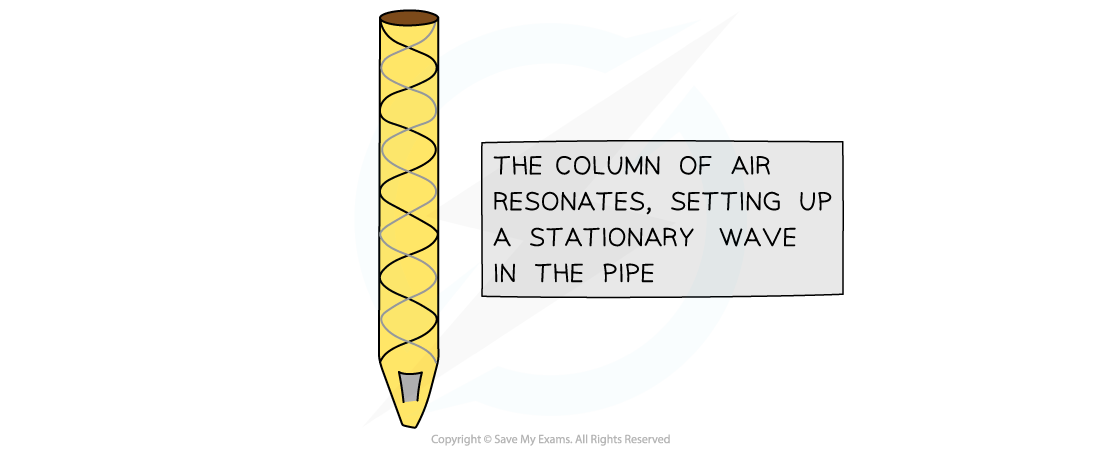
Standing waves forming inside an organ pipe from resonance
A mechanical system commonly used to show resonance is Barton's pendulums
A set of light pendulums labelled A-E are suspended from a string
A heavy pendulum X, with a length L, is attached to the string at one end and will act as the driving pendulum
When pendulum X is released, it pushes the string and begins to drive the other pendulums
Most of the pendulums swing with a low amplitude but pendulum C with the same length L has the largest amplitude
This is because its natural frequency is equal to the frequency of pendulum X (the driving frequency)
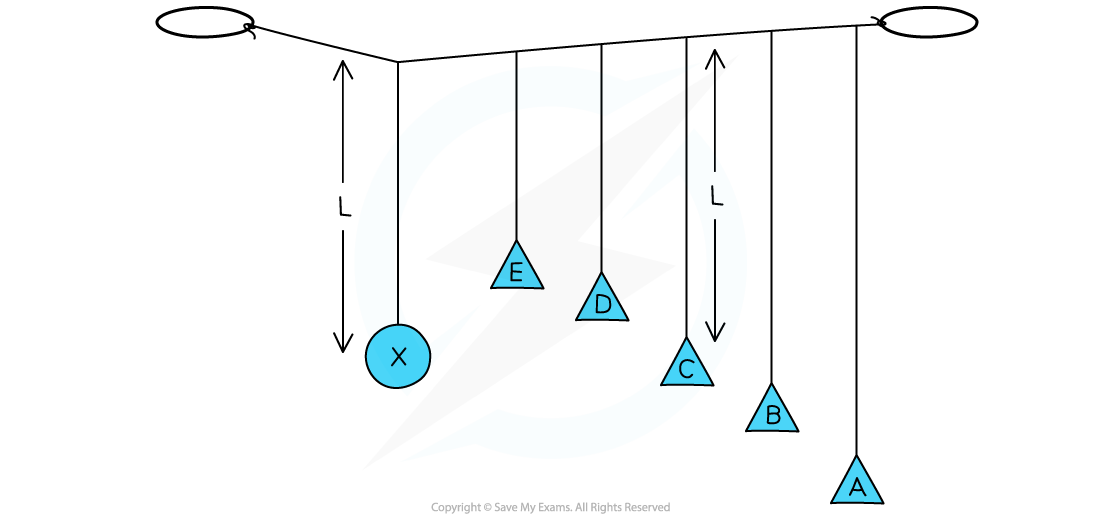
Barton's pendulums helps display resonance
The phase of the oscillations relative to the driver are:
Pendulums E and D with lengths < L are in phase
Pendulum C with length = L is 0.5π out of phase
Pendulums B and A with lengths > L are π out of phase

Unlock more, it's free!
Join the 100,000+ Students that ❤️ Save My Exams
the (exam) results speak for themselves:

Was this revision note helpful?
Build on this topic