Stress & Strain (AQA A Level Physics): Revision Note
Exam code: 7408

Tensile stress & strain
Opposite forces can deform an object
If the forces stretch the object, then they are tensile forces
Tensile forces lead to the two properties of materials known as tensile stress and tensile strain
Tensile stress
Tensile stress is defined as the force exerted per unit cross-sectional area of a material
Where:
= tensile stress (Pa)
= force applied (N)
= cross-sectional area (m2)
The ultimate tensile stress is the maximum force per original cross-sectional area a wire is able to support until it breaks
σ is the Greek letter lower-case 'sigma'
σ has the units of pascals (Pa), which is the same units as pressure (also force ÷ area)
Tensile strain
Strain is the extension per unit length
This is a deformation of a solid due to stress in the form of elongation or contraction
Where:
= extension (m)
= original length (m)
The strain is a dimensionless unit because it’s the ratio of lengths
Sometimes strain might be written as a percentage
For example, extending a 0.1 m wire by 0.005 m would produce a strain of (0.005 ÷ 0.1) × 100 = 5 %
Worked Example
A brass wire of length 4.50 m and a radius of 0.2 mm is extended to a total length of 4.53 m when a tensile force of 50 N is applied.
Calculate for the brass wire:
(i) The tensile stress [2]
(ii) The tensile strain [2]
Answer:
Part (i)
Step 1: Write down the tensile stress equation
Step 2: Calculate the cross-sectional area, A of the wire
A wire has a circular cross-sectional area = πr2
[1 mark]
Step 3: Substitute values in the tensile stress equation
[1 mark]
Part (ii)
Step 1: Write down the tensile strain equation
Step 2: Determine the extension
The extension is total length – the original length
[1 mark]
Step 3: Substitute values in the tensile strain equation
[1 mark]
Examiner Tips and Tricks
Since strain is a ratio, you don't have to convert the extension and original length into metres. As long as they both have the same units, your strain will be correct.
Stress-strain curves
Stress-strain curves describe the properties of materials such as whether they are brittle, ductile and up to what stress and strain they obey Hooke's Law and have elastic and / or plastic behaviour
Each material will have a unique stress-strain curve
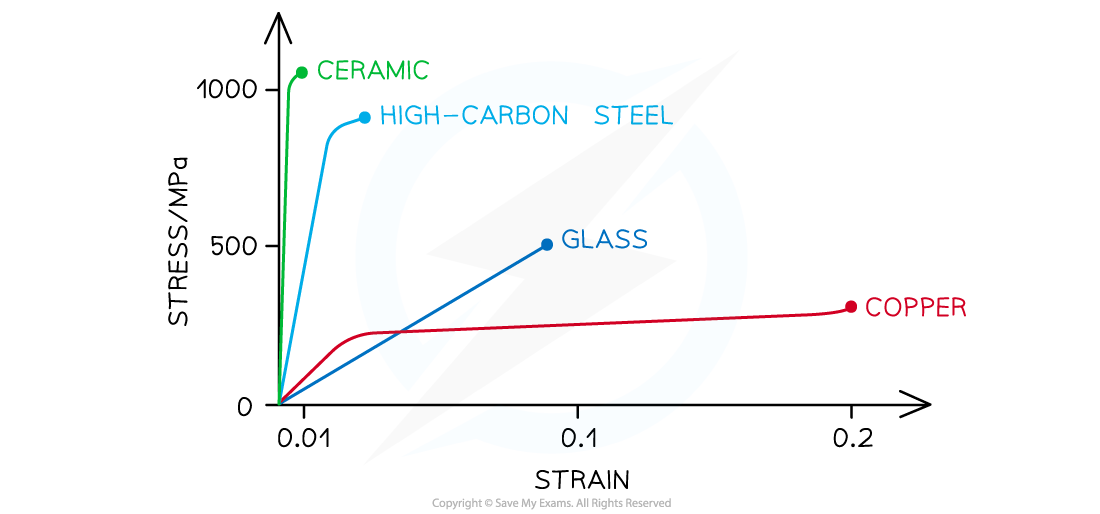
There are important points on the stress-strain graph, some are similar to the force-extension graph
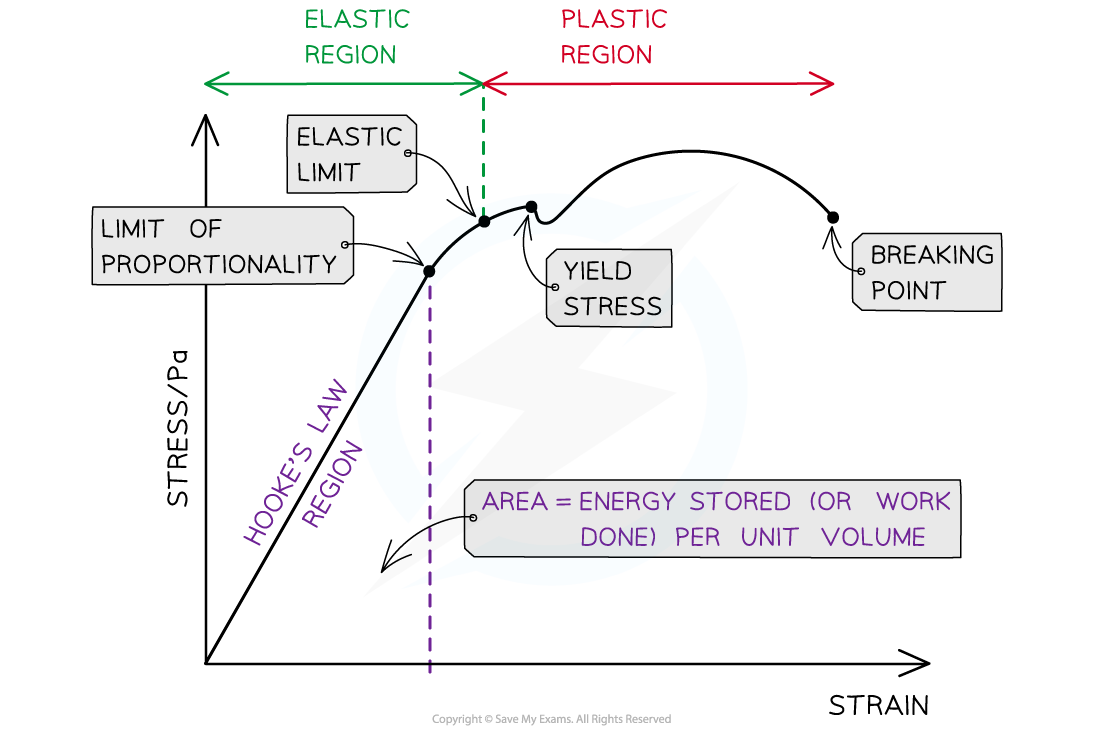
The key points that are unique to the stress-strain graph are:
Yield Stress: The force per unit area at which the material extends plastically for no / a small increase in stress
The elastic strain energy stored per unit volume is the area under the Hooke's Law (straight line) region of the graph
Breaking point: The stress at this point is the breaking stress
This is the maximum stress a material can stand before it fractures
Elastic region: The region of the graph up till the elastic limit
In this region, the material will return to its original shape when the applied force is removed
Plastic region: The region of the graph after the elastic limit
In this region, the material has deformed permanently and will not return to its original shape when the applied force is removed
Worked Example
The graph below shows a stress-strain curve for a copper wire.
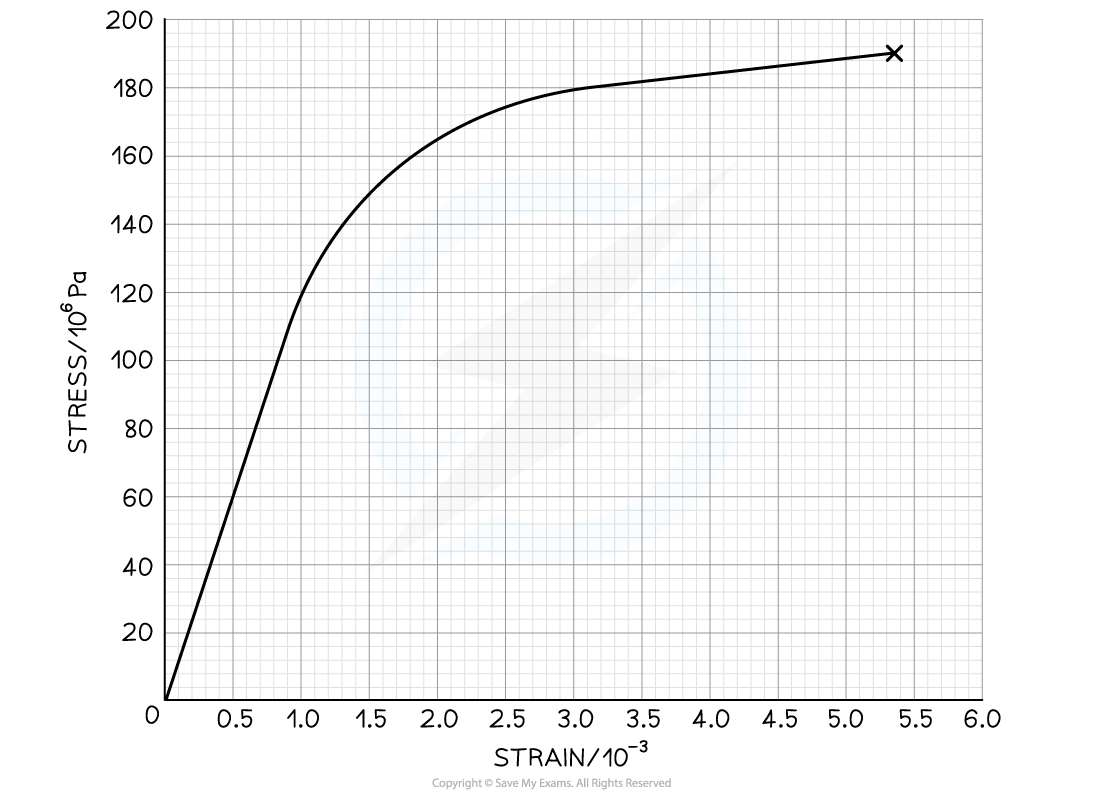
From the graph state the value of:
(i) The breaking stress [1]
(ii) The stress at which plastic deformation begins [1]
Answer:
Part (i)
Step 1: Define breaking stress
The breaking stress is the maximum stress a material can stand before it fractures
This is the stress at the final point on the graph
Step 2: Determine breaking stress from the graph
Draw a line to the y axis at the point of fracture
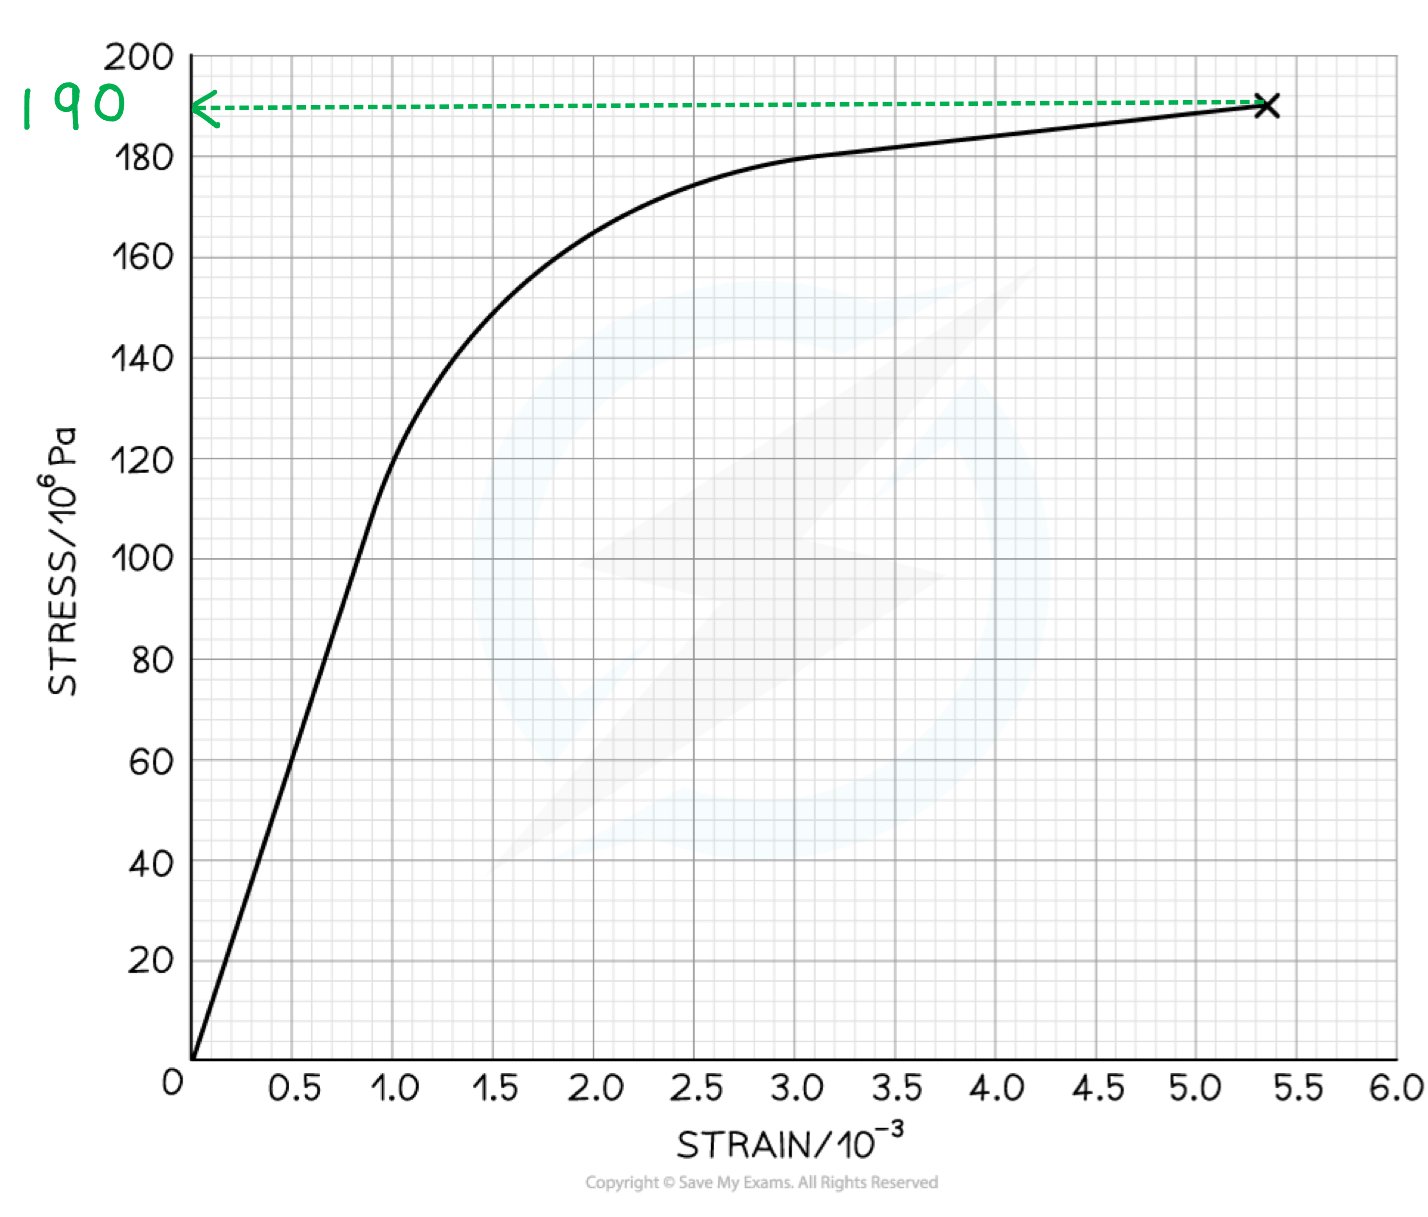
Therefore, the breaking stress is 190 MPa [1 mark]
Part (ii)
Step 1: Define plastic deformation
Plastic deformation is when the material is deformed permanently and will not return to its original shape once the applied force is removed
This is shown on the graph where it is curved
Step 2: Determine the stress of where plastic deformation begins on the graph
Draw a line to the y axis at the point where the graph starts to curve
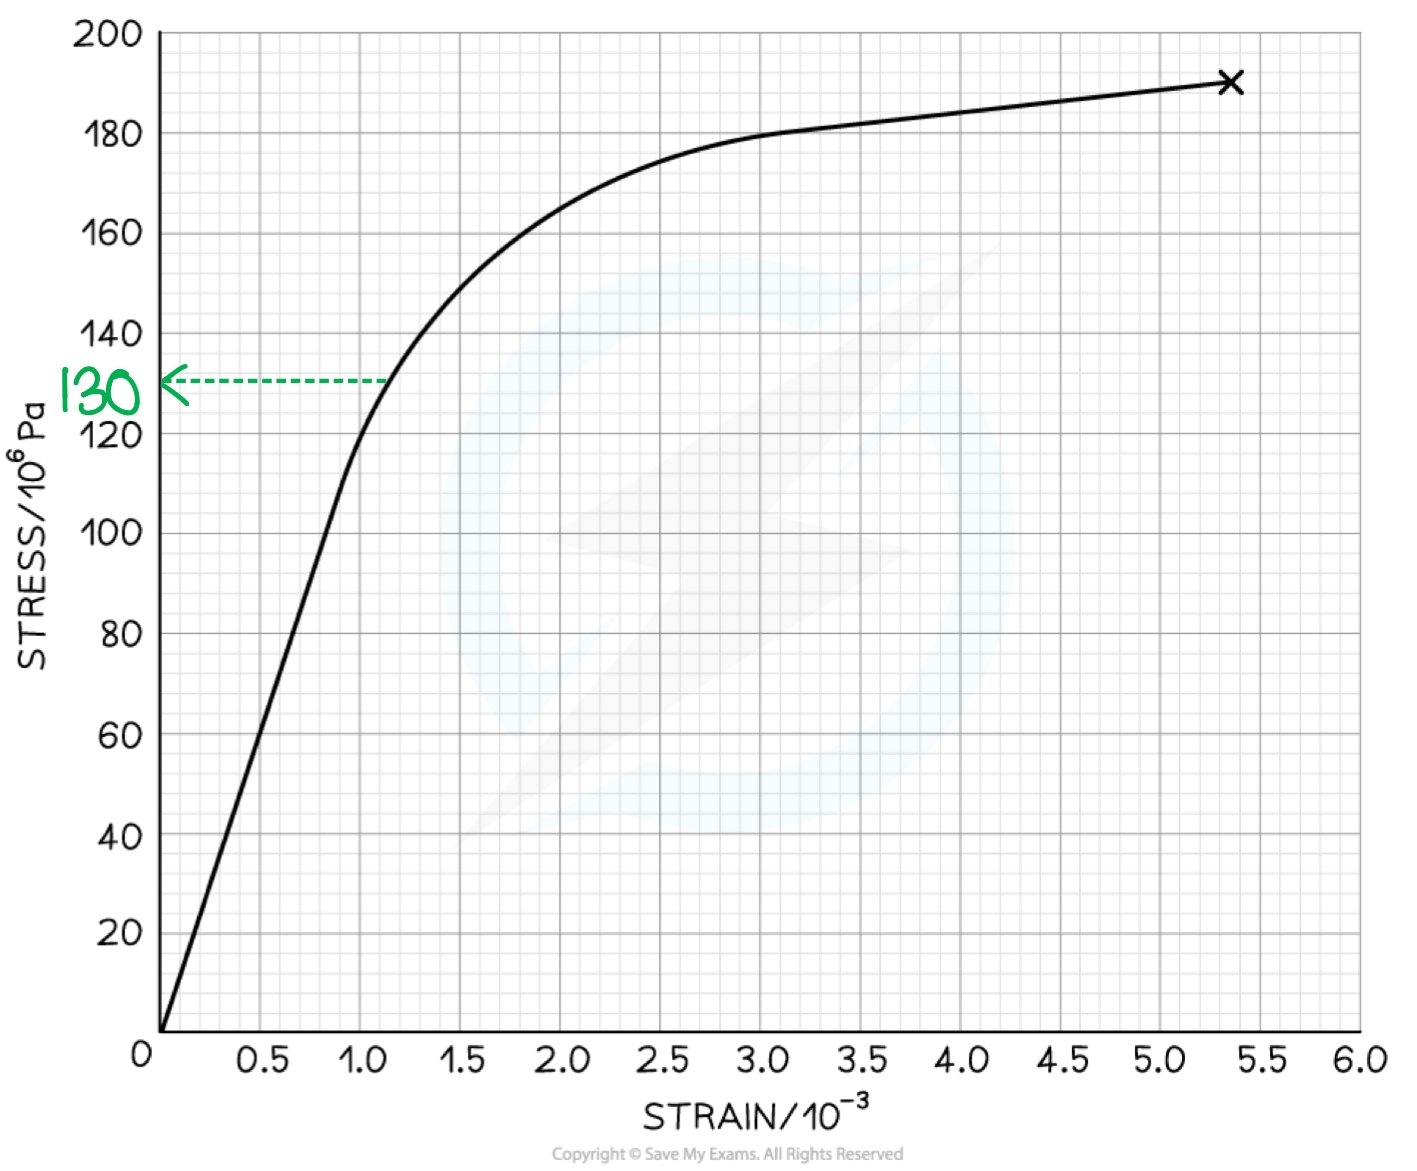
Therefore, plastic deformation begins at a stress of 130 MPa [1 mark]
Examiner Tips and Tricks
When you read a value off a graph where the reading is subjective, the mark scheme usually accepts a range. In the graph above, you would get the mark for any value from 120 MPa to 135 MPa for where the graph starts to curve.

Unlock more, it's free!
Join the 100,000+ Students that ❤️ Save My Exams
the (exam) results speak for themselves:

Was this revision note helpful?
Build on this topic